
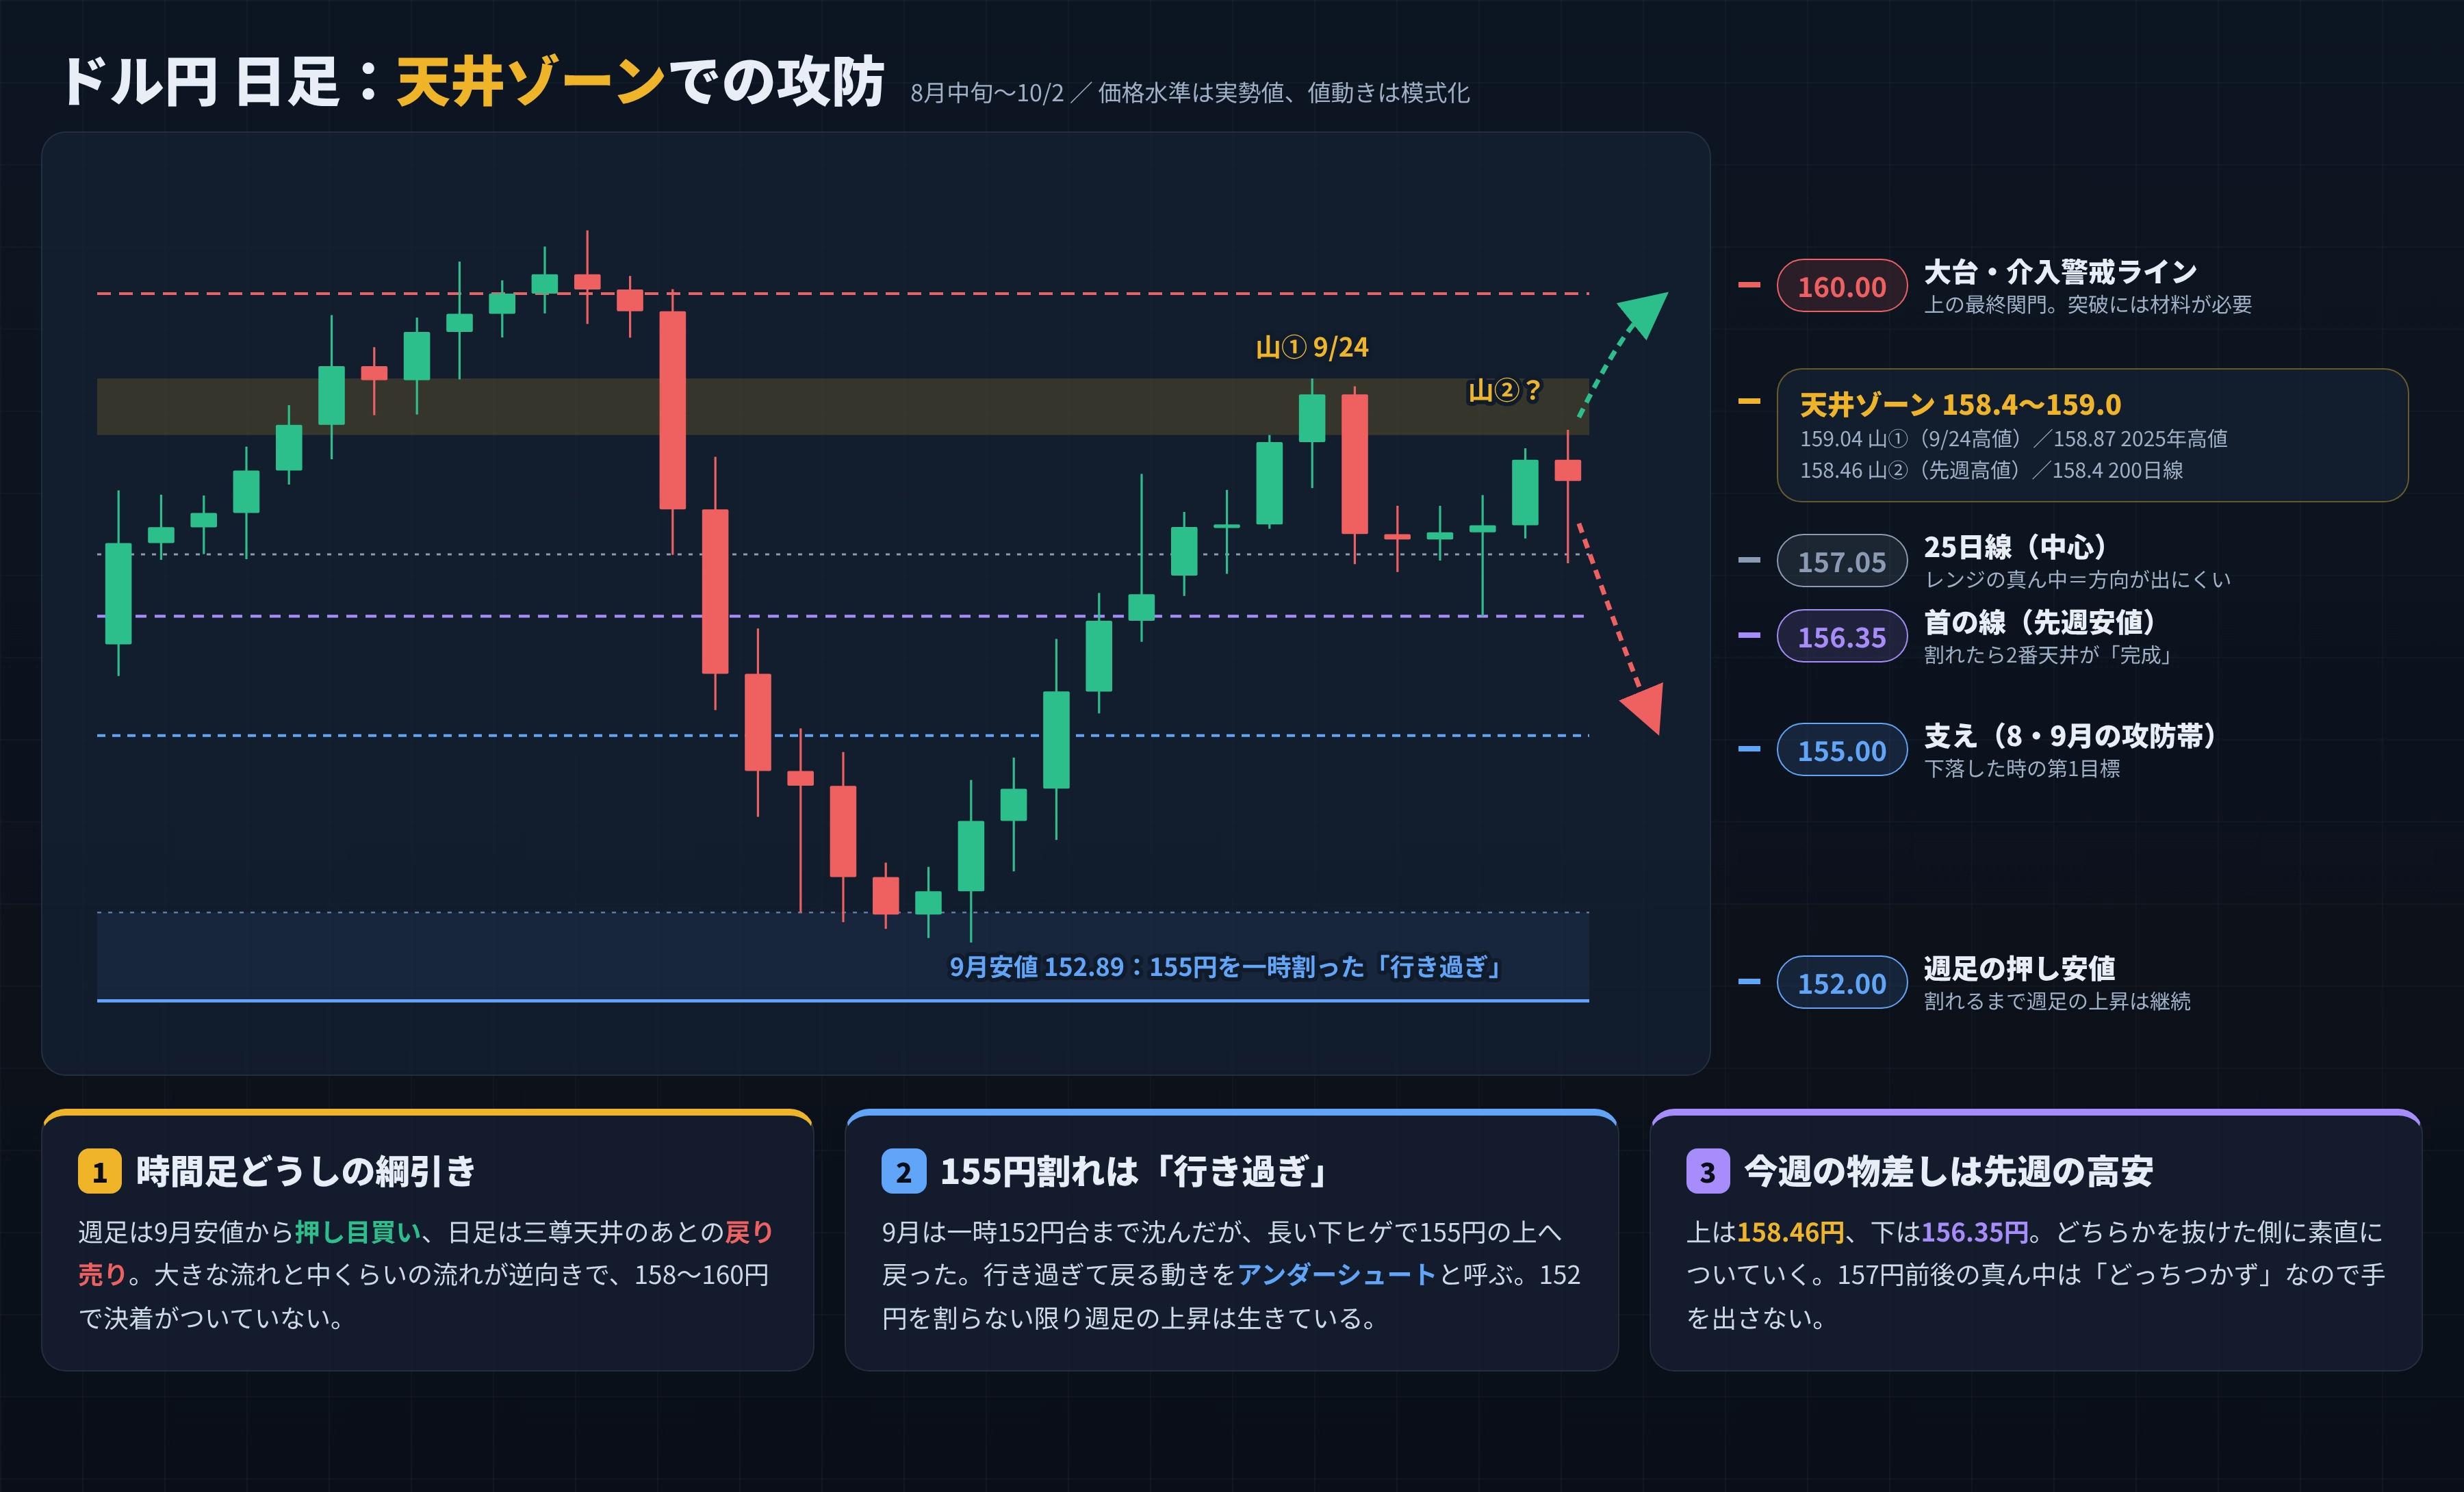
The dollar/yen is being stopped at the "ceiling zone" of 158.4–159 yen.
The USD/JPY is being stopped in the “ceiling zone” around 158.4–159 yen.
Will the high of last week at 158.46 yen become the “second peak,” or will it break down and test 160 yen?
The answer depends on which of last week’s high or low is broken first.
■Current position (hourly chart tug-of-war)
────────────────────────────────────────
Weekly chart: from the September low (152.89 yen), buying the dips has continued
→ The uptrend remains as long as 152 yen (weekly dip low) is not broken
Daily chart: after the triple-top, there is a pullback selling flow
→ 158–160 yen where the 200-day moving average and the 2025 high coincide tends to attract selling
The large uptrend (buying) and the medium uptrend (selling) are opposite, and a conclusion has not yet been reached.
Supplement: a break below 155 yen is an “undershoot” (overshoot)
In September, it temporarily sank to the 152 yen area, but returned above 155 yen with a long lower shadow.
Even if temporarily broken below support, a quick rebound is seen as an overshoot.
■Last week’s flow (9/28–10/2)
────────────────────────────────────────
9/28–29: churn around 157 yen
9/30: US core PCE came in softer, fell to an weekly low of 156.35 yen, then recovered to the 157 yen area
10/1: with a decrease in US unemployment claims, moved to the 158 yen region
10/2: Tokyo high at 158.46 yen. After the US employment report ( +29k, vs forecast +90k ),
it briefly fell to the 156 yen area, and finished in the upper 157 yen range (157.8–157.9 yen)
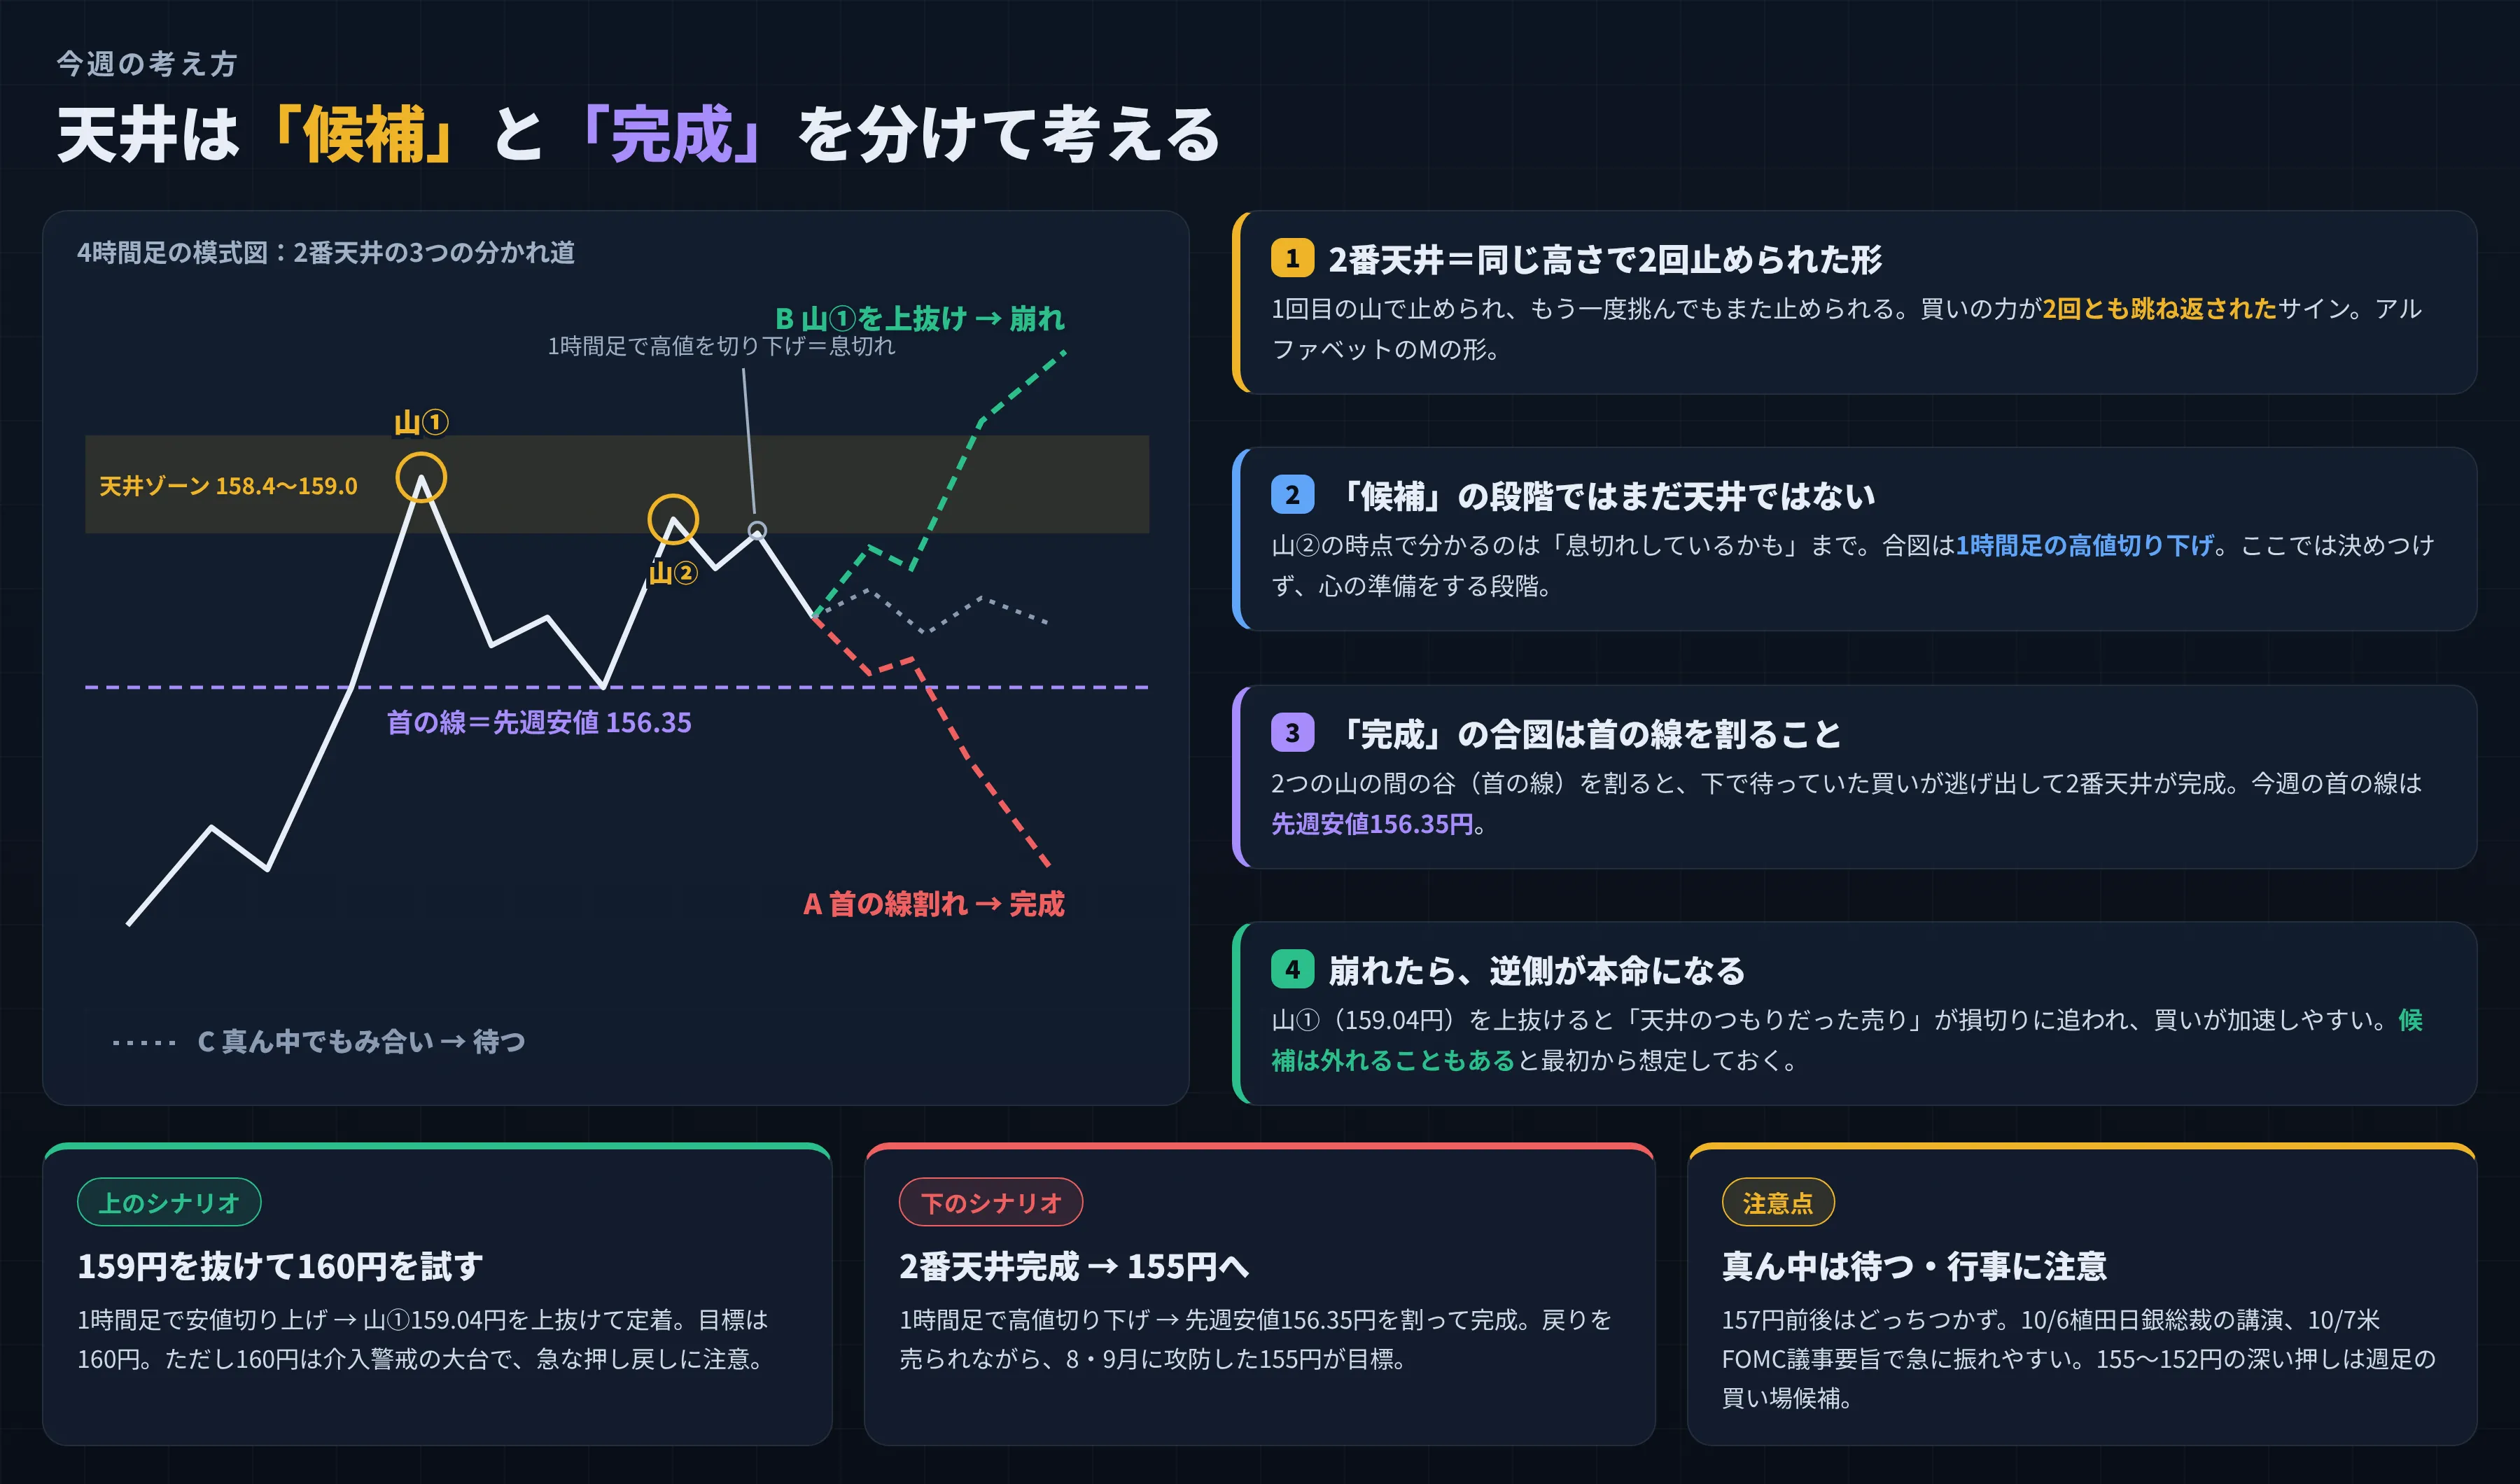
■This week's approach: treat the ceiling as having a “candidate” and a “completion”
────────────────────────────────────────
Peak 1 (159.04)
/\ Peak 2 (158.46)?
/ \ /\
/ \/ \ → B: Break above Peak 1 = a breakdown (upward)
───────────────────── Neck line = last week’s low 156.35
/ → A: Break of neck line = completion (downward)
→ C: Consolidation in the middle = wait
1. The second peak is a formation where it was stopped at the same height twice
It was stopped at the first peak, and again challenged but stopped again.
A signal that buying power was pushed back both times (an M-shape).
2. At the candidate stage, it is not yet a true ceiling
From Peak 2, it’s clear that the move is “perhaps running out of breath.”
The signal is a lower high on the hourly chart. Do not force a conclusion; prepare mentally.
3. The completion signal is breaking the neck line
Breaking the trough between the two peaks (the neck line) completes the second ceiling.
This week’s neck line is last week’s low of 156.35 yen.
4. If it collapses, the opposite side becomes the main scenario
If it breaks above Peak 1 (159.04 yen), selling that anticipated ceiling may be forced to cover,
and buying tends to accelerate. Be prepared from the outset for the possibility that the candidate may fail.
■This week’s scenario
────────────────────────────────────────
Upper scenario: Break above 159 yen and test 160 yen
Hourly chart: higher low forms → break above Peak 1 (159.04 yen) and establish → target 160 yen
However, 160 yen is a big target due to intervention risk. Be wary of a sharp pullback.
Lower scenario: Second peak completed → down to 155 yen
Hourly chart: lower high → break last week’s low of 156.35 yen and completion
→ While it retraces, the 155 yen level, which faced battles in August–September, is the target.
Note: wait in the middle; be mindful of events
Around 157 yen is indecisive.
10/5 Extraordinary Diet session, 10/6 Ueda Bank of Japan Governor speech, 10/7 US FOMC minutes.
If there is a deep dip to 155–152 yen, it becomes a weekly buying opportunity (bottom formation must be confirmed).
■Price level list (as of 10/2)
────────────────────────────────────────
160.00 Major level / intervention alert line
159.04 Peak 1 (9/24 high)
158.87 2025 high (January 2025)
158.46 Peak 2 (last week’s high)
158.4 200-day line (the cap above the daily chart)
157.05 25-day line (center of the range)
156.35 Neck line (last week’s low)
155.00 Support (August–September battle zone)
153.00 Bottoming level
152.00 Weekly dip low (last line of defense)
■ Caution
────────────────────────────────────────
Chart price levels reflect actual market values; price movements are illustrative.
Please make investment decisions at your own risk.