
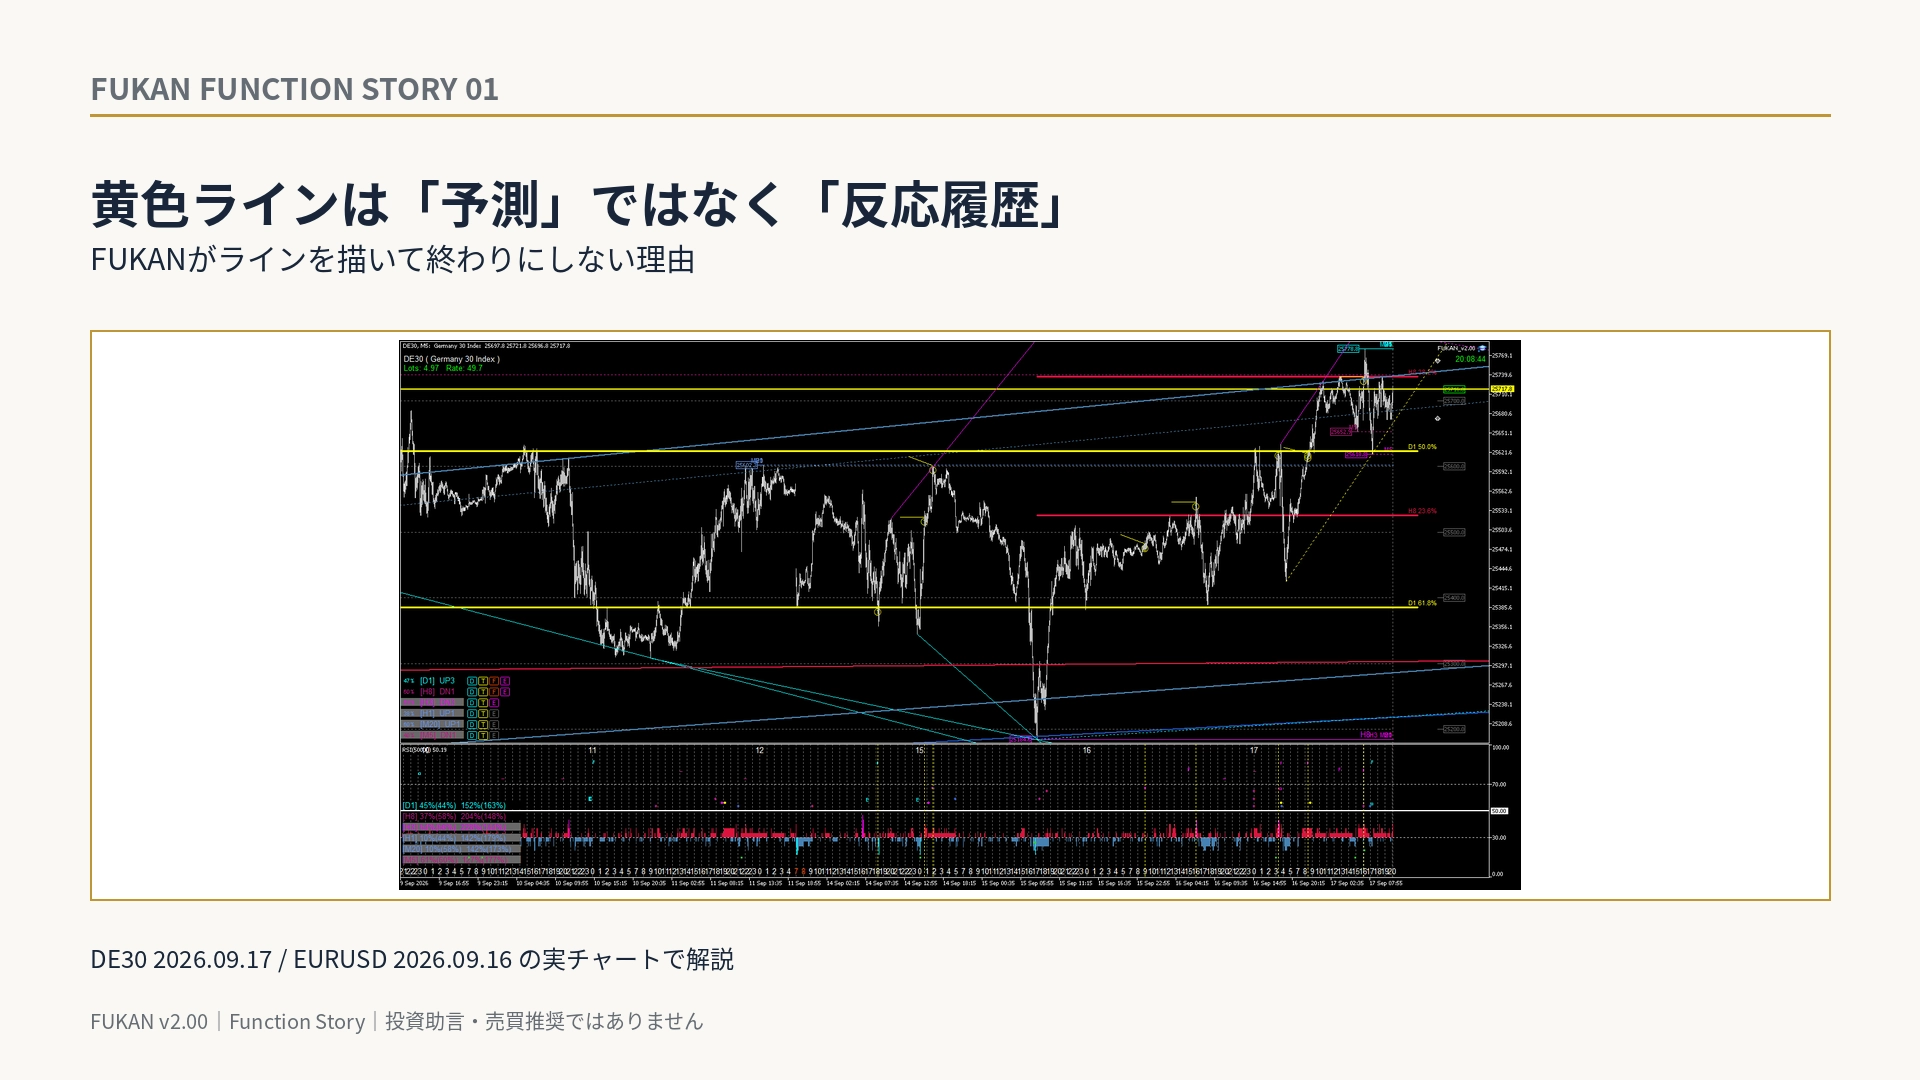
What does FUKAN's yellow line record — the reason to trace the "reaction history"
What does the yellow line in FUKAN record — Why we follow the “reaction history”
On weekends, market moves are often subdued, and daily Market Records may have limited explanatory value. This time, rather than an article chasing market results, it is a feature explanation to understand FUKAN’s display itself.
Theme: the “yellow line.” In FUKAN, reactions to the drawn technical lines are tracked, and lines that have confirmed rebounds are highlighted in Yellow / Goldenrod and recorded. However, yellow does not mean a forecast that “it will rebound next” or “this is where you should buy or sell.” It is a historical display that makes it possible to trace past reactions later within the same structure.
The actual charts used are DE30 (September 17, 2026) and EURUSD (September 16, 2026).
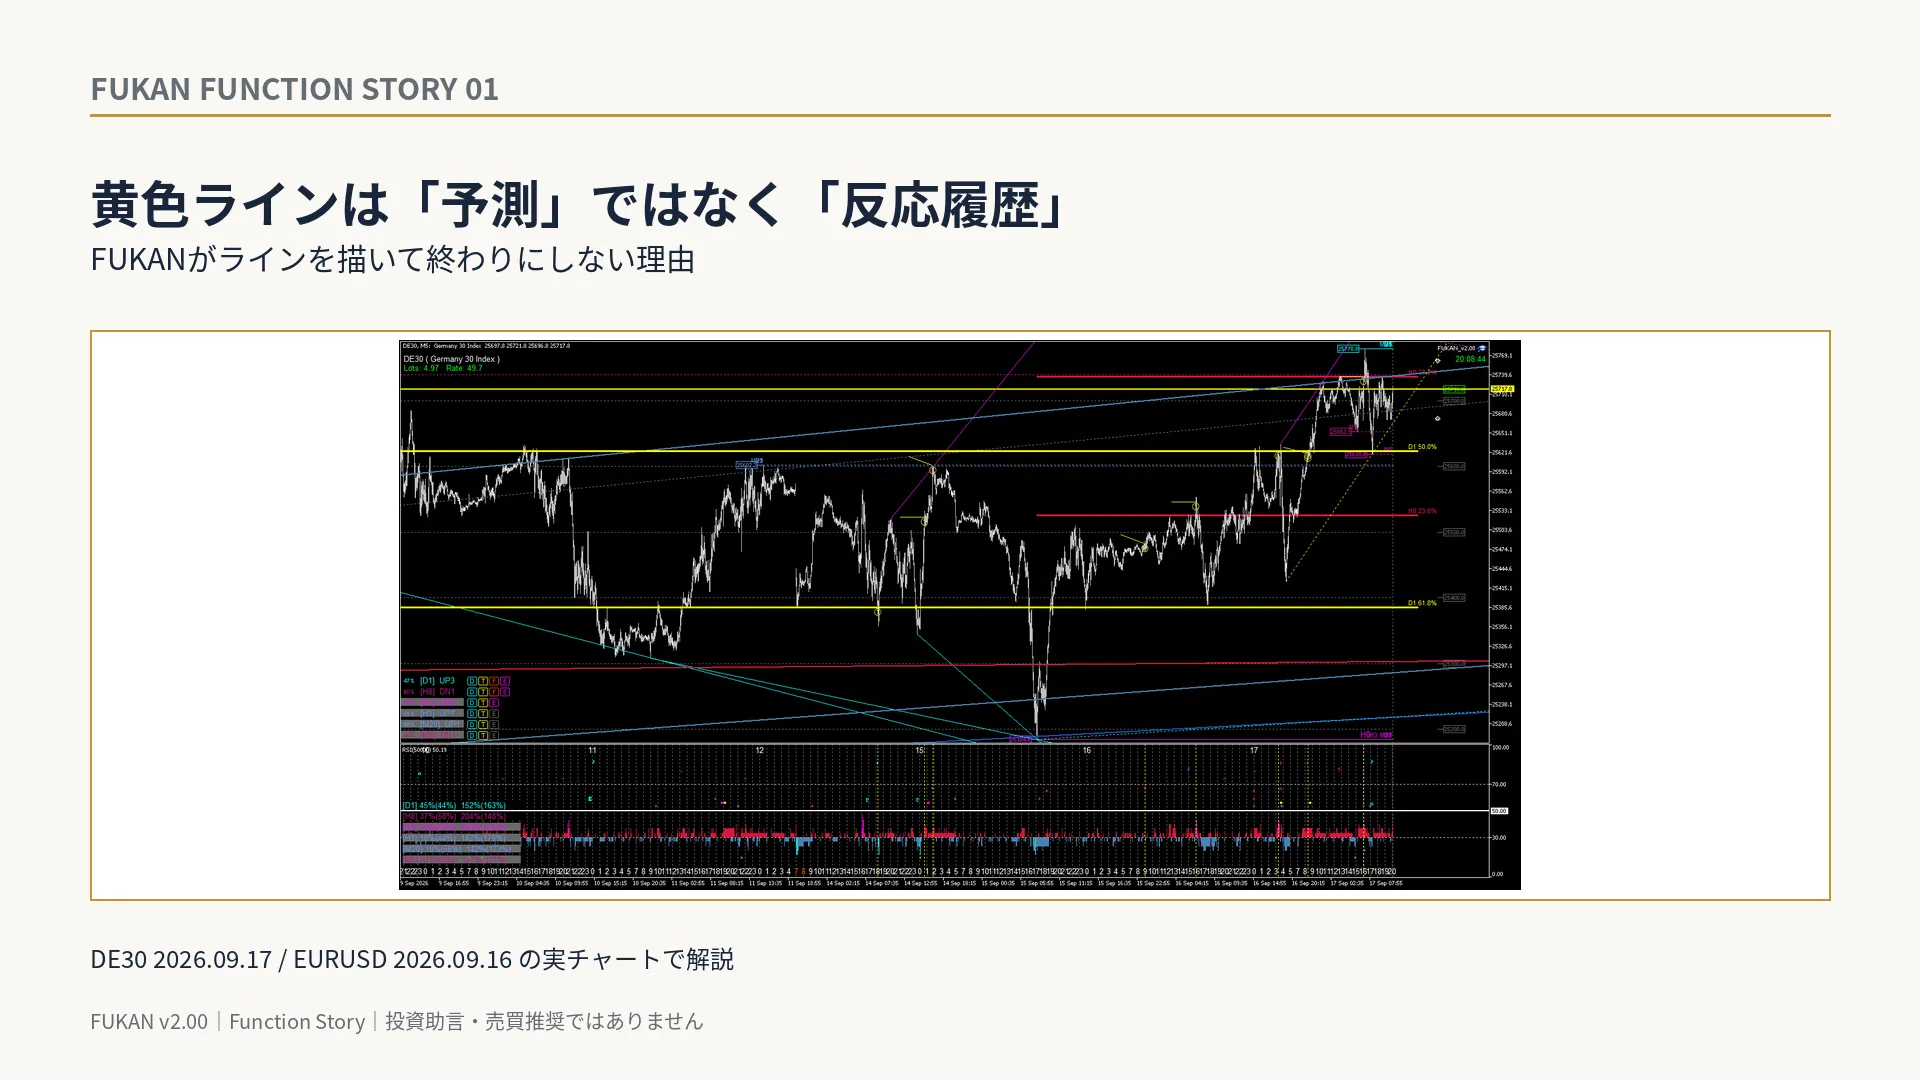
1|Don’t stop at drawing the line
On typical charts, after drawing a line, you have to remember for yourself whether the price touched the line, how it reacted, and whether it reconnected afterward.
In FUKAN, reactions to drawn lines are continuously tracked. Lines where rebounds were confirmed are highlighted in yellow and remain on the chart as “lines with a history of reactions.”
This is not a color to predict the future, but a display to organize past reactions.
2|DE30: at the moment a reaction is confirmed
On DE30 dated September 17, 2026, a reaction event is recorded near the upper technical line.
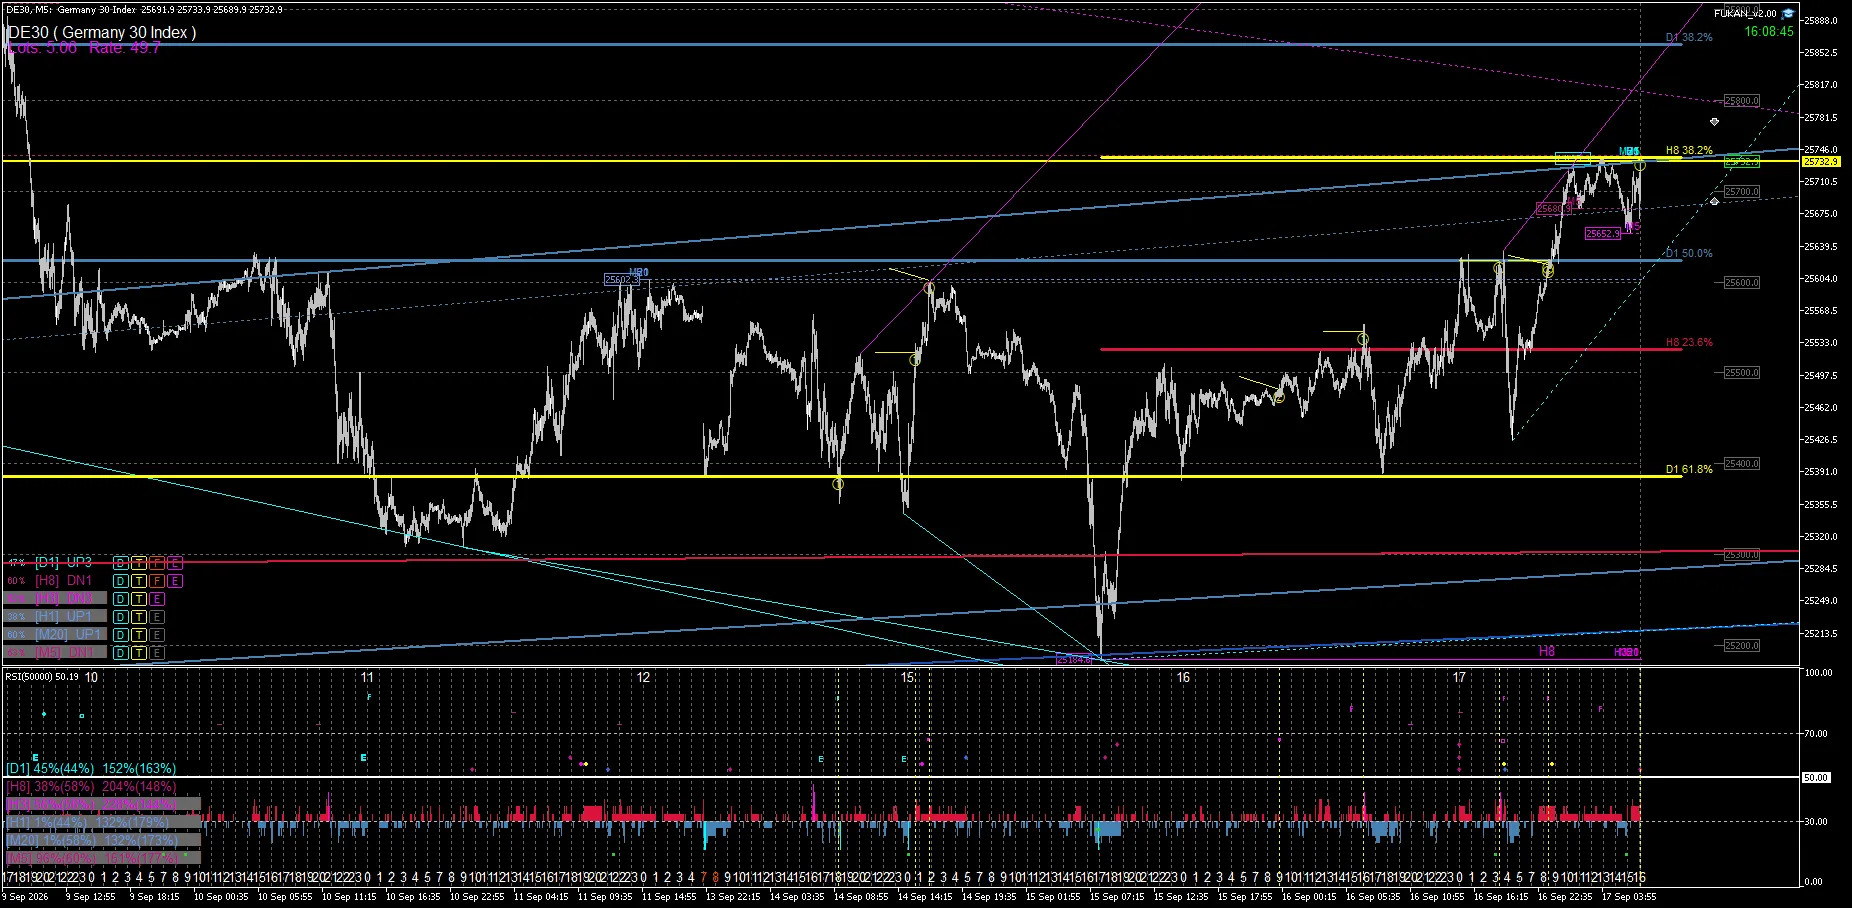
What is important at this point is not deciding “will it go up or down.” It is to retain the fact that a reaction occurred between the line and the price as a history.
3|1 hour later: continue to track the same line
A saved image about an hour after the event occurred.
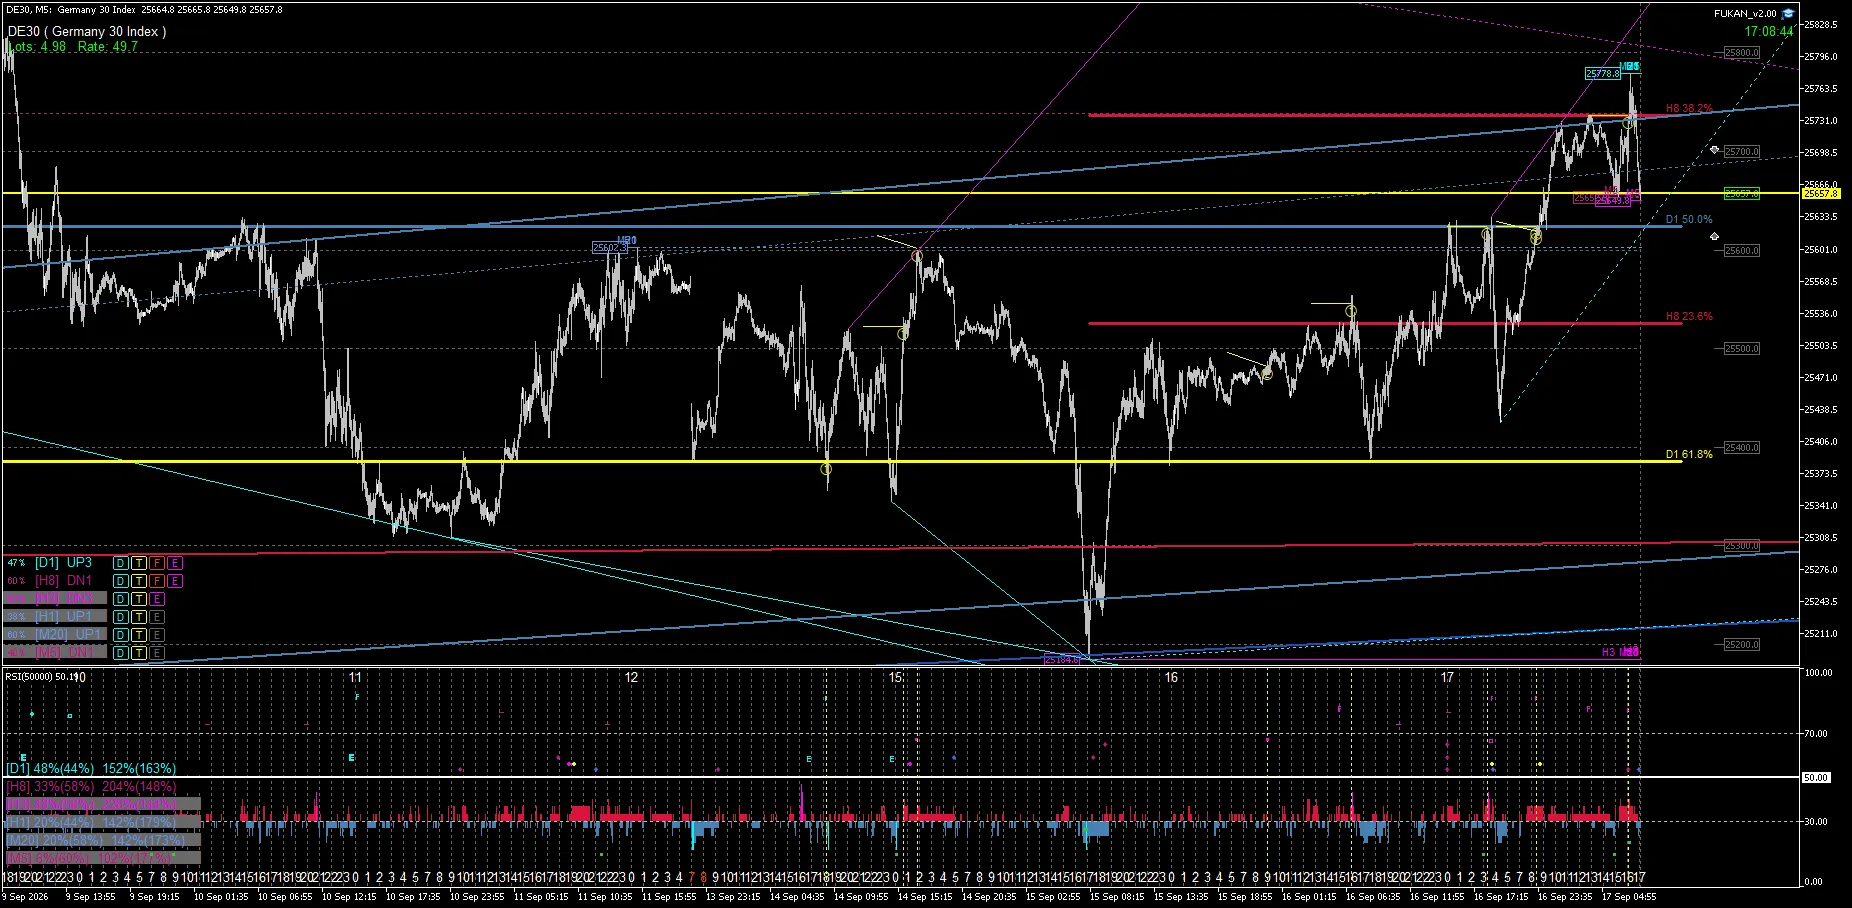
The price has moved to a different position from right after the event, but in FUKAN, monitoring does not stop with just the event. For the same line, it continues to check how the price drifts away, then approaches again, and moves to another reaction.
4|4 hours later: view reactions, recontacts, and breakouts as history
Another roughly four hours later.
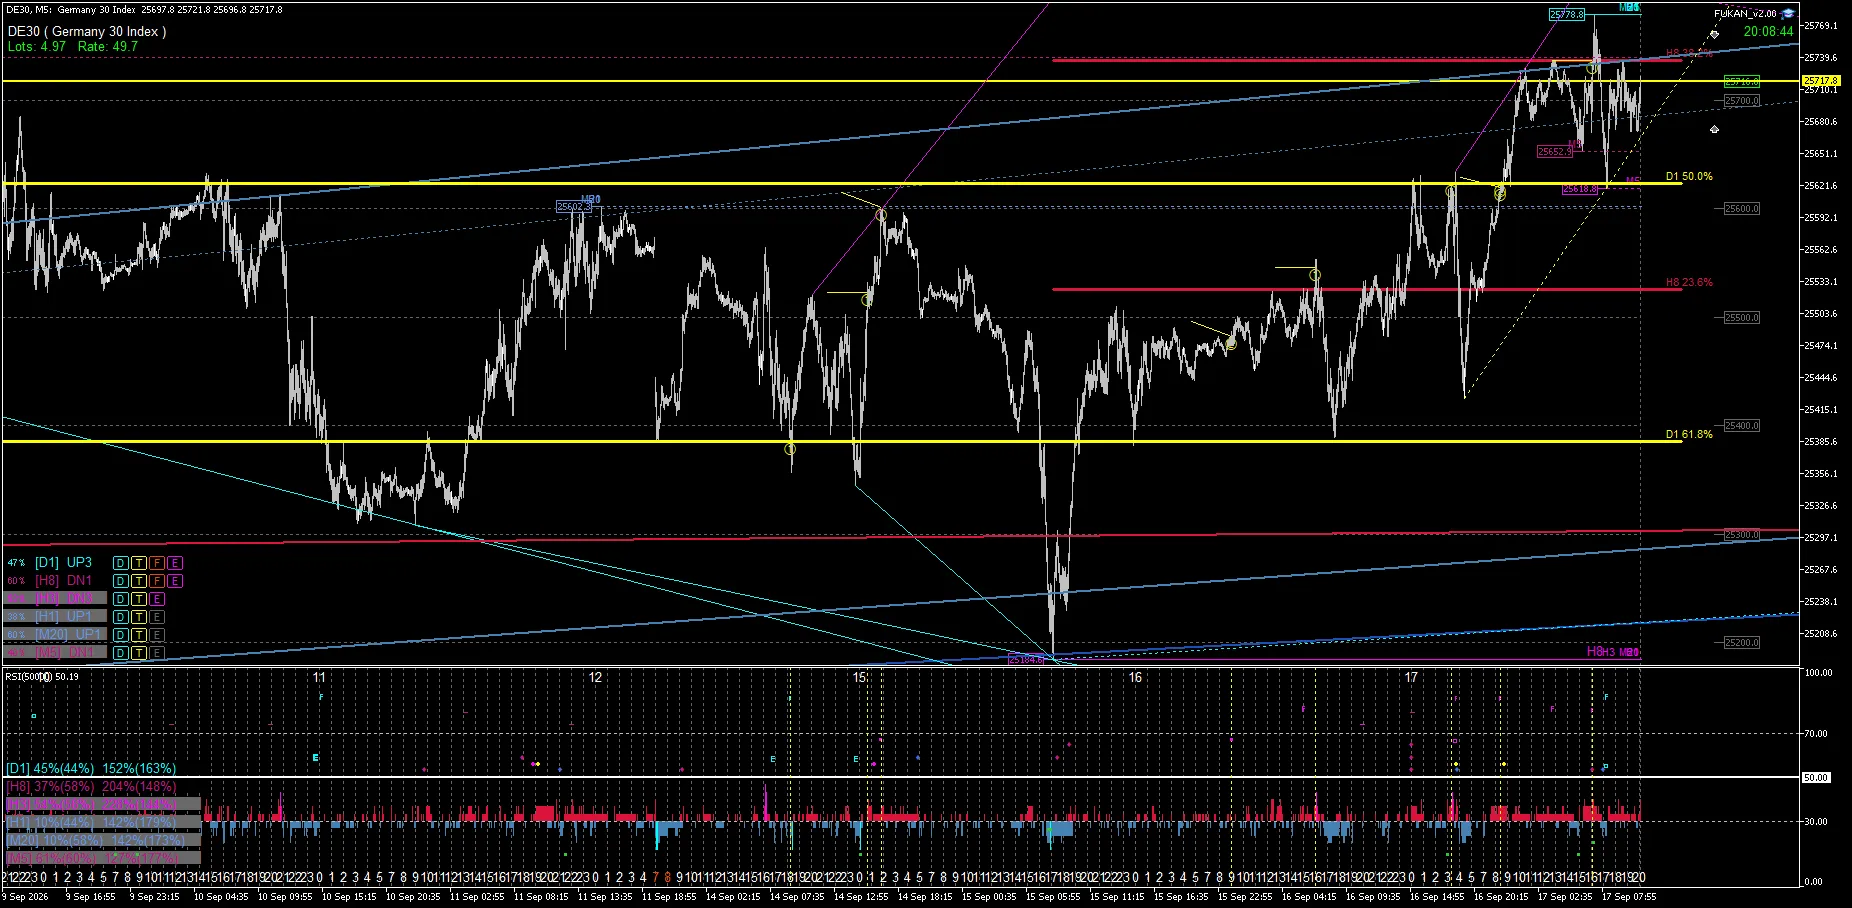
Rather than looking at a single contact point, by following subsequent recontacts and positional changes as part of the same flow, information changes from a static “a line that rebounded once” into a history of “how that line and price related to each other afterward.”
5|EURUSD: yellow line does not guarantee rebounds
As a contrasting example, consider EURUSD on September 16, 2026. First, the contact event.
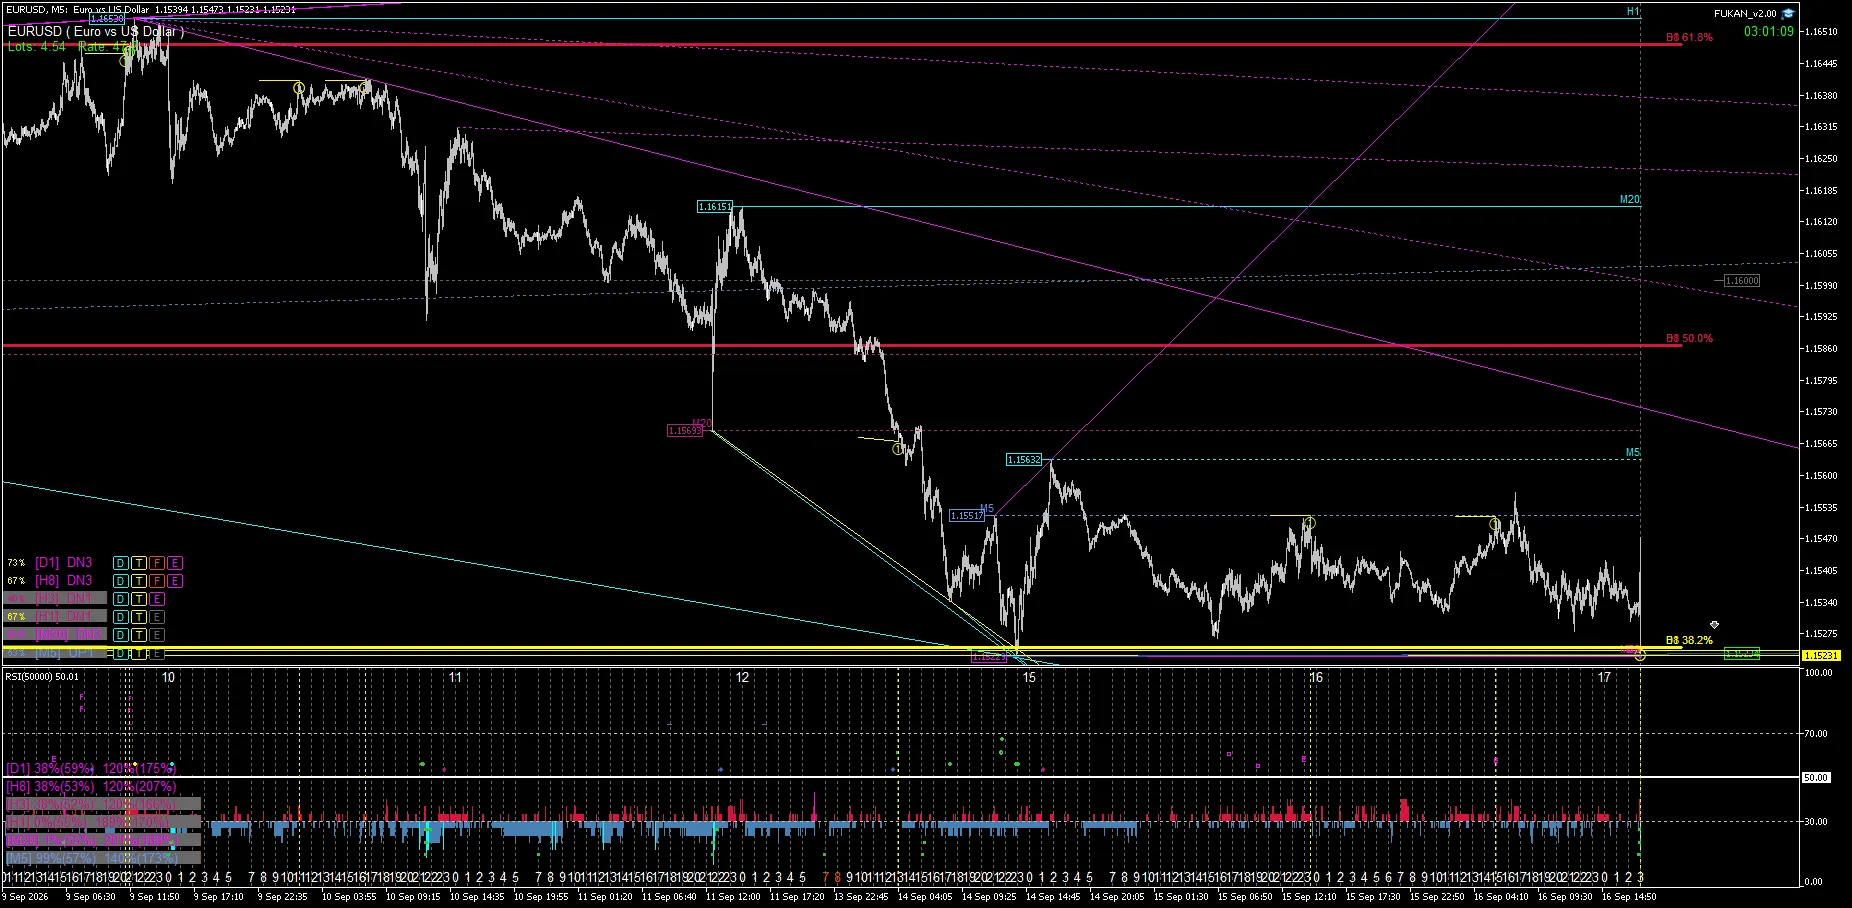
About four hours later, the price moves sharply downward and breaks through the relevant level.
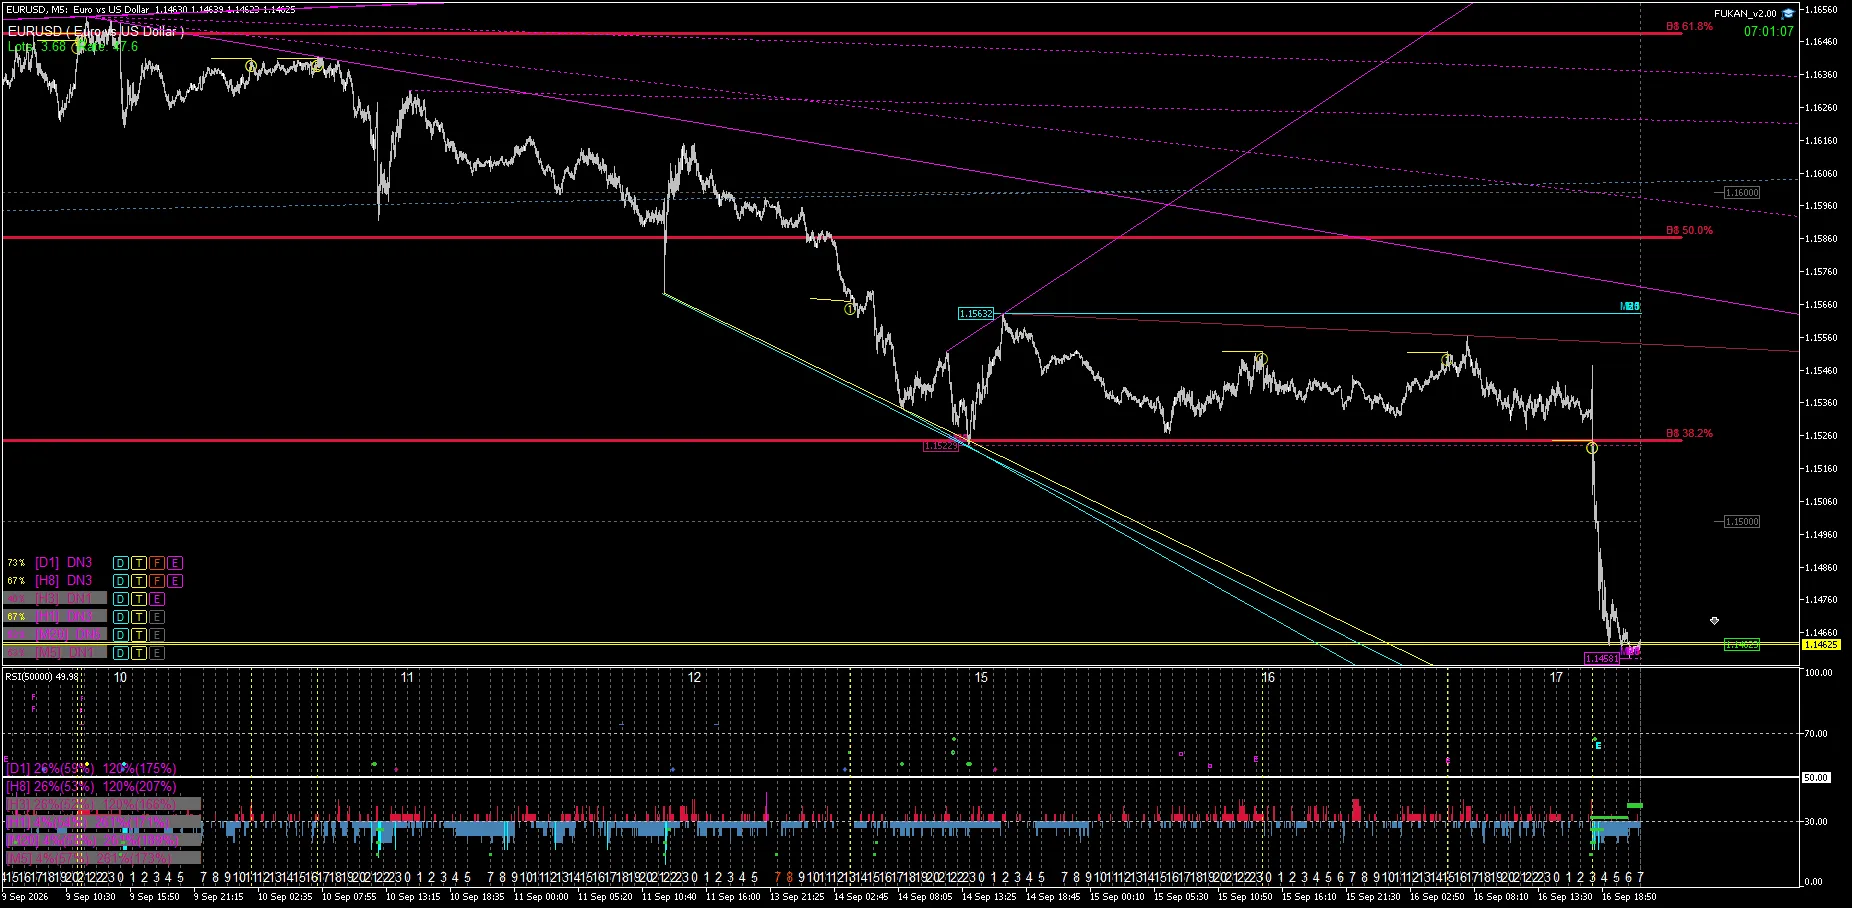
This is the key point. FUKAN’s yellow line is not to select lines that will rebound next. It is a record that keeps what happened, including rebounds, recontacts, breakthroughs, and non-reactions, using the same standard.
What it means to leave a “reaction history” with FUKAN
As multiple timeframes and many technical lines are observed simultaneously, it becomes difficult for people to track which lines reacted and what happened afterward using memory alone.
FUKAN treats lines not as mere drawings, but as objects whose relationship with price is updated over time.
The yellow line is one such display for that purpose, and it is not itself a buy/sell decision.
※Please insert after it goes public on GoGoJungle or YouTube.
7-day Trial: points that become clearer
When using the Trial, it’s easier to understand the intended function by watching what happens after the moment it turns yellow, over several hours to days.
1. Which technical line recorded the reaction history
2. Whether it recontacted the same line afterward
3. Whether it rebounded or broke through
4. Whether the yellow line and BUY / SELL direction signals are being interpreted with the same meaning
It’s important to look at not only successful cases but also cases where the price broke through.
Summary
The yellow line in FUKAN does not guarantee future rebounds.
It records the reactions to the drawn line and makes it easy to track subsequent recontacts, rebounds, and breakthroughs as history.
This is not about drawing a line and ending it, but about preserving how the relationship between that line and price changed over time. This is the main theme of Function Story 01.
FUKAN has a 7-day Trial. In a real MT5 environment, you can verify how yellow events are retained and how subsequent movements are tracked.
This article explains FUKAN’s analytical features and market-observation method and is not investment advice or a buy/sell recommendation. It does not guarantee future price movements, profits, or win rates.