
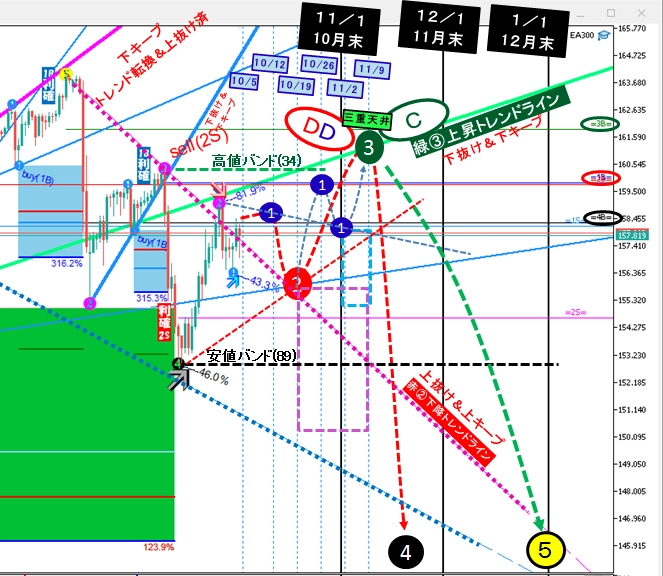
10/3 weekend USD/JPY analysis → After forming a rebound into the end of October, the main expectation for next month is a decline
Dollar-Yen Chart Analysis as of the Weekend of 10/3.
Last Week's ResultsandExpected Moves Going Forwardhave been summarized.
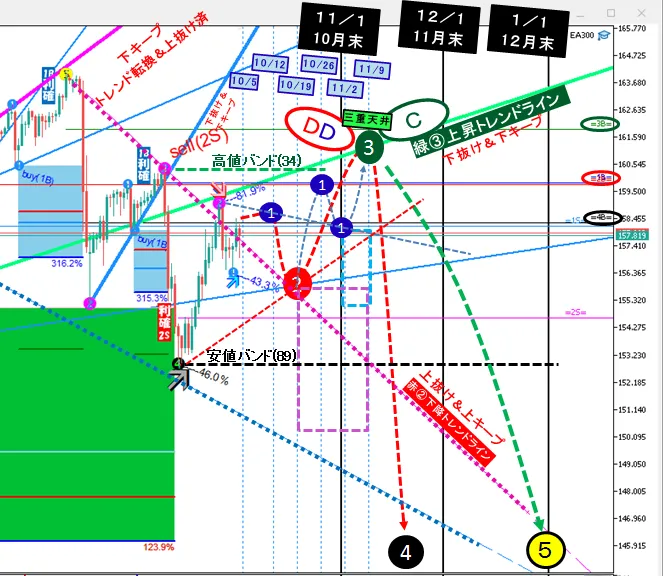
Expected Moves Going Forwardare,with the idea that after a monthly bullish candle closes below +1σ and 5SMA from the bottom at the end of October, the main focus next month (November) is on downside moves.A daily chart image with timestamp summarizing the main anticipated moves is provided below. One example is a case where the green③ high is formed by the end of October,and I plan to trade by watching how much the actual chart deviates from this image.
<Last Week (9/28–10/2) Results>
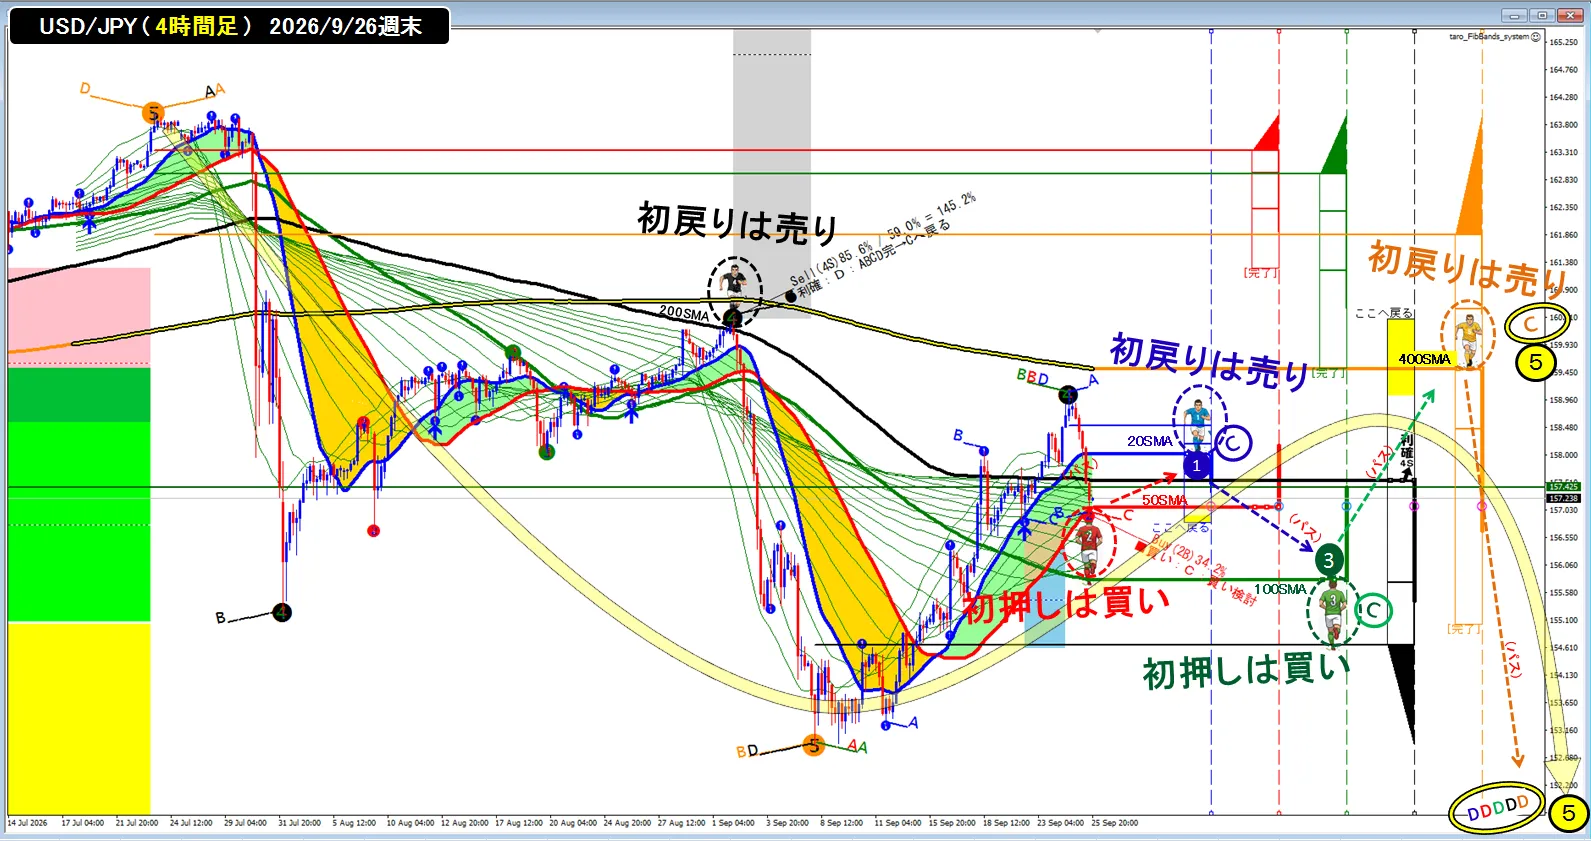
As of last weekas shown in the figure below, the price path was expected to be red②→blue①→green③→yellow⑤, and it largely followed that pattern.
<Progress: 9/30 22:00>
From the red② spill, blue① 20SMA picked it up, and the initial pullback was a sellable drop to green③ 100SMA via a downward CD; at this timing, green③’s low is a downward D point from blue① and an upward C point from green③.This shapeisa pattern that often occurs on pullbacks, and when blue① short sellers take profits, the price can return to blue① C point, enabling green③ to long from C point; in this way blue① and green③ can move smoothly higher..
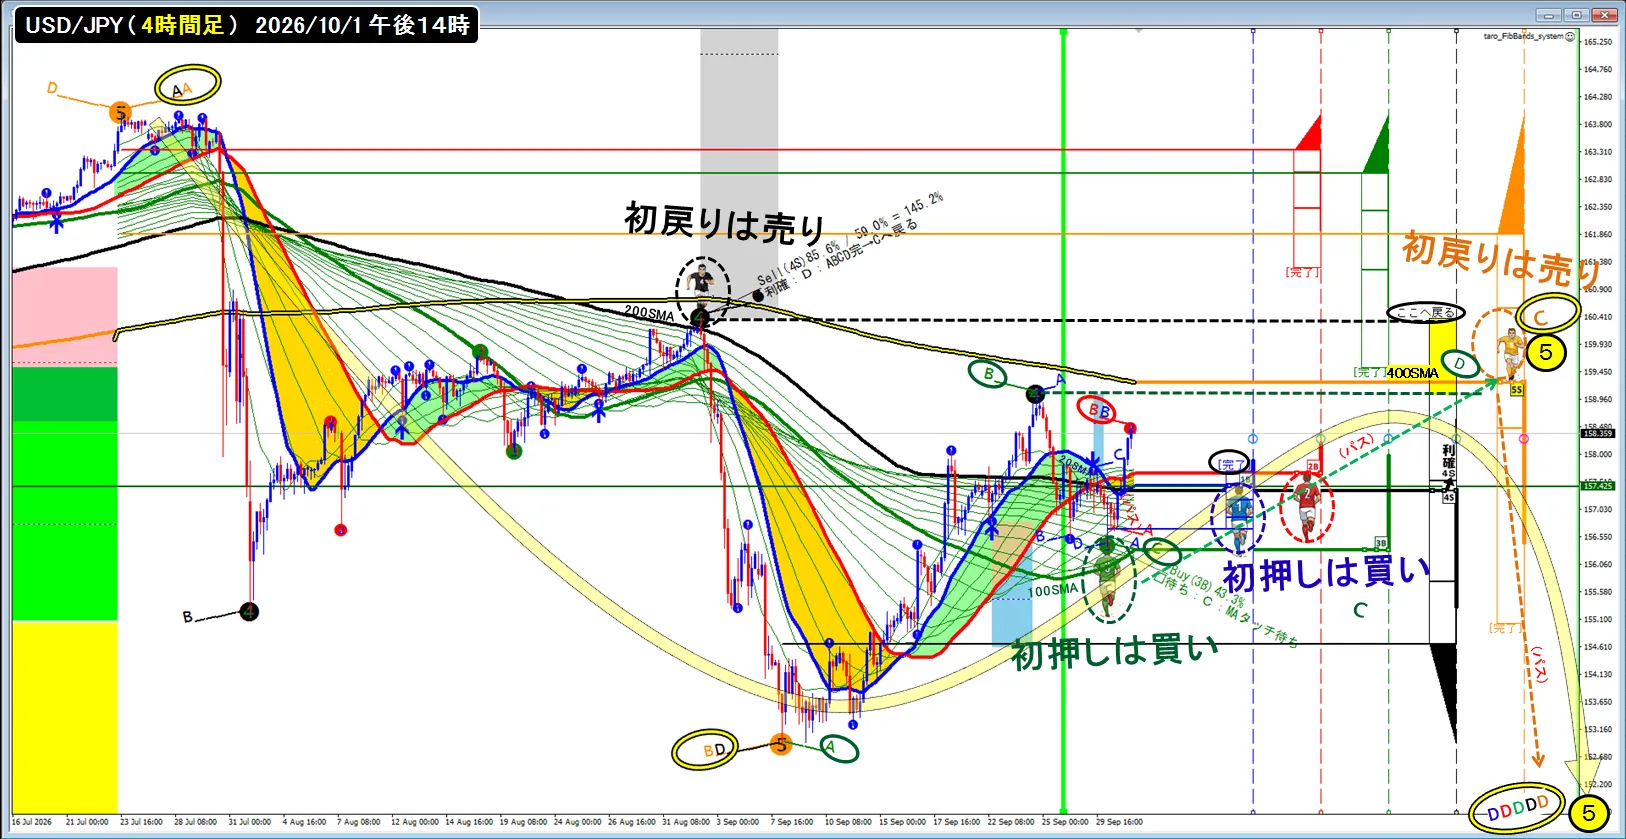
<Progress: 10/1 2:00 PM>
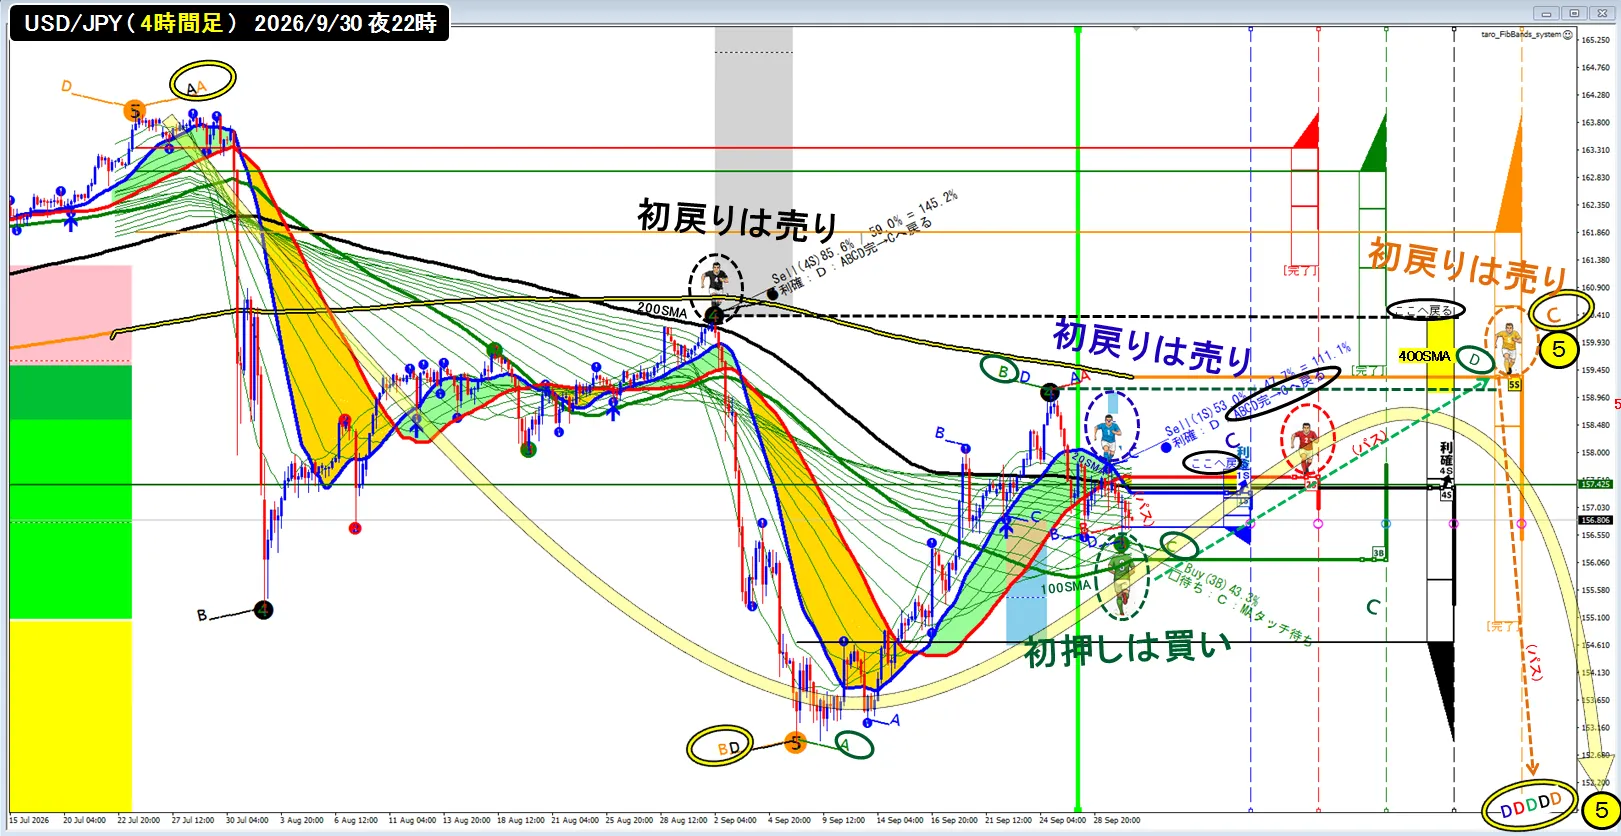
The pullback from blue①’s D→C profit-taking completed, blue① and red②’s B point formed, and blue① and red② are in a “initial push is a buy” standby state. For green③, it appears to have sent a path from rising C point to yellow⑤ falling C point, and afterwards blue① and red② may form rises ABCD and deliver the ball to yellow⑤..
(But that isif no one interferes,in reality, there are forces that hinder the upside, preventing a break above point B (defense), etc. ((^^) In a World Cup soccer match, Japan's strategy would be blocked by the opponent; in post-season games, the opponent blocks their own team’s strategy. I’d like to believe yellow⑤’s role as commander can be preserved by a setup that allows interferences from the opposing team to be anticipated (^^).
<Weekend of 10/3>
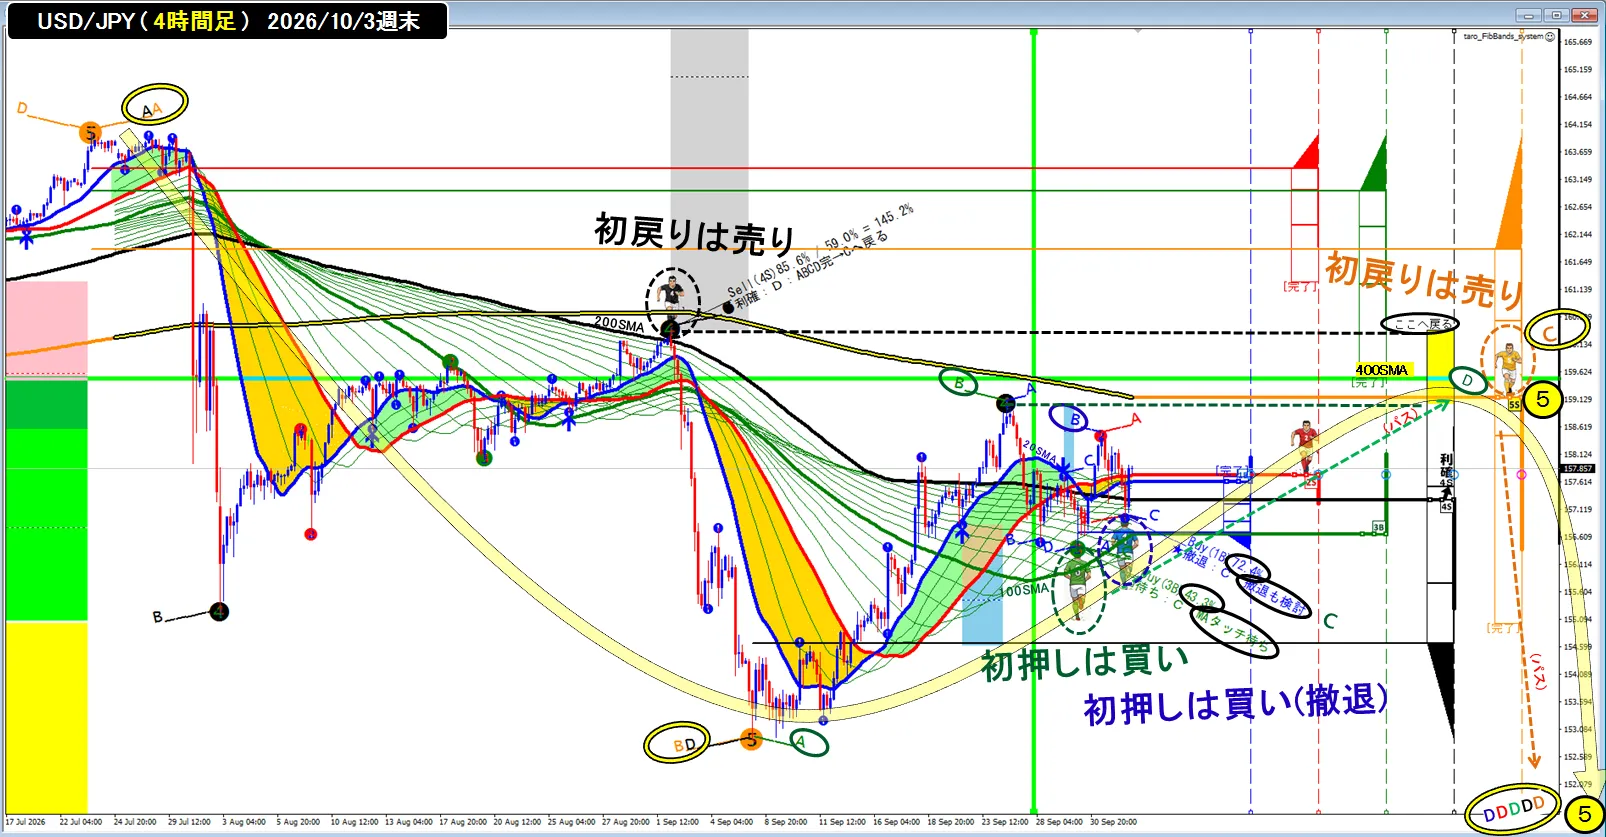
As of the weekendthis is the situation whereblue①’s C pointis the position after the blue 20SMA is broken below by the candle body, then price returns above the blue 20SMA by the weekend. The basic movement criterion is that in an upward ABCD, the candle’s close should not break below the C point and should cross above B and head to D, so the message shows “withdrawal under consideration.” This indicates that when entering long around the vicinity of the moving average near the C point, if the close breaks below, we would close with a breakeven to preserve profits and withdraw.‘Withdrawal under consideration’, etc.,and indicates the profit target would be closed at breakeven if the price returns to the moving average.We assume closing at breakeven when price returns to the moving average..
Alsothe downward AB of red② is a delicate shape, so it may be better to pause blue① and red② for now.
Blue①’s downward CD and the preceding upward CD (near the blue 20SMA where upward movement is C point) are seen to be pushed by the rising 20SMA or downward 20SMA, progressing to D point neatly; this time blue① is likely safest to take profit at breakeven and withdraw.
(This chart’s analysis differs from later trend-change analysis, which presents a scenario where green③, red②, and blue① rise in sequence to form yellow⑤ highs at the end of October; please refer to that as well.)
<ABCD Analysis at 20SMA (Monthly)>
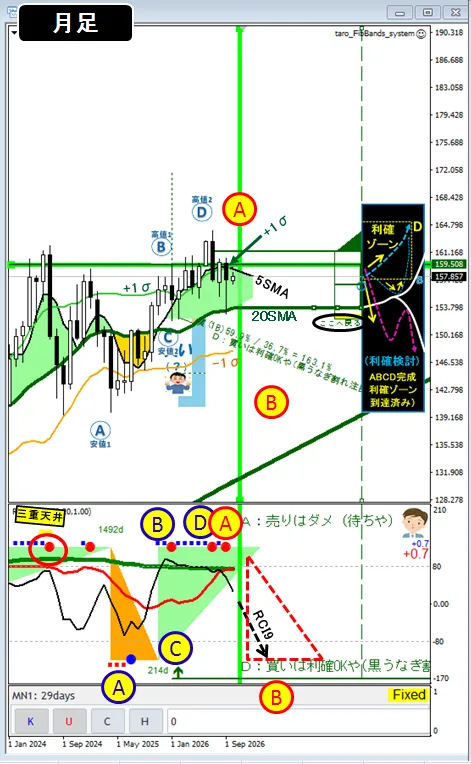
As shown in the chart below, the USD/JPY monthly candle finished at the end of October below +1σ and 5SMA.The end-of-August monthly close had already broken above +1σ and 5SMA,so if the price declines from here, the month will likely form a resistance-turned-support after the end of October candle body staying below 5SMA and +1σ, implying a subsequent decline next month..
RCI9 is pointing downwardand in this state,a bullish candle touching +1σ or 5SMA from below could cause the next month's monthly candle to be a long upper shadow and a downside close.
<ABCD Analysis at 20SMA (Weekly)>
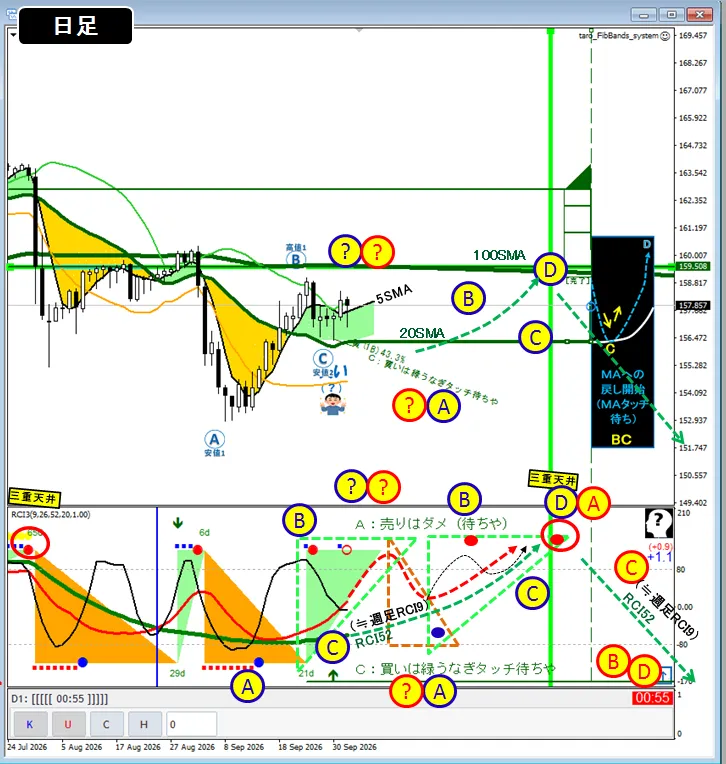
<ABCD Analysis at 20SMA (Daily)>
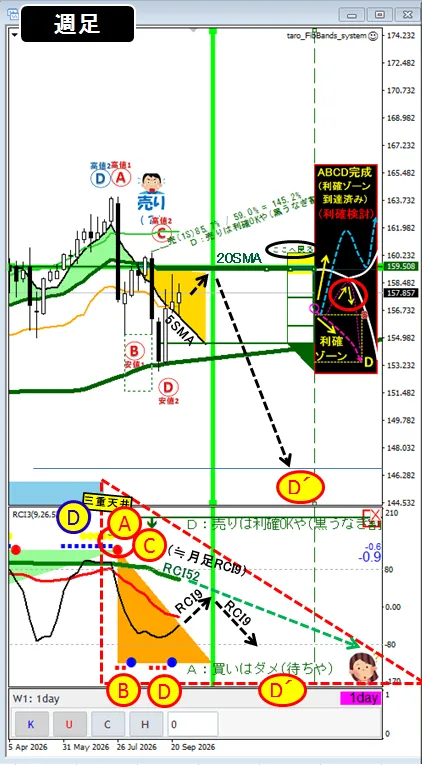
Dailyframesroughly correspond to the weekly black RCI9 andgreen RCI52.
Thereforegreen RCI52 rising up to October endis expected,and next month green RCI52 turning downward while declining is anticipated..
In the middle, how blue① and red② wave will ripple is nuanced, but I’ve drawn a sample of the waves in the RCI column, constructing green waves with red’s N shape and red waves with blue’s N shape.
<Trend Change Analysis of Large, Medium, Small Waves>
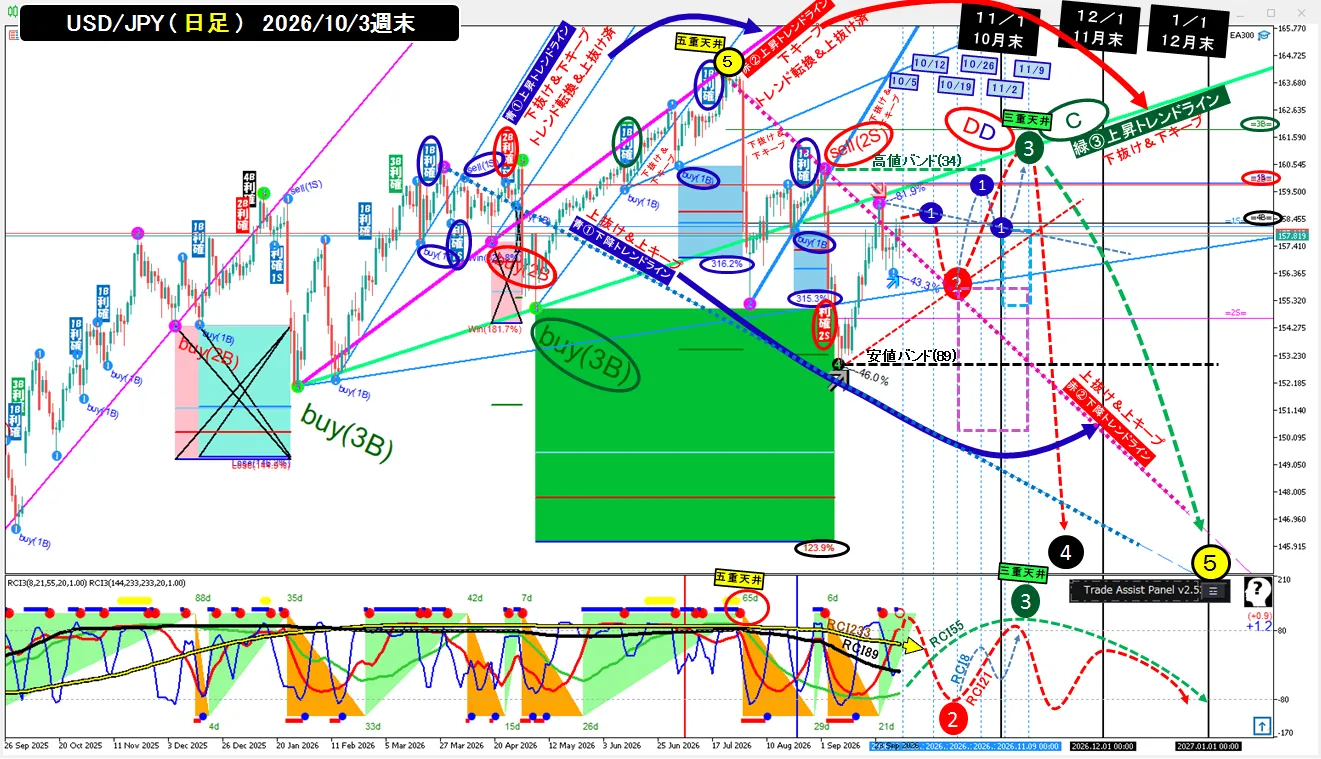
The chart below shows large/mid/small wave trend formation and reversal for blue①(5)/red②(13)/green③(34)/black④(89)/yellow⑤(233).Pay attention to the upward trendline,breaking below the upward trendline and holding in the lower zone, then forming a new upward trendline repeatedly,,currently staying below the green③ upward trendline, indicating the current phase is the green③ upward→downward trend change.Formation of a higher-low by the same magnitude below the upward trendline to create a rise-to-fall transition,blue① up→down trend change,red② up→down trend change has been completed,and currentlythegreen③ is in the process of rising→falling trend change, as shown.
(The high band (34) cannot be formed unless the candle high touches it,butthe current situation requires a breakout of the green③ upward trendline to touch the high band. Howeveras time passes, the green③ upward trendline below may touch the high band (34), but I think this will take up to around October.)
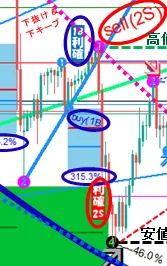
<Example: Small Upward Wave Forming → Large Wave Pullback to 300% Point>
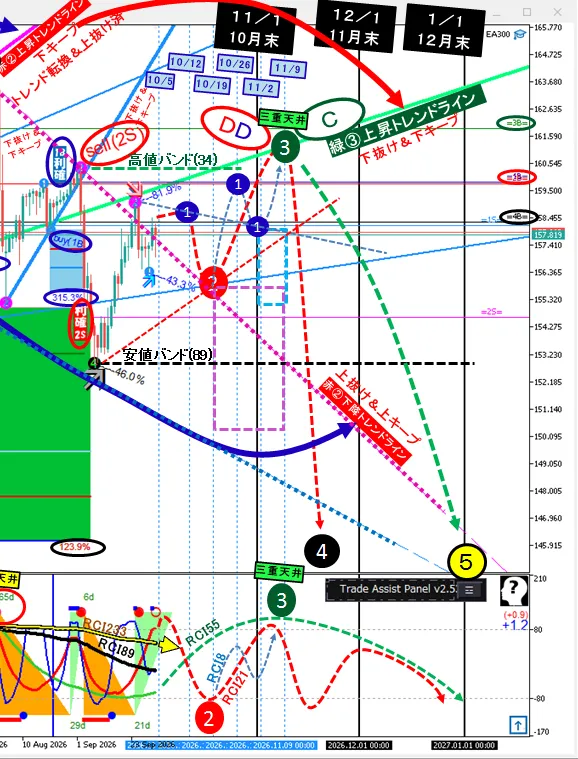
<Illustrating Next Week's Moves>
If movements unfold like this, early next month the point where green③ high was formed becomes blue① and red②’s D point (≈ profit-taking OK) and green③’s pullback (C point). Then depending on the leverage and margin, a quick sell-off to green③’s 300% target could occur as traders move to their own boxes’ heights, presenting a possibility of rapid decline.
<In Conclusion>
●I expect a substantial drop next month (November), butif October continues with rising trends in daily green③, red②, and blue① in sequence, andif that holds, trading could be easier and more profitable.
●Anxietyisabout the scenario where the weekend after a rise pushes the near-term red② high above blue① C point and touches the upper band (34); given recent moves, blue① may rise and then drop to 300% near the line, while green③ remains below the rising trend line and below the green trend line. I’m worried this could unfold without keeping green③ rising
(Ideally, I don’t want it to move until month-end, butif an upward trend is formed, I’ll watch 23.6% retracement vicinity for possible pullback support.)