
What is the expected value? 【Trader's common knowledge】
GOLD STREAM Weekly Verification Report (MAX PIPS SCAN MODE)
The Essence of the “Expectancy” Read from GOLD STREAM’s Win/Loss Panel and Chart Analysis — Trade Structure that Delivered +467 pips (R expectancy +0.52R)
In GOLD STREAM’s weekly verification, we do not simply chase superficial numbers like “how much was earned” or “win or loss.” To evaluate the true trading edge, we analyze using multidimensional statistics such asWin rate, Retrieved Pips, R Expectancy (Expectancy), Profit Factor (PF).
For the period under review (2026.09.28–2026.10.03), the verification result for MAX PIPS SCAN MODE (profit/loss calculated at max price range with fixed SL) is3 trades, 2 wins, 1 loss (win rate 66.7%), Pips earned +467.0 pips, PF 2.56, and R expectancy +0.52R, recording an exceptionally high performance.
“A higher win rate means you can keep winning” “Higher Pips means a superior system” —
In the FX trading world, it is common to think so, but the essence of long-term wealth growth is not there. The most important thing is“the expectancy structure: how much net profit on average is left per trade relative to the risk taken in one trade”.
1. Full scope of weekly verification data (2026.09.28–2026.10.03)
First, let us整理 the data for the win/loss panel targeted in this verification. It is the logic operation result of the “MAX PIPS SCAN MODE” on GOLD 15-minute chart.
| Mode / Setting | Trials | Win Rate | Pips Earned | Average Pips | PF | R Expectancy |
|---|---|---|---|---|---|---|
| Max Pips Scan (SL: 300.0p) |
3 times (2 wins 1 loss) |
66.7% | +467.0p | +155.7p | 2.56 | +0.52R |
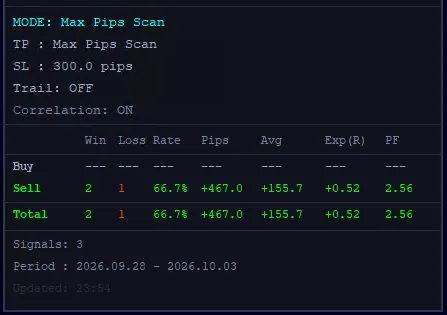
This week, buy signals were not taken; all entries were in the Sell direction. For 3 signals in total, wins were 2 and losses 1, with total gain+467.0pips.
Notably, the average gain per signal reached+155.7pips, and the R expectancy was+0.52R, recording an extremely high level. We will unpack what this means in detail from the expectancy concept.
2. What is R Expectancy? (Expectancy)
The “R” in “R Expectancy” is the common unit used to express the risk per trade (fixed stop loss) as“1R”.
In GOLD STREAM’s Max Pips Scan Mode, the SL (Stop Loss = loss width) is set to300.0 pips (= 1R) (based on H4 ATR). In other words, no matter how much the market moves against you, the loss from a single losing trade is strictly kept at “-1.0R (-300 pips).”
- +300.0 pips earned= +1.0R profit
- +467.0 pips earned= +1.557R profit (when extending profitability)
- -300.0 pips hit= -1.0R loss (when SL is strictly adhered to)
R Expectancy is calculated by combining win rate and risk-reward ratio (RR). The formula is as follows:
If the resulting value is positive, theoretically repeating that trade would steadily grow the account equity.
Why is “+0.20R” an important safety margin in real operation?
In real live account operation, unlike ideal backtesting environments, market frictions occur, such as“market frictions”.
- Delayed and volatile prices around economic news releases
If the expectancy is only around “+0.05R,” such market frictions can easily erase the edge, causing the account to go negative in real operation.
Therefore, in professional operation, it is extremely important to ensure a margin of expectancy of“+0.20R or more”. The GOLD STREAM weekly verification recorded“+0.52R”, which implies an overwhelming safety cushion that tolerates friction without issue.
3. Chart Verification (Rakuten MT4 CFD GOLD M15): The Behind-the-Scenes of Entries and No-Entries
Now, let us unravel the trade history marked on the GOLD (15-minute) chart in Rakuten MT4 CFD (2026.9.28–10.2) one by one. You will see how the result “+467.0 pips” was produced.
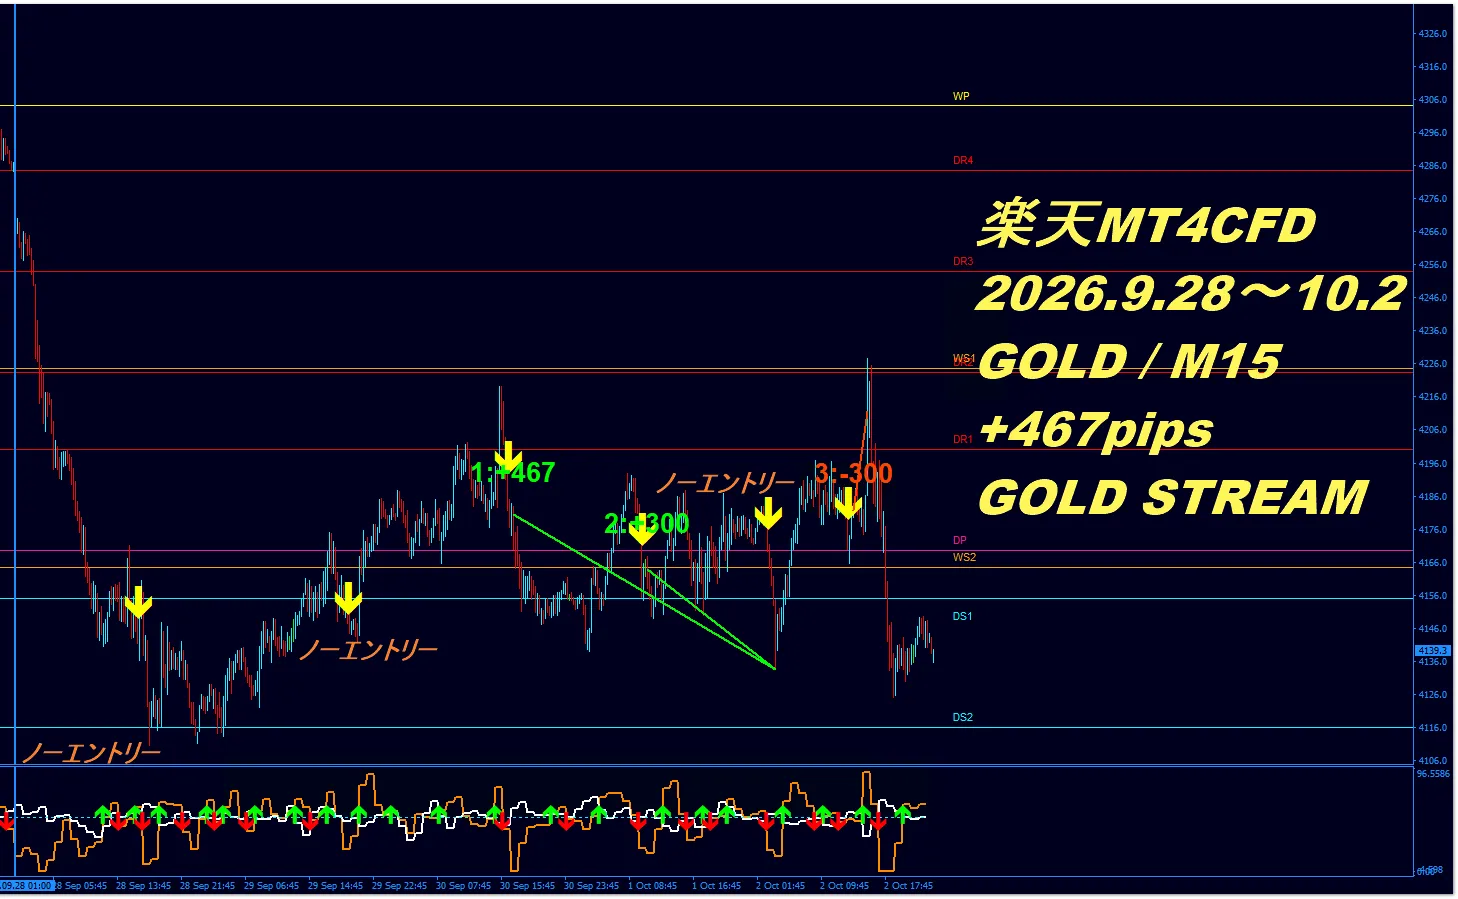
【Breakdown of all 3 weekly trades and P/L by trade】
① Trade 1: Sell entry → +467.0 pips gain (+1.557R)
By catching the perfect reversal from the high of the pullback and following the downtrend to the limit (Max Pips Scan), we achieved a big profit well beyond the SL of 300 pips, laying the foundation for this week's profit.
② Trade 2: Sell entry → +300.0 pips gain (+1.0R)
During the rebound after Trade 1, a new sell setup was detected. Stable and reliably collected the target of +300.0 pips (1R) profit.
③ Trade 3: Sell entry → -300.0 pips hit (−1.0R)
A rapid buyback and range break caused a reversal; the preset SL was hit, and we exited at “-300.0 pips (-1.0R)” per the rules.
The True Value of the No-Entry Filter That Eliminates Wasteful Losses
By inspecting the chart image, you can indeed see several points where entries were not taken, i.e., a visible “No Entry” situation.
Many ordinary traders who struggle with losses tend to blindly enter in unclear trend or oscillatory phases and in deceptive timeframes, piling up unnecessary losses and lowering expectancy.
GOLD STREAM’s logic incorporates an advanced filter that thoroughly eliminates low-edge situations as “No Entry.”This absence of waste signals enables a striking 3 trades (2 wins, 1 loss) to yield +467 pips with remarkable efficiency.
4. PF 2.56 and R Expectancy +0.52R prove the loss-minimizing, profit-maximizing structure
Another crucial metric when evaluating trading performance isPF (Profit Factor = Total Profit ÷ Total Loss).
In this verification PF was“2.56”. Generally PF of 1.5+ is considered excellent, but 2.56 means profits are more than 2.5 times the losses.
【Interaction between PF and R Expectancy】
- PF (Profit Factor): Indicates the overall revenue balance and system strength
- R Expectancy: Indicates the average earning power per trade (risk efficiency)
Even if there were a week with 100% win rate, a single loss could wipe out all profits in a “small wins, big losses” trading style, making long-term expectancy negative.
GOLD STREAM’s “Max Pips Scan Mode” builds a complete structure that keeps a single loss at -300 pips with strict SL, while expanding returns in winning moments (+467 pips, +300 pips). That is why even with only 3 trades, PF 2.56 and R expectancy +0.52R are robust results.
5. Trading Mindset that Embraces a Superior System
No matter how excellent the logic, there is no such thing as a 100% win rate in the market. In this verification too, a losing trade occurred (the third trade, -300 pips).
If you become emotional when you lose and refuse to cut losses, or chase losses by doubling down (averaging down or martingale), you will bankrupt the account regardless of the system used.
What winning traders need is“to continually repeat probability-positive actions without getting emotionally swayed by each win or loss”. Accept that 1R (300 pips) loss is the cost to gain the next winning trade, and strictly follow the signals and rules. This is the key to maximizing GOLD STREAM’s edge.
6. Summary — The Win/Loss Panel Looks at Expectancy Structure, Not Just Wins
Let’s summarize the key points seen in GOLD STREAM’s weekly verification data (2026.9.28–10.2).
- R expectancy +0.52R shows overwhelming advantage: It greatly surpasses practical operation standard of +0.20R and forms a structure resilient to market frictions.
- No-Entry function eliminates waste: The filter works to thoroughly eliminate wasted losses, maintaining a win rate of 66.7%.
- PF 2.56 — a loss-minimizing, profit-maximizing structure: Losses are held to -1.0R (-300 pips) while gains extend to +467 pips, presenting a clear risk-reward profile.
“Why was that victory achieved?”
“Were the losses contained within expectations?”
Rather than overreacting to superficial Pips gains, identifying the expectancy structure and chart-based justification behind them is the fastest route to consistently profitable trading.
GOLD STREAM OFFICIAL STORE
“Are you ready to leverage probability theory and edge to extract profits from the market?”
Let go of stress-filled, intuition-based trading now.
The verified feature is the official GOLD STREAM license— equip yourself with real R expectancy (+0.52R) in your trading environment.
※ Limited quantities; sales may end without notice when support slots are filled.
The verification results and figures published here are references based on historical market data and do not guarantee future profits or identical performance.
The pip counts and P/L data shown are based on the maximum price range reached after the entry signal, calculated with fixed stop loss (SL) settings as reference values. These reflect the maximum price movement if signals were held to the extreme, and do not represent actual executed profits or outcomes.
Actual profit and loss depend on entry/exit timing, spreads, slippage, trading fees, execution environment, position size, take-profit/stop-loss decisions, and market conditions. Also, the SL decision is based on the 4-hour chart, so results may vary under different operating conditions.
Furthermore, differences in trading conditions and price feeds across brokers, exchanges, and platforms may lead to discrepancies in actual prices, pips, profit/loss, and execution results. Therefore, published data may differ from actual trading performance.
This data serves as a reference for evaluating the edge of GOLD STREAM v2 signals and market analysis accuracy. Final investment or trading decisions should be made based on your own financial situation, risk tolerance, and trading environment, and are your own responsibility.