Utilizing the "Visualization Indicator" (Part 271)
“Visualization Indicator” utilization(Part271)
1. Further evolve the “28Currency Pair List Indicator” and develop the indicator
“8CPVisualization Indicator”toEURCHFdraw
The “8CPVisualization Indicator”hasOceaniaEdition, LondonEdition, NewYorkEdition, AnyCPeditions available.This time, the Londonedition was used.
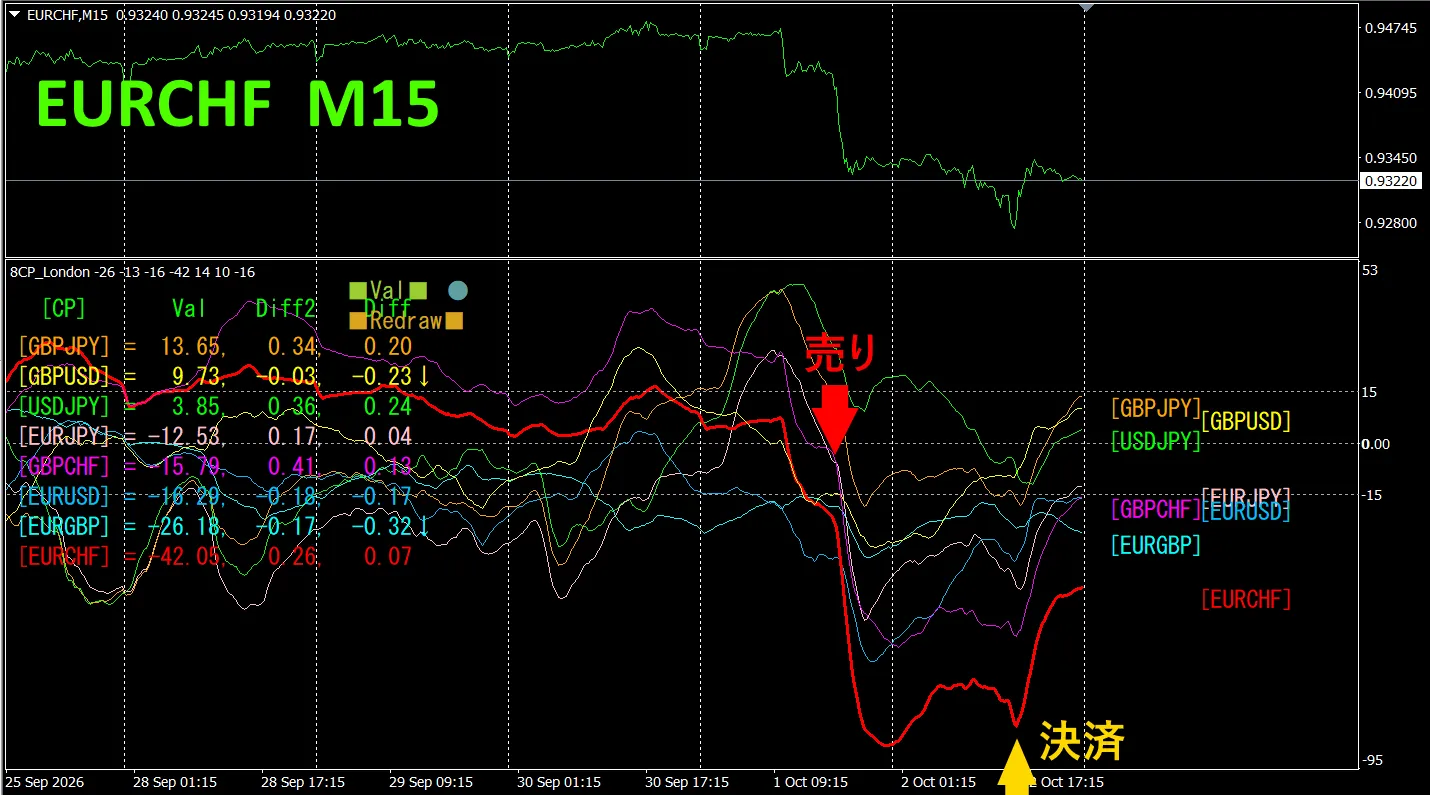
The upper half,EURCHF’s15-minute chart.The lower halfis by the “8CPVisualization Indicator”output,the thick redline graphEURCHFcorresponds to
On Thursday, the EURCHFgraph,dropped below the other group of graphs,so we opened a sell position.We closed at Friday’s bottomabout110pipsprofit was obtained.
Currency strength chart
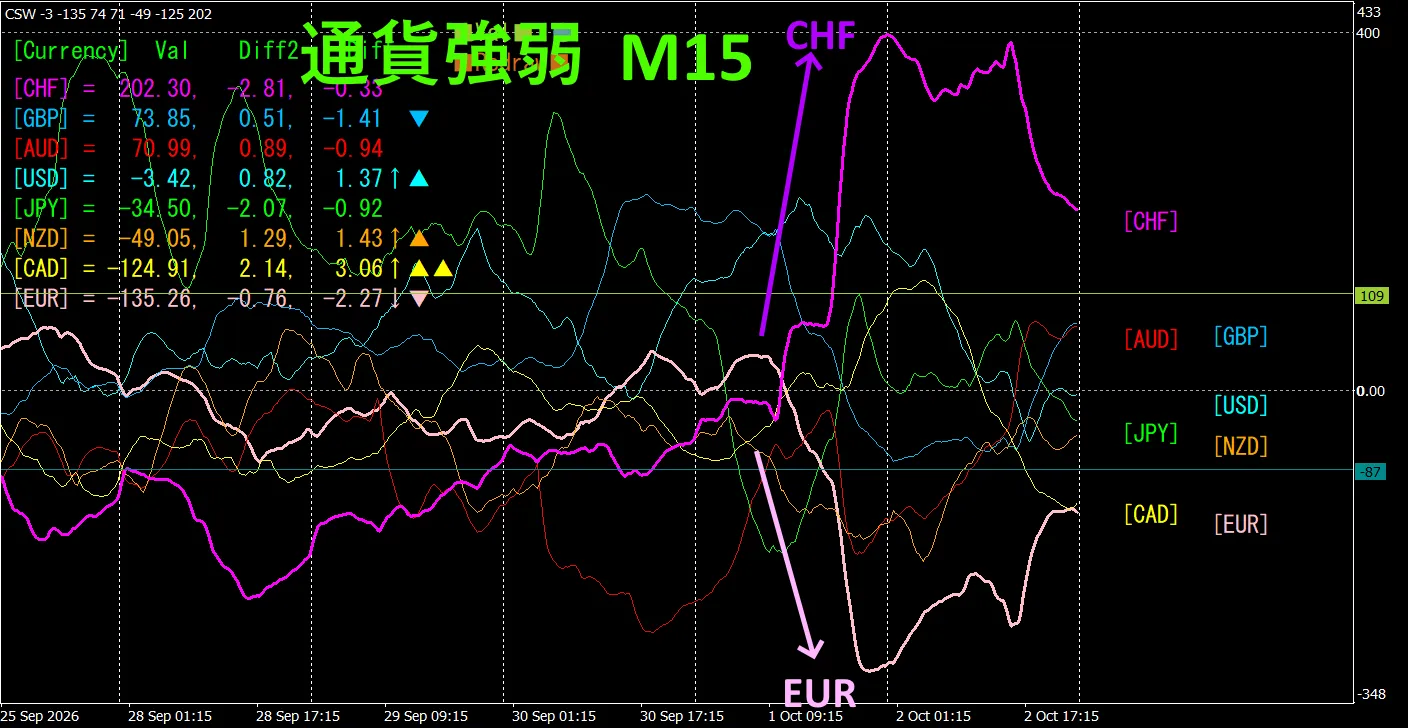
Looking at the 15-minute currency strength graph,CHFandEURare,in an inverse correlation relationship.CHFandEURtrade only where they diverge and spreaddo. EUR < CHFso,during divergenceEURCHFshould be traded as a sellto trade.Inverse correlationrelationshipexists,so aim only for those points when trading.
In FX,if you choose the currency pairthat is currently extending the most,and has an inverse correlation,the results will naturally follow.
“Aim for inverse correlation in currency strength!”isan FXiron rule.
If you use “TrendLine-EX”,you can automate entries and exitson diagonal trendline breaks.You can leave it as is,makingfor easytrading. “TrendLine-EX”isasemi-automatic EA that can auto-sell on a trendline break below,and auto-close on a trendline break aboveEA.
2. Best SelectTry using the indicator
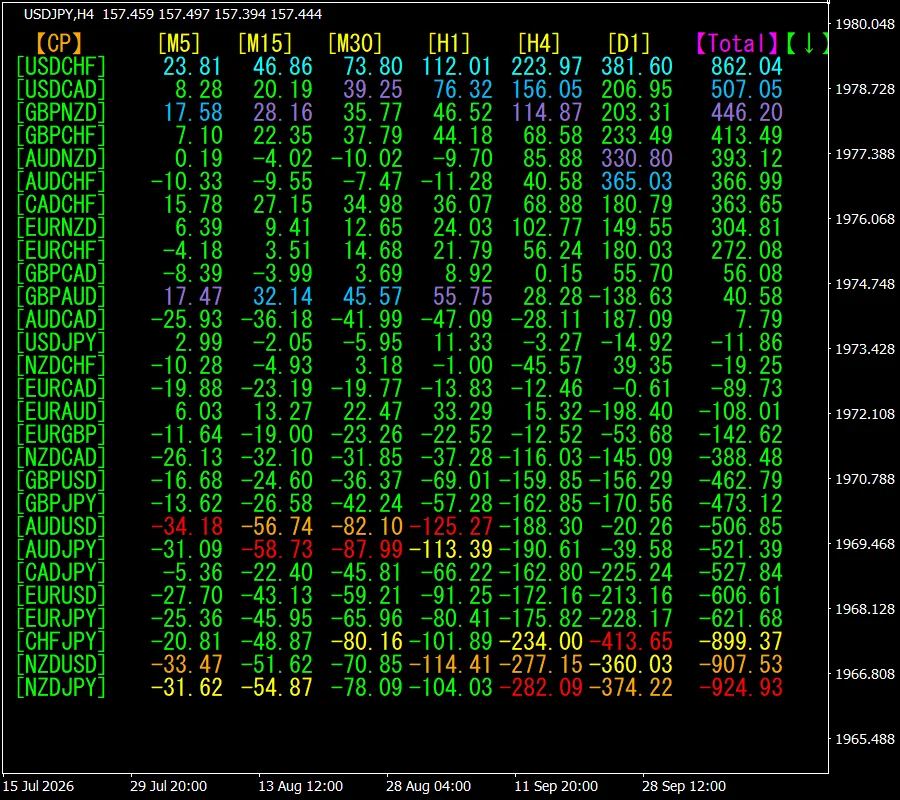
Thefigure below, 2026year9month30day02:29(JST) is a screenshot.
[Total]sorted the valuesin descending orderare displayed.At the topUSDCHFis,for all timeframesblue tonesare shown. Totalvalueis862.04and,a positivenumber.USDCHFis,an upwardtrend appears to be occurring.
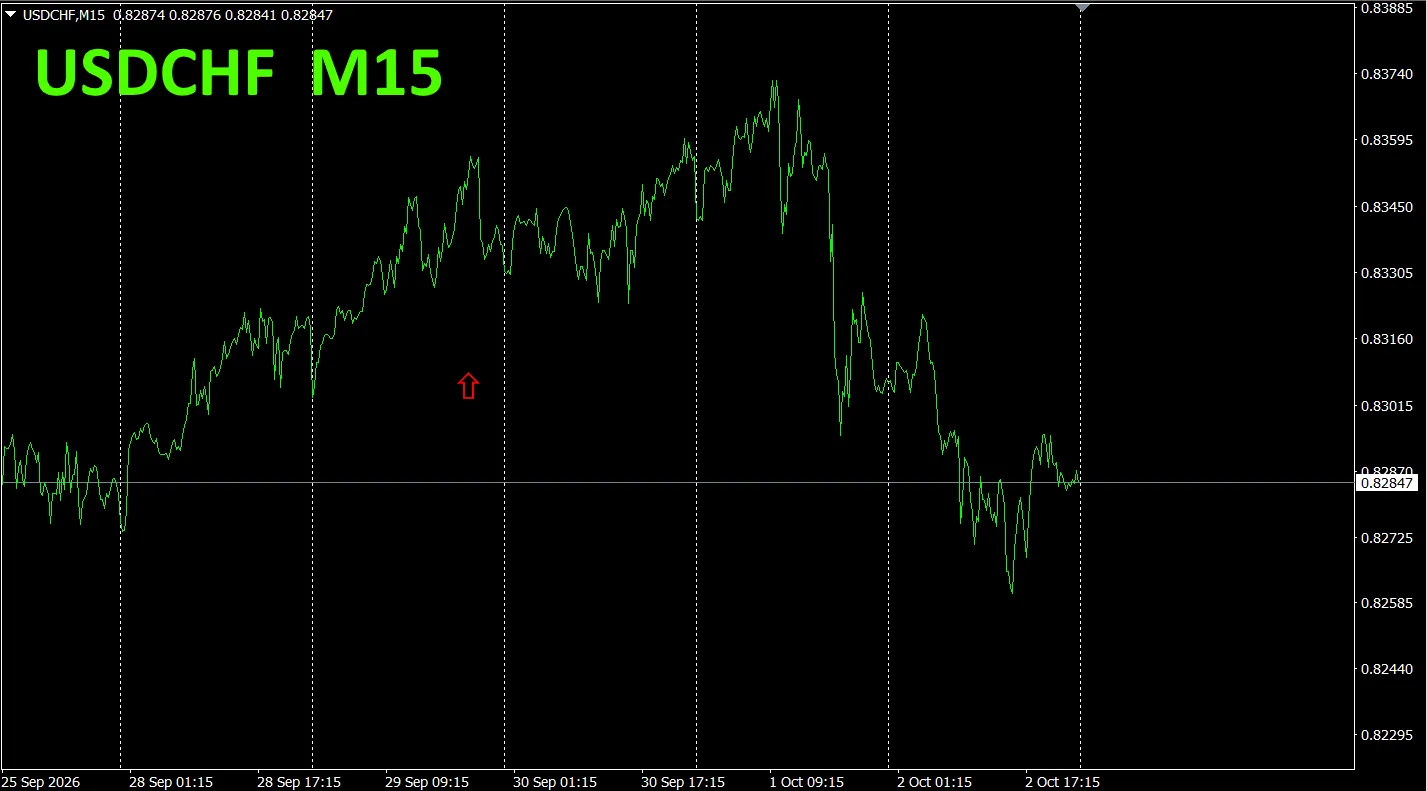
Now,USDCHF’schart, let’s take a look.
The red arrow is where the screenshot was taken.In the middle of an uptrend,it captured a point extending upwardwell. “28Currency PairsBest SelectIndicator”can,among the 28currency pairs, identify which currency has the strongest trend,with easebut,what happens afterward and how it unfolds,is not guaranteed.The trend’s“maximum instantaneous wind speed”is captured,but if it happens to be the very bottom,whether the trend ends afterward or not,needs to be confirmed on the chart—this serves as a good example.
“28Currency PairsBest SelectIndicator”can,among the 28currency pairs,easily find which currency has the strongest trend.Also,“28Currency PairsDeviation ComparisonIndicator”will,among the 28currency pairs,tell you thepair with the greatest deviation.From all currency pairs,you can,—an excellent indicator.
“28Currency PairsBest SelectIndicator”

https://www.gogojungle.co.jp/tools/indicators/35128
3.2021yearMayonward trackingEURJPYmovement—what happened?
2021yearMaysincewe have been following EURJPY’s movement.
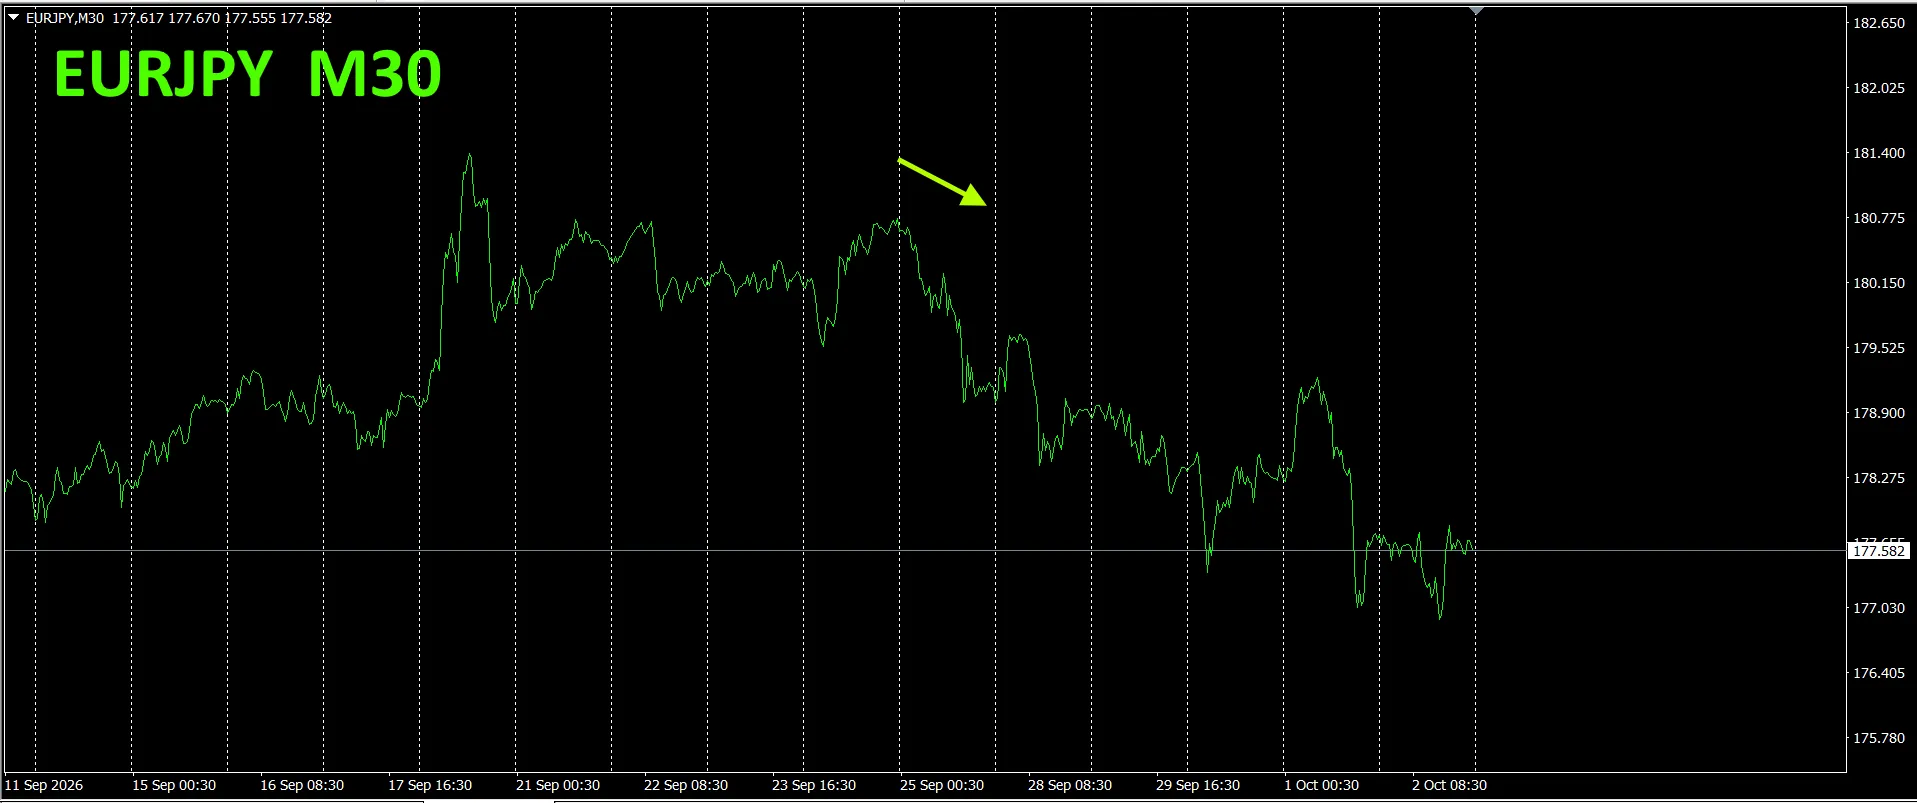
To see the overall flow, 30-minute chart showing the last about3weeks.
Last time,we wrote as follows.
Pinkis EUR,greenis JPY.EURvector,is pointing downward, JPYis,slightly upward from horizontal.From the currency strength chart, EURJPYis,expected to head further downward.
As predicted from the currency strength chart, EURJPYhas,fallen.About200pipsof decline.
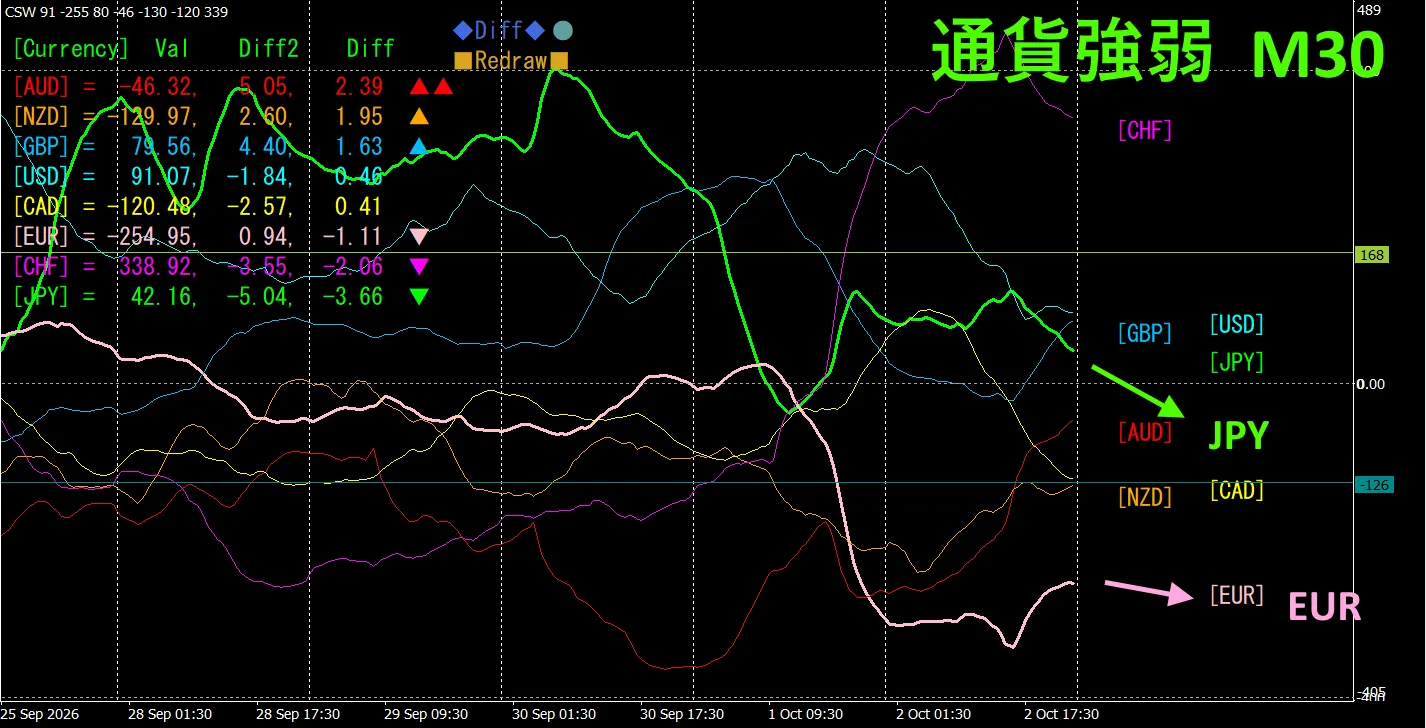
This is the 30-minute currency strength chart.
Pinkis EUR,greenis JPY.EURandJPYboth,have vectors pointing downward, JPY’sissteeper than EUR’s.From the currency strength chart, EURJPYis,expected to rise slightly going forward.
4. Tried using the new indicator Dual_MACD_Trend_Indicator.
Please see the new indicator “Dual_MACD_Trend_Indicator” below.
MT4Edition:https://www.gogojungle.co.jp/tools/indicators/62199
MT5Edition:https://www.gogojungle.co.jp/tools/indicators/62202
This indicator clearly shows trend direction with colors.If the color bar isLimeit’s buy, Redit’s sell,making it easy to understand and use even for beginners.If the bar is green, it’s an uptrend,if red, a downtrend,and if there’s no color, there’s no trend.Since it’s color-displayed,you can grasp the trend status at a glance.
The red sell zone and,the green buy zone,are neatly separated,making trading easy at a glance.In the figure above,buy in the areas enclosed by white ellipses in the green regions,and sell in the areas enclosed by white ellipses in the red regions.The slope of the indicator’s long-termMACDis also useful.If the long-termMACDis sloping down to the right, it’s sell,if sloping up to the right, it’s buy.
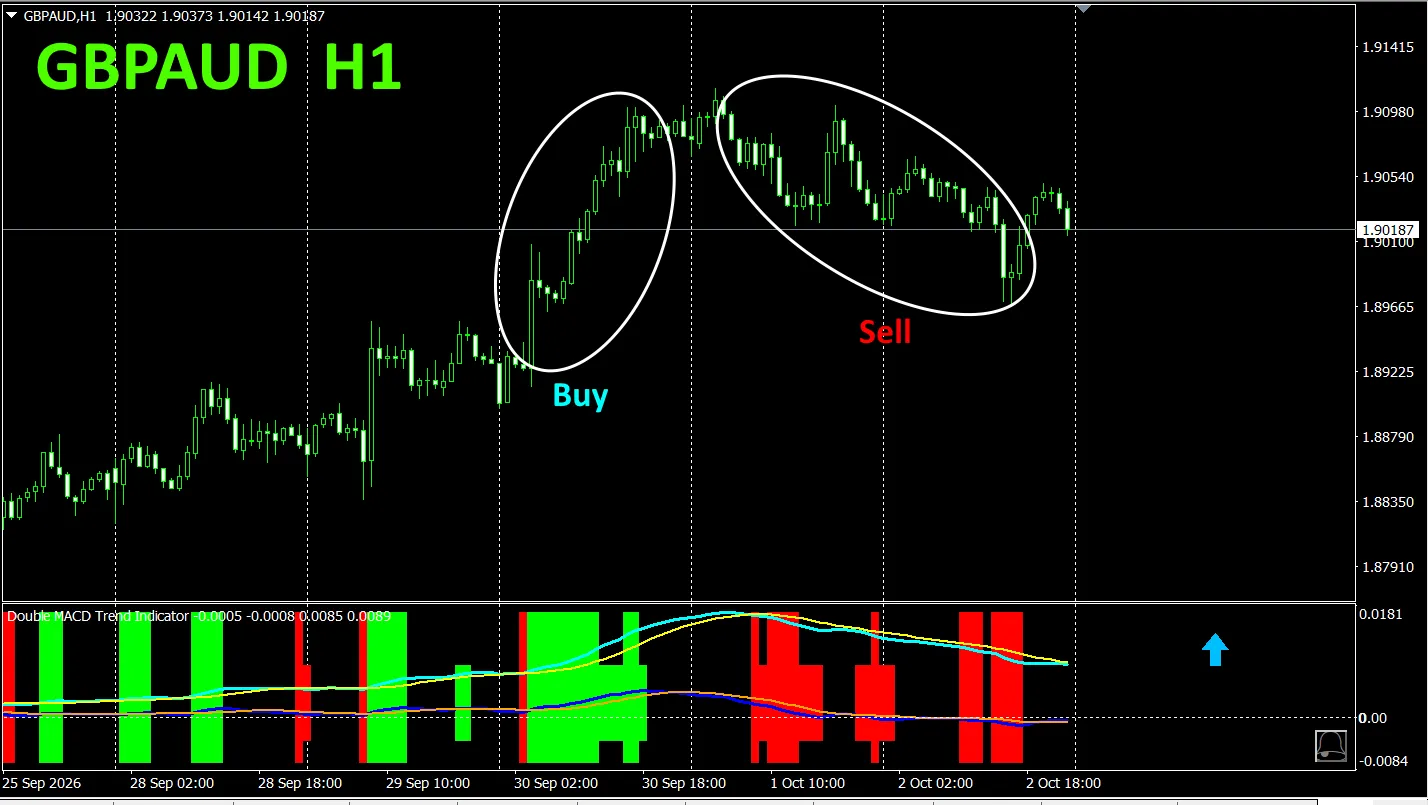
With “Dual_MACD_Trend_Indicator”,just follow the simple rule: buy in green zones,sell in red zones,and do not trade otherwise.
“Dual_MACD_Trend_Indicator”with this,you will no longer be confused about trade direction.
Note,“Dual_MACD_Trend_Indicator”was upgraded,the bar displayto twolevels,and it now shows the trend directions of the toptwohigher timeframes with arrows.
5. “Trend_Color_MA_MTF”has beennewlyreleased
From the sales page
“Trend_Color_MA_Dual_MTF”wasdevelopedto transform your trading.This tool is not just a moving average.It visualizes trend directionwith “color”,and the moment opportunity arrivesit alerts you with “sound”and“notifications”—your dedicated assistant.
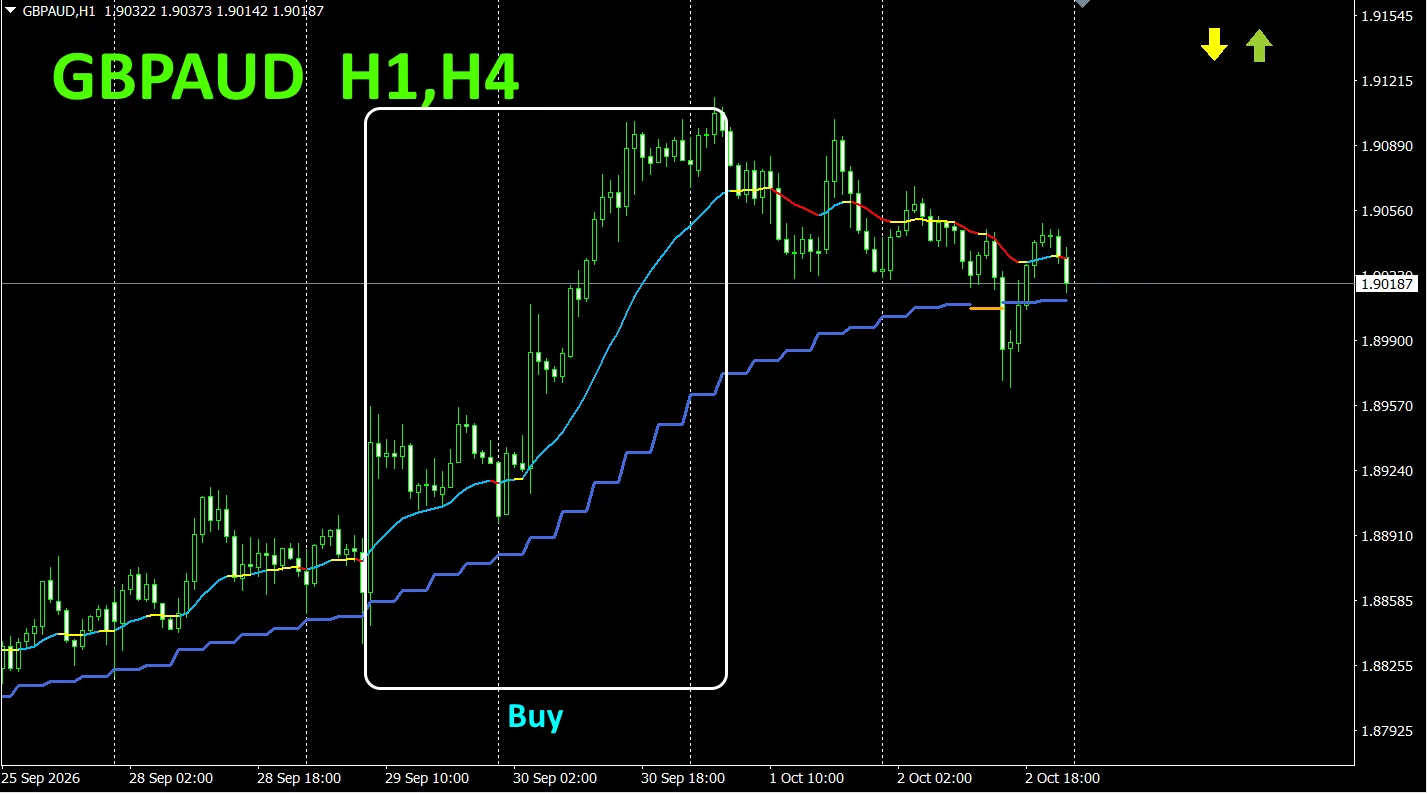
As one example,GBPAUD’s1-hour chart, the 4-hour moving average was displayed simultaneously.
The jagged, stepped lineis the 4-hour moving average. 1-hour moving average andthe 4-hour moving average,are shown in blue tones in an uptrend,and in red tones in a downtrend,so the current chart’s trend direction,and the higher timeframe’s trend direction,can be identified at a glance by color.
When the colors of the higher timeframe and the current timeframe align in the same color family,trade sell if red-toned,and buy if blue-toned.
For a buy, 1-hourMAislight blueand rising, 4-hourMAisblueand rising—buy at that point.
In the figure above,focus on the area enclosed by the white rectangle and trade buy.
For details,please see the following link.
https://www.gogojungle.co.jp/tools/indicators/75985
“8CFDVisualization IndicatorAnyEdition”
https://www.gogojungle.co.jp/tools/indicators/32288
“ToreTore Indicator”
https://www.gogojungle.co.jp/tools/indicators/50115
“TrendLine-EX”
https://www.gogojungle.co.jp/tools/indicators/42257
“8CCurrency Strength Visualization Indicator”is,please refer to the following pages.

MT4Edition https://www.gogojungle.co.jp/tools/indicators/39150
MT5Edition https://www.gogojungle.co.jp/tools/indicators/39159
[My listed products]