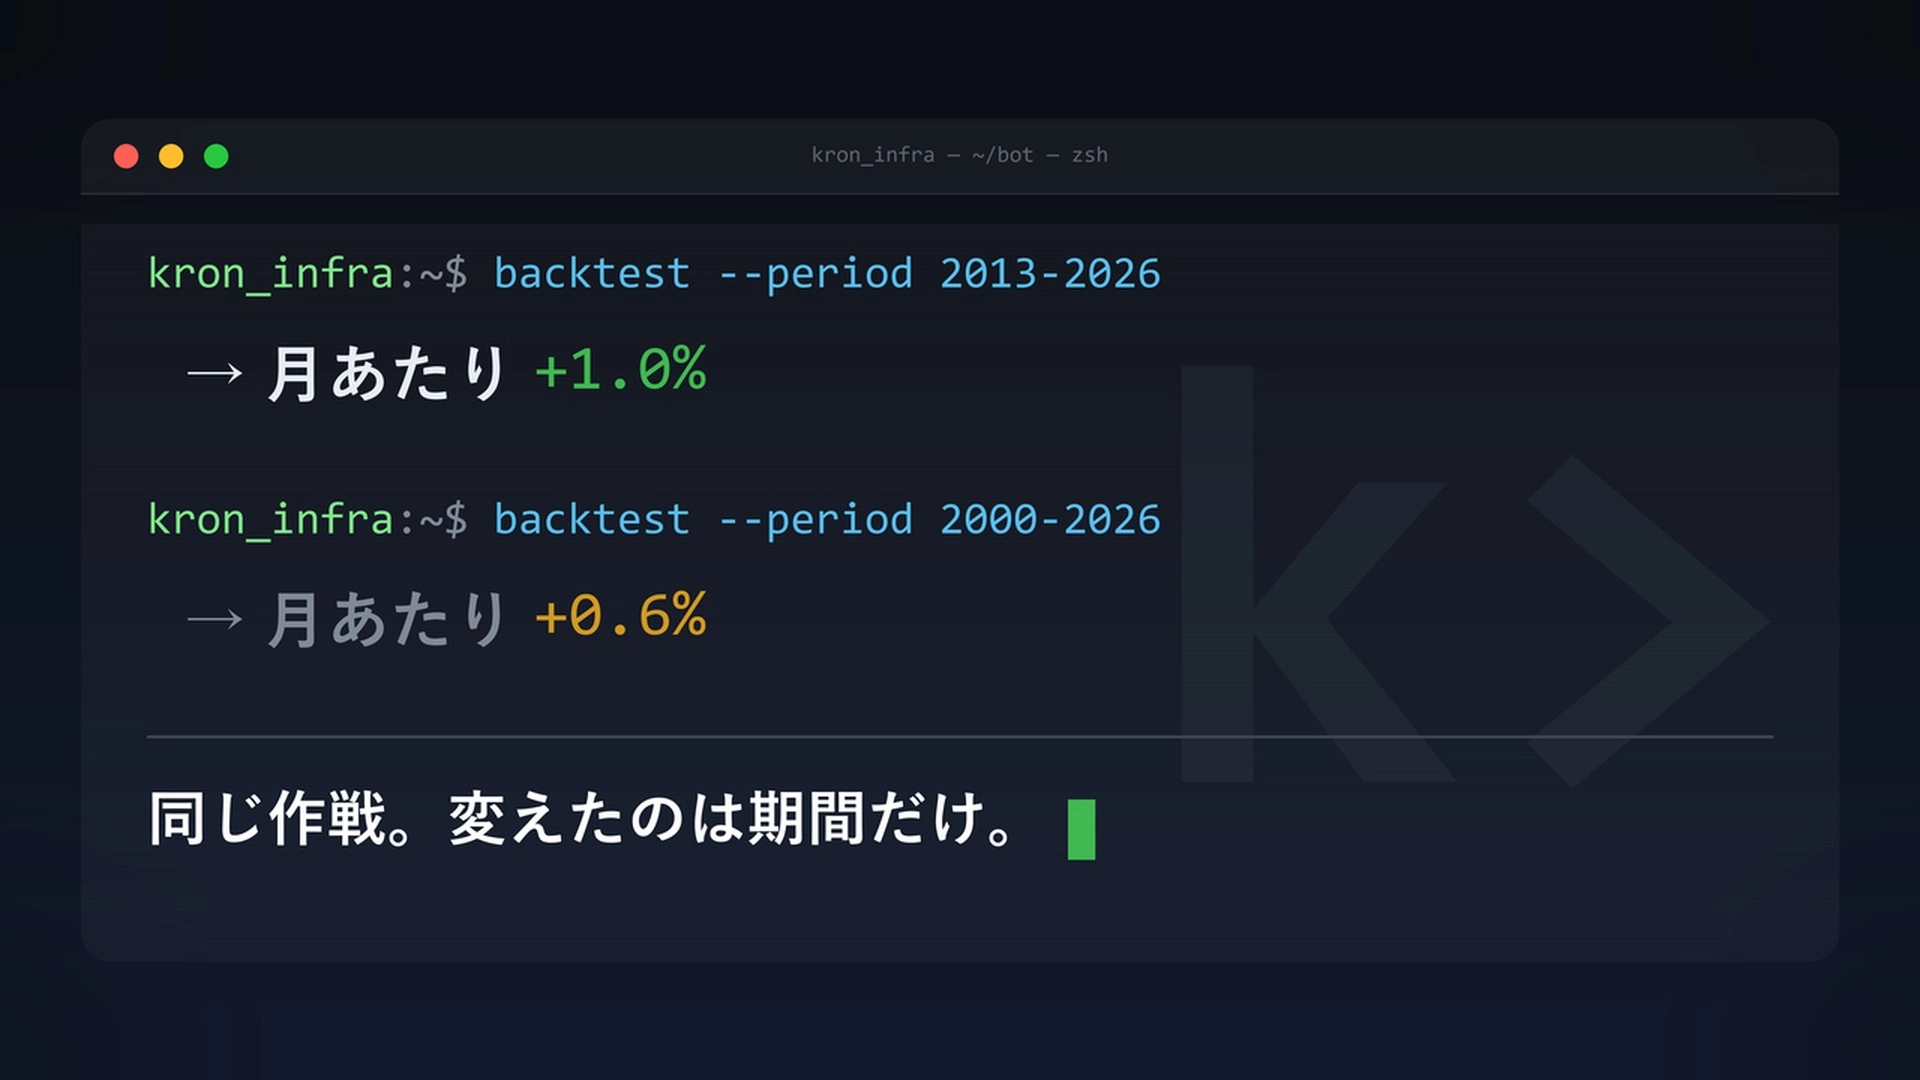
"Month 1%" becomes "Month 0.6%". If you average the backtest figures over 26 years
Hello, I’m Cron. I usually work as a management-level infrastructure engineer, and alongside that, I’m building a swing bot for Japanese stocks (a semi-automatic trading program that holds stocks for a few days to a few weeks) together with AI (Claude Code). I’m a beginner at both programming and day trading. I started with the idea that it would be nice to make a living from investing someday, at least at that level of enthusiasm.
*This article is a development note as of August 31, 2026.
Without beating around the bush, I’ll state the conclusion today.
Even if backtests using historical data yield good numbers, treat those numbers as “half-truths.”There are three reasons for this.
- Depending on how you slice the time period, the numbers can be misrepresented quite easily
- Adjusting parameters to improve performance is usually “tailoring to the past”
- In the first place, you’re often only looking at stocks that went up
All of this is stuff I actually did with my own Bot. I’ll write them in order.
What exactly is “backtesting”?
Backtesting is calculating how much you would have earned (or lost) if you had traded this strategy in the past.
For example, you decide on a strategy like “sell/buy when two moving averages cross—short-term and long-term,” and apply it to ten years of stock price data to compute results. If you write a program, you can get numbers like “annualized return ◯◯%” or “maximum drawdown of this much” in a few seconds.
When you see good numbers here, you feel incredibly happy. You think, “If I keep going like this, this might work!” Butthis rush is the most dangerous. Today I’ll talk about that.
Trap ①: If you cut the period, the numbers warp
If I measured one of my strategies only during a favorable economic period (the rising market after Abenomics),the result was about +1% per month, i.e., around double-digit annualized. I was extremely excited. Moreover, this was on the very first day I started touching Claude Code. I seriously thought, “If I team up with AI, I can do this on day one? It’s easy!”
However, when I tested the same strategy and parameters over the 26 years from 2000 to 2026,the monthly return dropped to +0.6% (about +7% per year)
Furthermore, including the stagnation period known as the “Lost Decade,” the monthly return fell to +0.3%, and the maximum drawdown from the peak was as high as 34%, with nine consecutive losing months.
No, I didn’t change a single character of the strategy.What changed was only where to measure from and to. Just that alone can move the numbers this much. When you see nice numbers, first ask yourself, “Which period did I measure this from?”
Trap ②: Parameter tweaking tends to become “tuning to the past”
If you tweak parameters a little, such as deciding how many days to use for the moving average, you’ll find combinations that perform well. It’s fun. The numbers get better and better. I found myself spending about three hours absorbed in it. It was immersive and really quick.
But this is a trap calledcurve fitting (overfitting). By fitting the strategy too closely to past market data, the parameters memorize mere noise in price movement, and they don’t work in future markets (source: OANDA Securities Lab).
The way to tell is simple:if changing a parameter slightly causes a sharp drop in performance, it’s suspicious. Conversely, if performance hardly changes with small tweaks, that’s somewhat better (source: ProgramFX).
I also tried exhaustive combinations. In a short period including favorable times, results varied from monthly 0.6% to 1.2%, with some above 1%. Butover the full 26 years, there wasn’t a single combination that reached 1%. The 1% in short periods was helped by the chosen time window, not by true skill.
There’s a more frightening aspect. Even if you don’t intend it, you end up selecting “which indicators to use” and “which rules to follow” by looking at past results. That means the test is already tainted (source: holaprime). Yes, that hurts to hear.
Trap ③: You only look at stocks that won
My Bot focused on stocks that are currently major players in Japan.
This is, on reflection, a fairly obvious cheat.The ones that remain major now are those that survived the past, so testing the past using only those stocks yields better results than the reality. Stocks that were delisted or that fell out of favor aren’t included from the start.
This is calledsurvivorship bias. It’s the same structure as “only asking successful candidates for study methods and assuming they’re universally applicable.” The remedy is to replace the data with a dataset that includes delisted stocks as well. I haven’t done that yet; it’s homework for me.
By the way: I underestimated fees
One more thing. I initially didn’t account for trading fees and the slippage that prevents you from getting your desired price, at least not precisely.
When I recalculated properly,a strategy with high trade frequency would lose money at about a 100,000 yen scale due to fees. In backtests, the “profit” amount can change dramatically depending on how you model fees.
So, how should you doubt it?
Three ways I’m using now to challenge the results.
- Divide the period into an early and late half. See whether both halves show decent performance. If only the latter half is bad, it’s just aligning to the early half.
- Line up results by year. Check whether the whole picture isn’t being driven by just one or two years.
- Run parameters through all combinations. See whether one particular setting is extraordinarily strong (fragile) or whether surrounding combinations are similarly strong (robust).
In addition, the most important step istesting on future data(forward testing). Since tweaking the past would be cheating by knowing the answers, you can only observe how the market moves from today onward over time and record it.
As a rule of thumb, some say that you should have at least 30 trades per parameter to consider the statistics reliable (source: fortraders). If you tweak three parameters, that’s 90 trades. The hurdle is higher than you might think.
“Winning in the past” and “winning in the future” are different things
To sum up.
When backtests show good numbers, what you should look at isn’t the magnitude of the numbers but“how did this number come about?”. Did you skip over a time period? Did you tailor the parameters to the past? Are you only looking at winning stocks? Did you underestimate fees?
With this in mind, I revised my expectations from “1% per month” to “about 0.6% per month over 26 years.” It’s disappointing, but unless I make this correction, I’ll realize the same thing only after I’ve put real money into it.
Next, I’ll document how to actually perform forward testing, and I’ll prepare for opening a securities account while waiting for the process to begin.
※This article is my development note. It does not recommend any particular stock or method. Investing is a personal decision.