
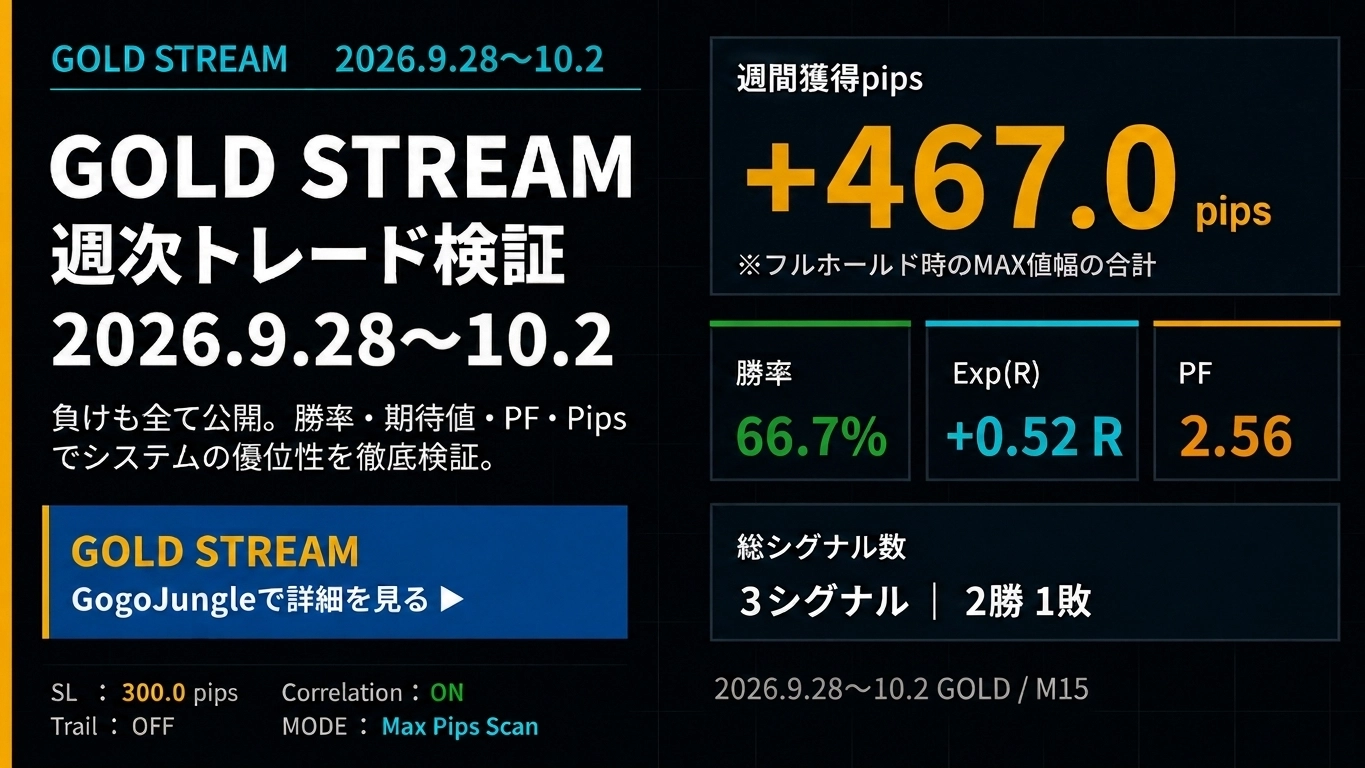
+467pips【Weekly Trade Verification & Distribution History】GOLD Day Trading Specialized Series “GOLD STREAMv2” 2026.9.28~10.2
+467pips【Weekly Trade Verification & Delivery History】
GOLD Day Trading Focused "GOLD STREAMv2" 2026.9.28~10.2
Check GOLD’s price movements, strength, and correlations, and verify signal accuracy, price range, and expectancy weekly. Not only win rate, but also comparison with PF, Exp(R), and 5-day ADR to evaluate this trading environment.
① GOLD Market Analysis
1. Price Variability
For the week of September 28 to October 2, 2026, GOLD (XAU/USD) saw a sharp drop at the start of the week, followed by a bottoming rebound into midweek, then a regain of selling pressure toward the end of the week, resulting in a choppy range and volatile swings.
- Early-week plunge:From the prior week's high area, selling pressure intensified, causing a significant pullback at one point.
- Autonomous midweek rebound:Buying around the lower support line around 4138 was observed, showing a V-shaped recovery at times.
- Week-end hesitation to move higher:Near the 4,200 level resistance band (around DR1/DR2), selling pressure emerged again, ending the week with unclear directional momentum.
5-day ADR855pipsremains high in volatility, with large short-term price swings, but trends tended to be less persistent due to the difficult price formation.
2. Demand-Supply & Investment Factors
The supply-demand dynamics and macro environment were directly influenced by the outlook for US monetary policy and movements in interest rates and the dollar.
- US long-term rates and dollar index:Firming US rate expectations and dollar repurchases added a short-term drag on gold, which does not yield interest.
- Central banks’ supportive buying:Real demand in high-price ranges (jewelry, etc.) paused briefly, but central banks’ continued accumulation of gold reserves provided medium-to-long-term support.
- Geopolitical risk and safe-haven demand:Uncertainty in international affairs sustained some safe-haven buying at pullbacks.
Rising interest rates and central-bank support created a balance, limiting both upside and downside movements.
3. Investment Trends
Capital flows from institutional and individual investors showed these characteristics:
- Gold ETF flows:In a sharp decline, there were short-term profit-taking outflows, but quick re-entry near the bottom was observed.
- Futures market position adjustments:In COMEX and other gold futures, after a round of long-position selling by speculative players, range-trading became prevalent.
- Short-term capital seeking volatility:Active turnover in day-trading capital using the wide intraday range of 855pips stood out more than chasing a single directional trend.
In an environment with lacking clear trend-following players, frequent short-term supply-demand shifts and technical levels drove capital movements.
4. Overall Assessment
This week's GOLD market featured“high volatility and irregular wild swings”as a standout theme.
With an expansive 5-day ADR of 855pips, there were abundant profit opportunities, but blindly following signals or simple trend-following could lead to traps. Correctly discerning market strength and correlations, and avoiding unnecessary entries, was decisive in determining outcomes.
⑤ SILVER / COPPER Market Conditions
SILVER
SILVER moved with GOLD but with industrial demand expectations intertwining, resulting in high volatility. After early-week decline, pullbacks occurred, but concerns about rising rates capped upside, leading to a consolidation in the high-price range.
COPPER
COPPER faced strong influence from global manufacturing PMIs and economic indicators, continuing a heavy-upward price environment. While supply concerns supported lows, global economic slowdown and a stronger dollar pressured prices, resulting in range-bound, cautious movements.
② GOLD STREAM v2 Weekly Trade Verification
Weekly Verification Results
③ GOLD STREAM v2 Delivery History
Weekly Signal Delivery History

④ Weekly Verification AI Evaluation
This time5-day ADR 855pipspresented a wide range yet a challenging market environment with volatile swings and sharp rebounds. Beyond whether a signal appeared, we also evaluate the accuracy of rejection decisions based on correlation filters and the quality of captured ranges.
■ Signal Judgment and Entry Precision
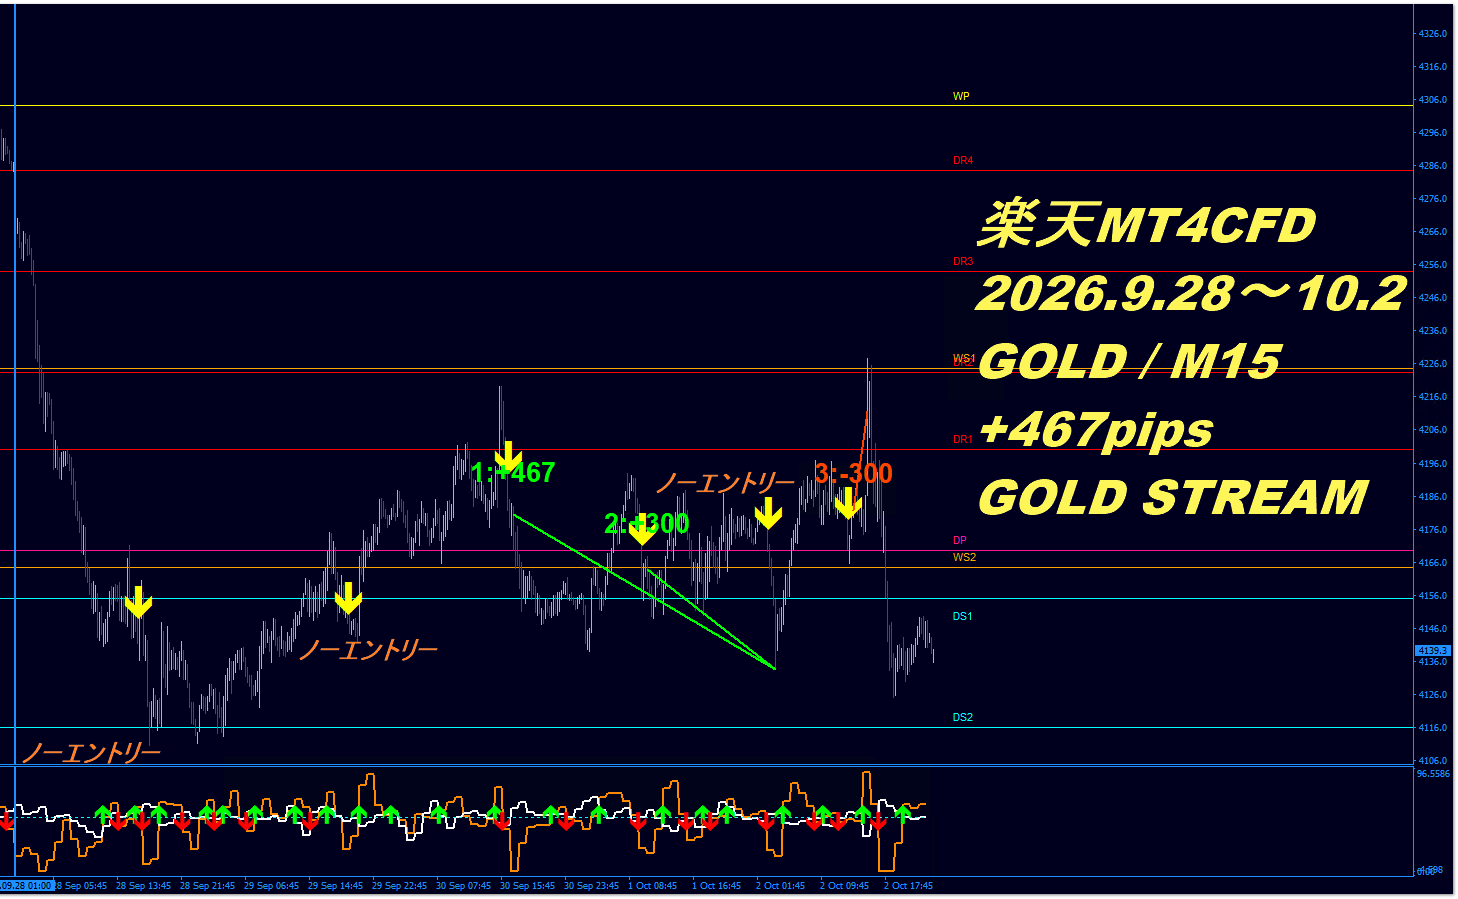
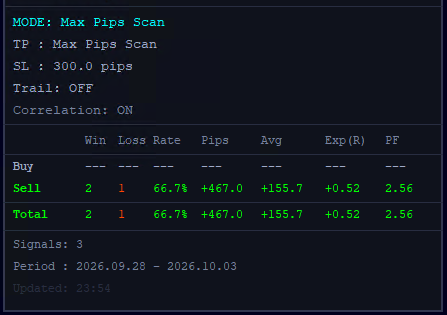
In the validation panel (2026.09.28 - 2026.10.03), three signals meeting the criteria were recorded—all Sell—and the result was2 wins, 1 loss; win rate 66.7%Specifically, the first Sell yielded +467pips (image 1), the second Sell +300pips (image 2), while the third Sell (image 3) resulted in a -300.0pips loss cut.
Notably, due to correlation being ON (inconsistency in correlation on the chart), there were three signals deemed “No Entry (standby)” (early-week pullbacks or counter-direction signals near the lows). This effectively avoided unnecessary losses from whipsaws or false signals.
Total Gathered Pips: +467.0pips, Average Profit: +155.7pips, which is a favorable ratio against the 5-day ADR 855pips, indicating very high-quality entry points even in a noisy market.
■ Performance from Win Rate, PF, Exp(R)
This week’s results showWin rate 66.7% · PF 2.56 · Exp(R) +0.52Rindicating excellent performance.
Profit Factor (PF) reached2.56because losses were capped at a fixed SL of -300pips (1 loss), while winning trades captured large ranges of +467pips and +300pips.
Also, the expectancy shown asExp(R) +0.52Rdemonstrates that each unit of risk, on average, yields a return of 0.52 units, proving the robustness of the logic. Even in volatile markets, capital growth remains reproducible safely and efficiently.
■ Strength/Correlation Analysis Evaluation
This week’s GOLD STREAM v2 value lies in the strength/correlation analysis shown in the subwindow (GOLD_STRENGTH) and the Correlation function to avoid wasted trades.
When the market loses direction and swings, following a single arrow signal can widen drawdown. The three “No Entry” inconsistent signals that were accurately filtered out this week were the major factor enabling the total +467pips. The combination of situational awareness and system control performed exceptionally.
■ MAX Pips Scan & SL Discussion
This chart usesMODE: Max Pips Scan / Correlation: ON.
The pips shown are the MAX values when fully holding the price action after signal generation. Therefore, +467pips does not guarantee actual realized profit.
Additionally, stop-loss (SL) decisions are based onthe 4-hour chart and are not determined by short-term moves on the M15 chart.
■ GOLD Market Difficulty
★★★★☆ 4 / 5
Although there was a very wide price range with 5-day ADR 855pips, early-week declines, midweek rebounds, and weekend selling pressed direction changes, it was a highly challenging market environment where discretionary judgment could be easily swayed.
■ GOLD STREAM Weekly Trade Verification Evaluation
★★★★★ 5 / 5
In a difficult volatile market, three no-entry outcomes due to correlation inconsistency were perfectly avoided, and among the three entries, two captured sizable ranges, resulting inWin rate 66.7% · PF 2.56 · +467.0pips.
The system’s filtering performance and favorable risk-reward ratio were demonstrated perfectly, earning a blemish-free top rating (5 stars).
■ AI Overall Commentary
What this week’s verification clarified is that GOLD STREAM v2 is not merely a signaling tool, but a highly powerful risk-management system that helps eliminate points where one would lose.
In the rough waters of 5-day ADR 855pips, had there been no three “No Entry” refusals due to correlation inconsistency, the overall result would have been much worse. The demonstrated reliability—only selecting high-quality entries—proves PF 2.56 and +467pips are achievable.
For those who want to accumulate profits in a volatile GOLD market without being swayed by emotions, use GOLD STREAM v2 as a fundamental standard for your trading strategy.
Verification Data & Evidence
Are you unsure about GOLD entries?
“It’s going up, but I don’t know if I should enter now.”
“I don’t know where to enter.”
“Price moves are too big; entering feels scary.”
In markets with large price ranges like GOLD, it’s important not to chase based on intuition alone, but toverify win rate, PF, expectancy, strength, and correlation to decide when to enter or pass.GOLD STREAM v2 specializes in GOLD day trading, supporting entry decisions by confirming market strength and correlations.
View GOLD STREAM v2 product page Ask a questionRelated Articles
If you want to learn more about trading philosophy and GOLD trading, check these out.
- 【Video】“GOLD STREAM Signal Movement After Signal | TRADE REVIEW (2026.8.10–9.04)”
- The Only Reason Why You’re Not Getting Results
- Why Trades End with “Ding-ding-ding” (Churn)
- 【Expose the Tool’s True Performance】GOLD STREAM Exclusive Win/Loss Analysis Tool Verification
- Conclusion: Can GOLD (XAU/USD) be traded in a domestic FX account?
The verification results and figures published in this article are based on historical market data and are for reference only. They do not guarantee future profits or similar performance.
The pips and profit/loss data shown are based on the maximum range (MAX value) reached after the entry signal occurred, calculated using a fixed stop loss (SL) setting. These are MAX values for full holding after signal generation and do not reflect actual realized profits or trading results.
Actual profit and loss depend on entry/exit timing, spreads, slippage, trading fees, execution environment, position size, take-profit/stop-loss judgments, and market conditions. Also, SL judgments are based on the 4-hour chart, and results may vary under different operating conditions.
Additionally, due to differences in trading conditions and price data delivery, the actual prices, pips, P/L, and execution results may differ across brokers, exchanges, or platforms. Therefore, there may be discrepancies between the published data and actual performance.
This data is provided as reference material to verify GOLD STREAM v2 signal advantage and market analysis accuracy. Final investment or trading decisions should be made based on your own financial situation, risk tolerance, and trading environment, at your own responsibility.