
(No title)
BTCUSD H8 23.6% Track — Re-break from the lower attempt, rise after the pullback
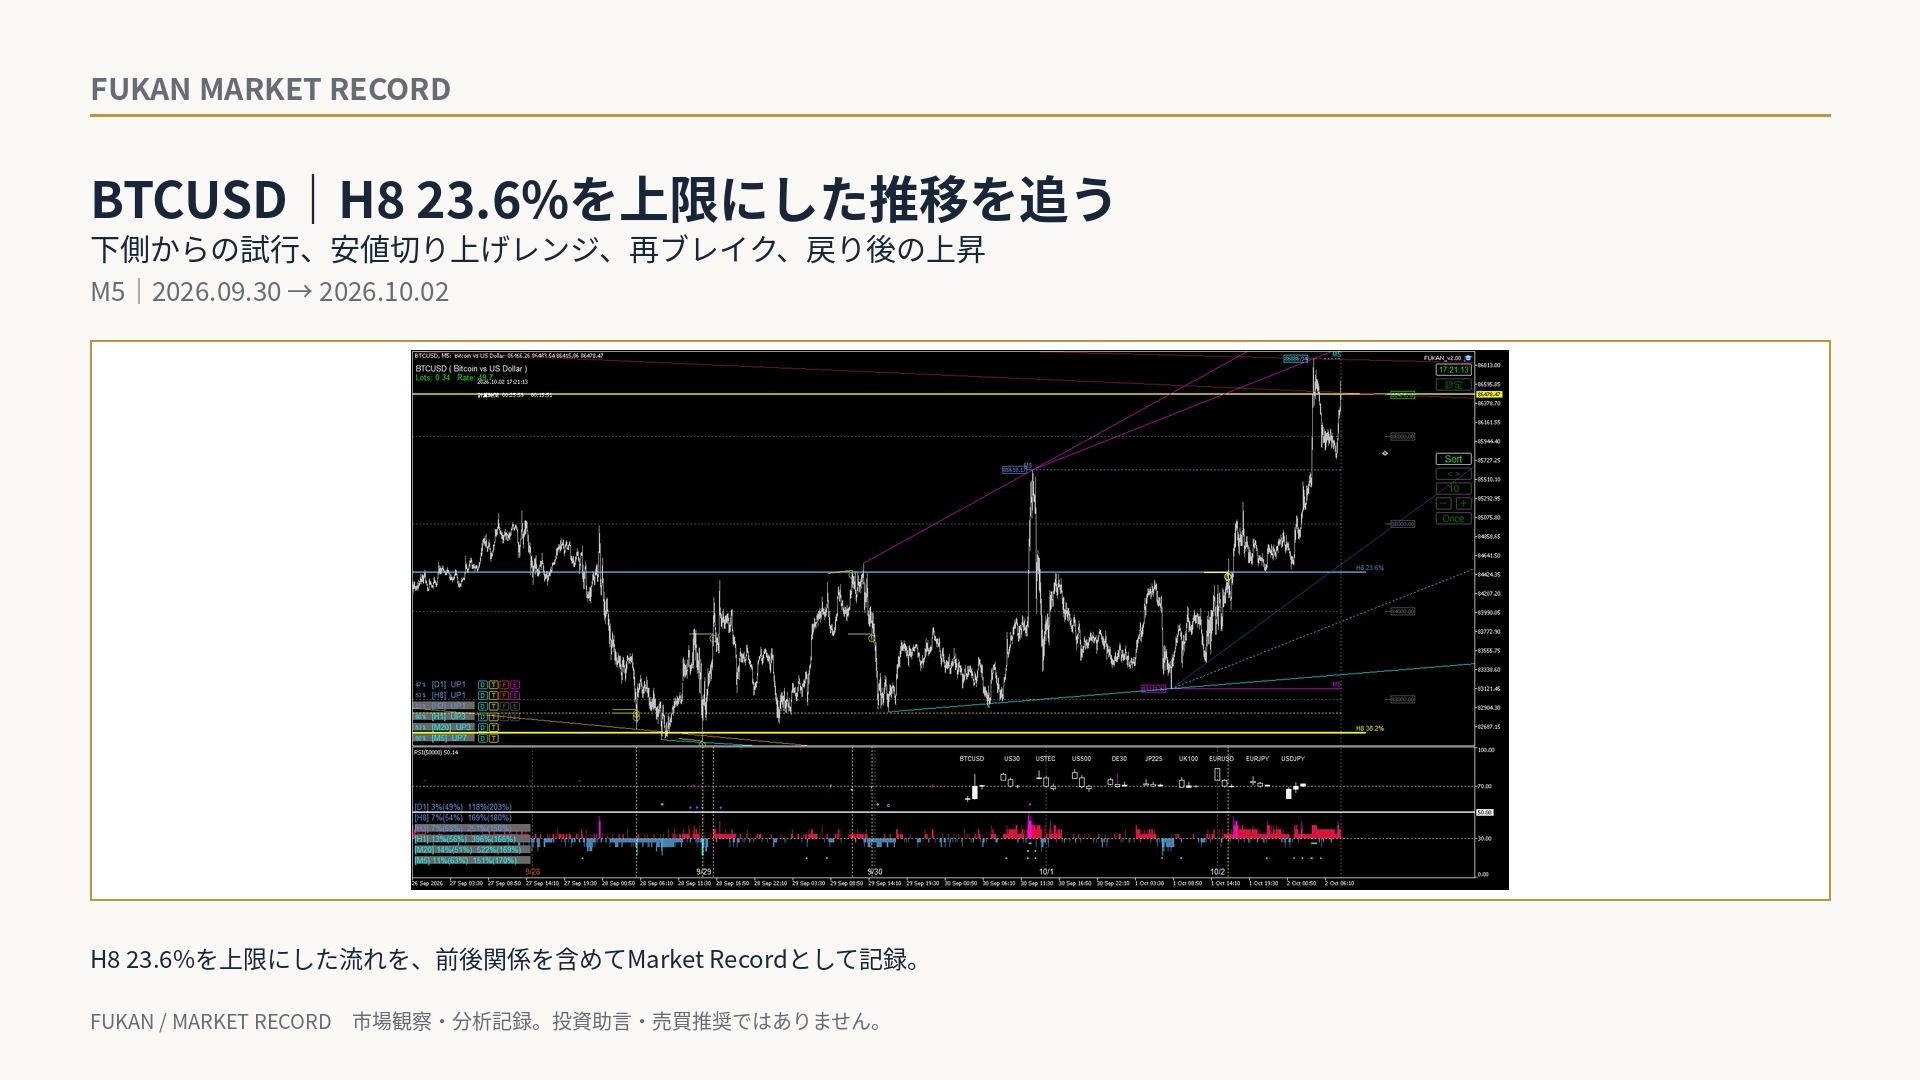
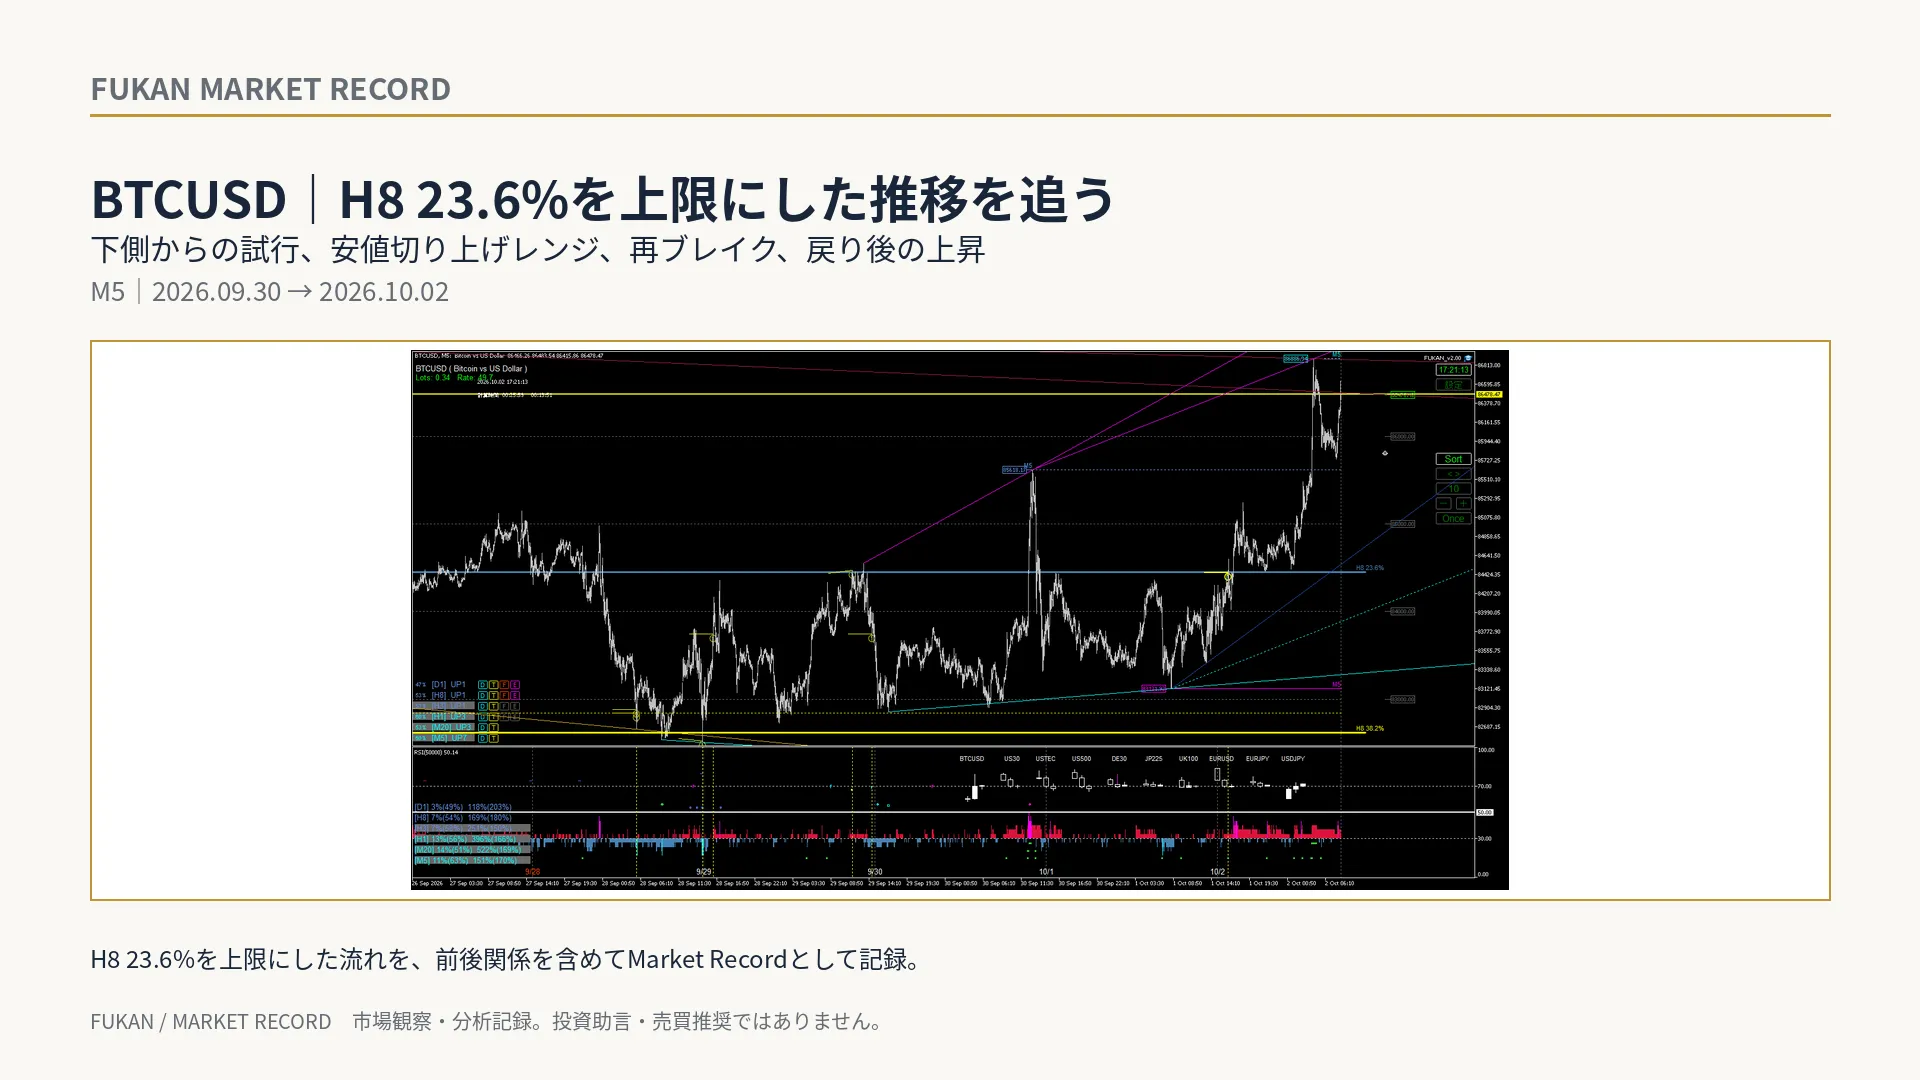
Using saved BTCUSD M5 FUKAN live screen images from September 30 to October 2, we verify price movement around the H8 23.6% at five time points.
The theme this time is not simply that “the range was broken upward.” On September 30, during the New York session at month-end, after attempting to break upward from the lower side of the H8 23.6%, the price formed a ranging pattern with its low rising while the 23.6% remained as the upper limit. In the early hours of October 2, it re-broke while leaving the yellow line intact. Subsequently, there was a pullback, and the price rose again after rebounding near 23.6%.
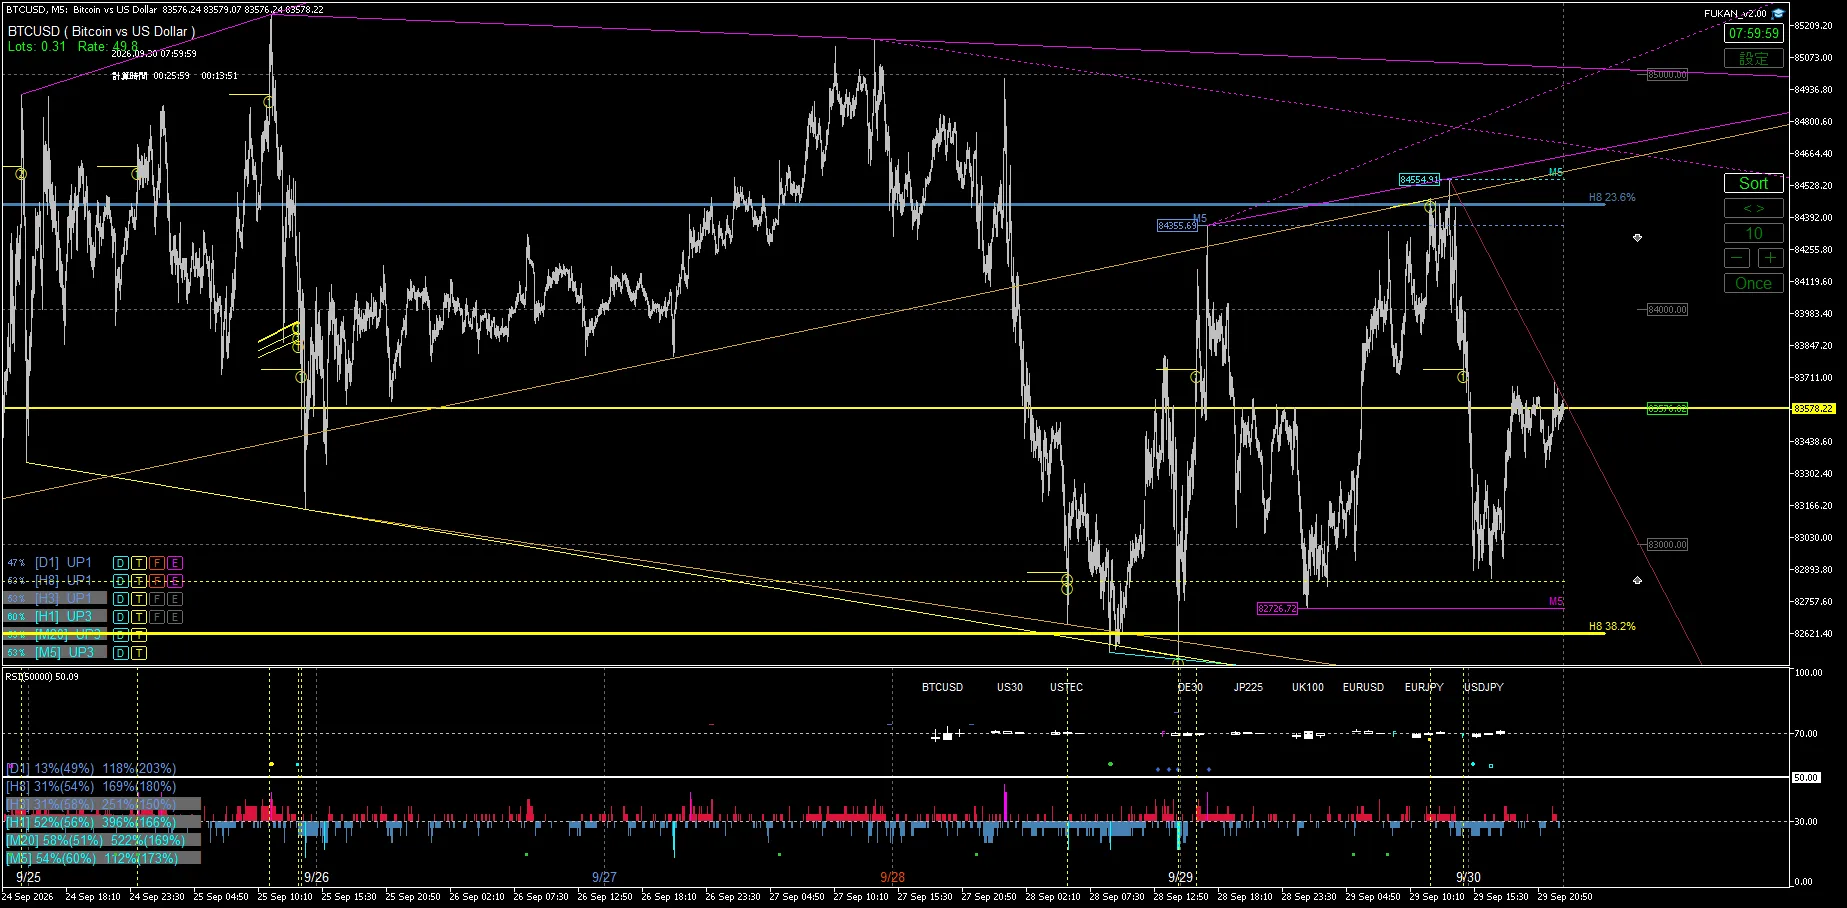
1|September 30, Month-end NY time — Break attempt from the lower side of 23.6%
In the saved image corresponding to the September 30 month-end New York session, the price is below the lower side of H8 23.6%. At this point, there is activity attempting to break upward toward the 23.6% that is acting as the upper boundary. We will use this as the starting point.
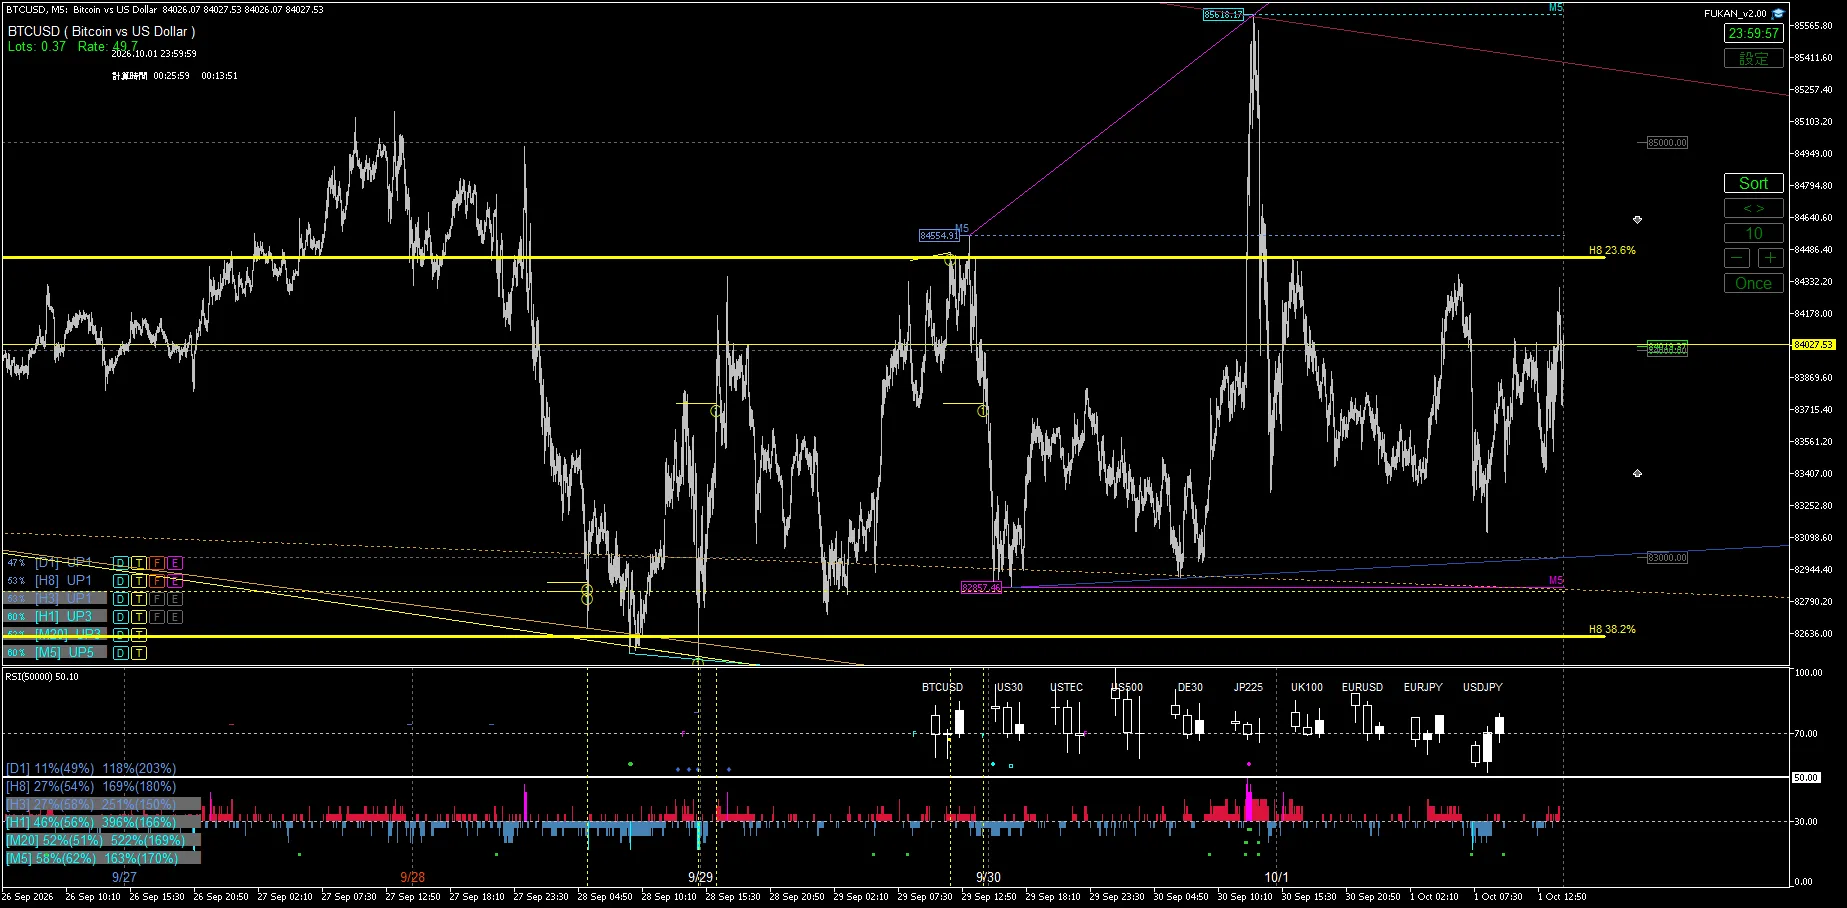
2|October 2, 00:00 — Range with the low rising while 23.6% remains the upper limit
In the image at 00:00 on October 2, the price is still below H8 23.6%, but the lows are gradually rising. The upper boundary remains constrained by 23.6%, while the price is supported near the blue rising line on the lower side, showing a flow toward approaching the upper limit within a near-range pattern.
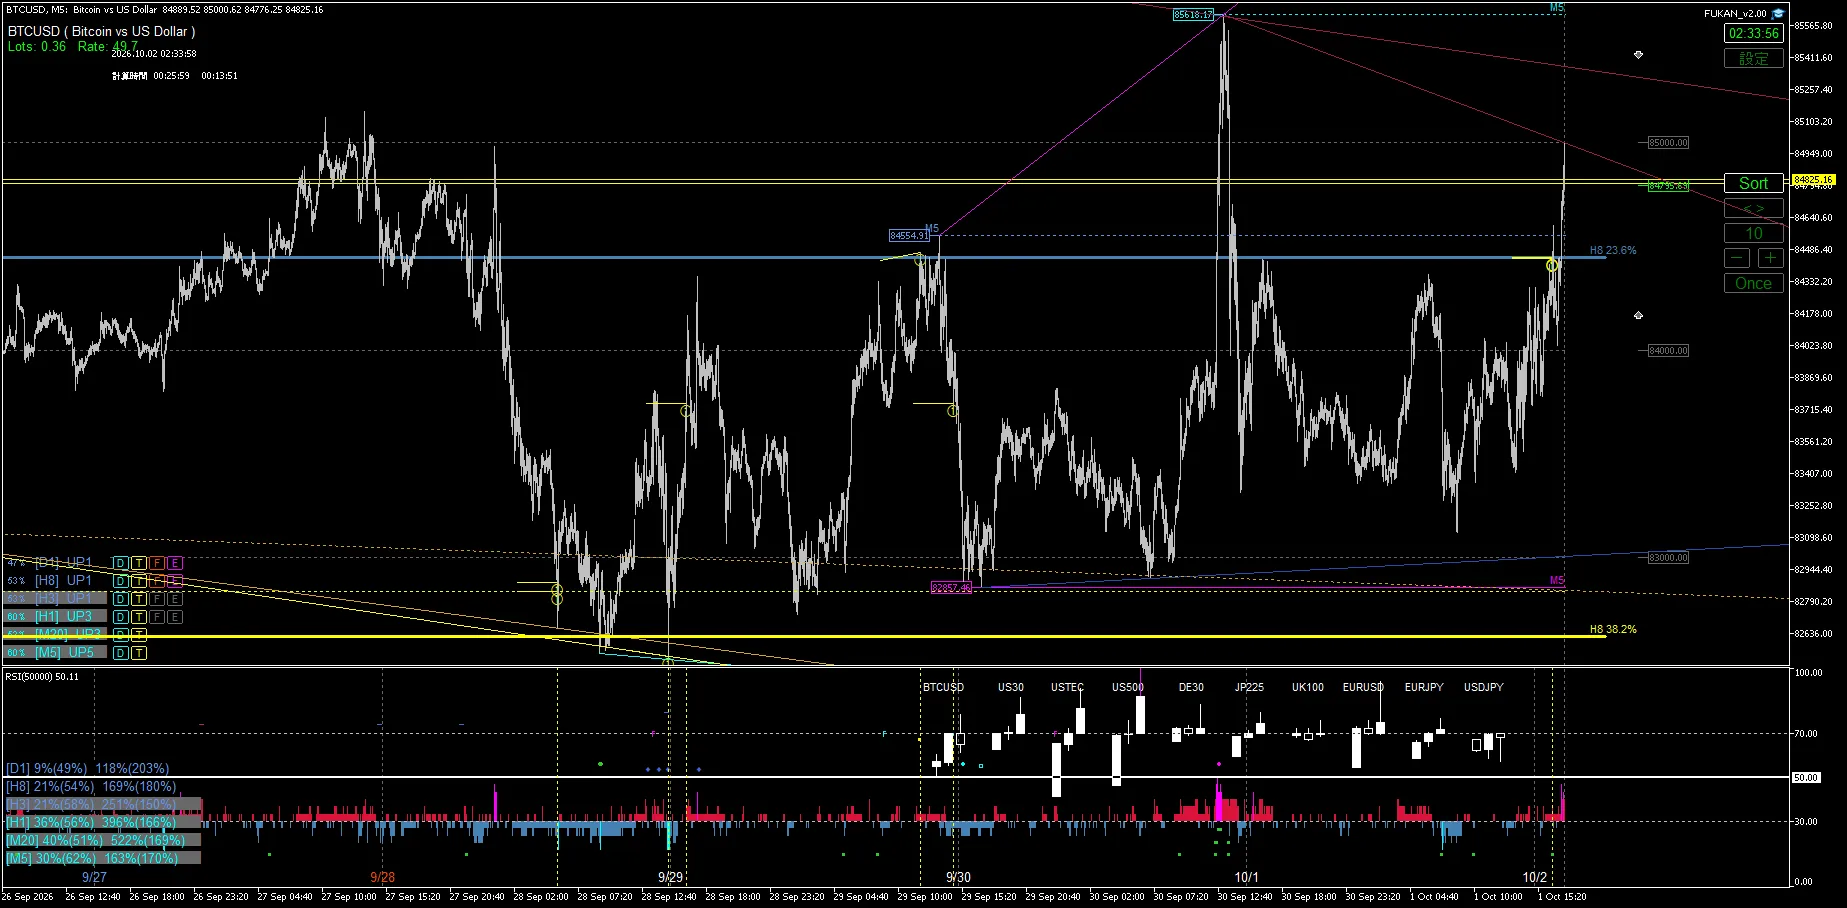
3|October 2, 02:33 — Re-break while leaving the yellow line
In the image saved at 02:33, the price has broken above the H8 23.6%. The yellow line is still visible here, confirming that the price has once again broken above the previously observed upper limit. This is not a one-off breakout; the key point is that it is a re-break after a lower-side attempt and a rising lower boundary established the context.
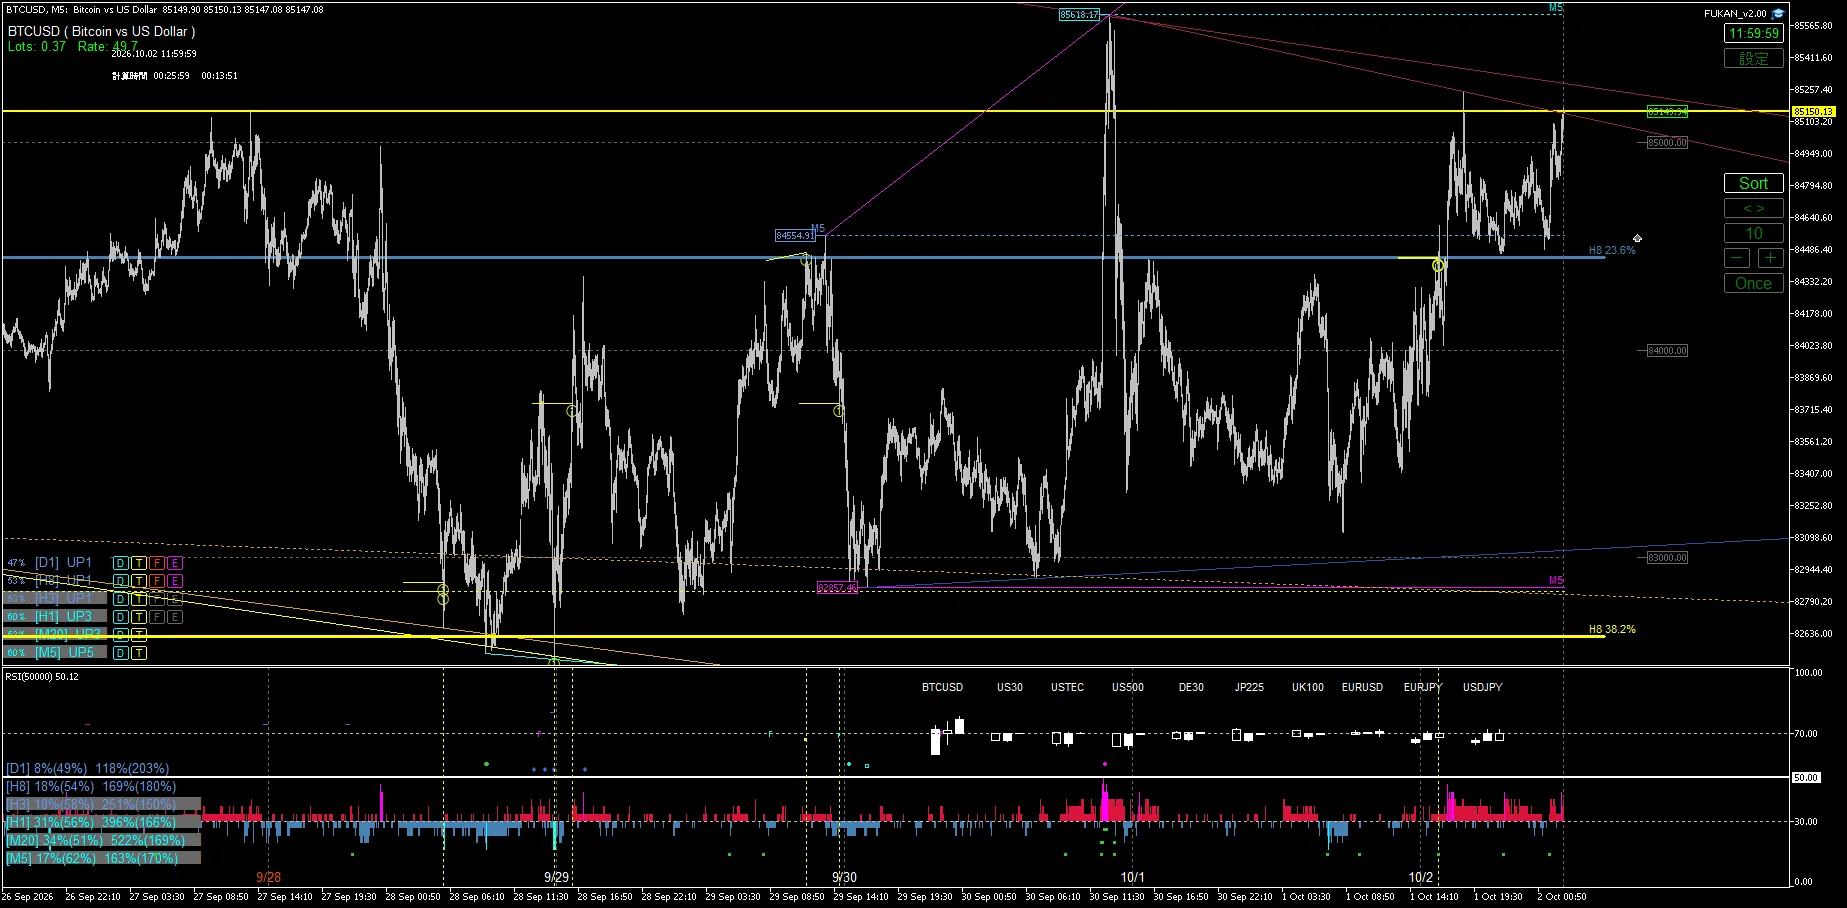
4|October 2, 12:00 — Return to near 23.6% and rebound
After the re-break, the price returns near the H8 23.6% first. In the 12:00 saved image, you can see that while handling the retracement, the price begins to move away from 23.6% to the upside again. Here it is important to observe what happened after the breakout.
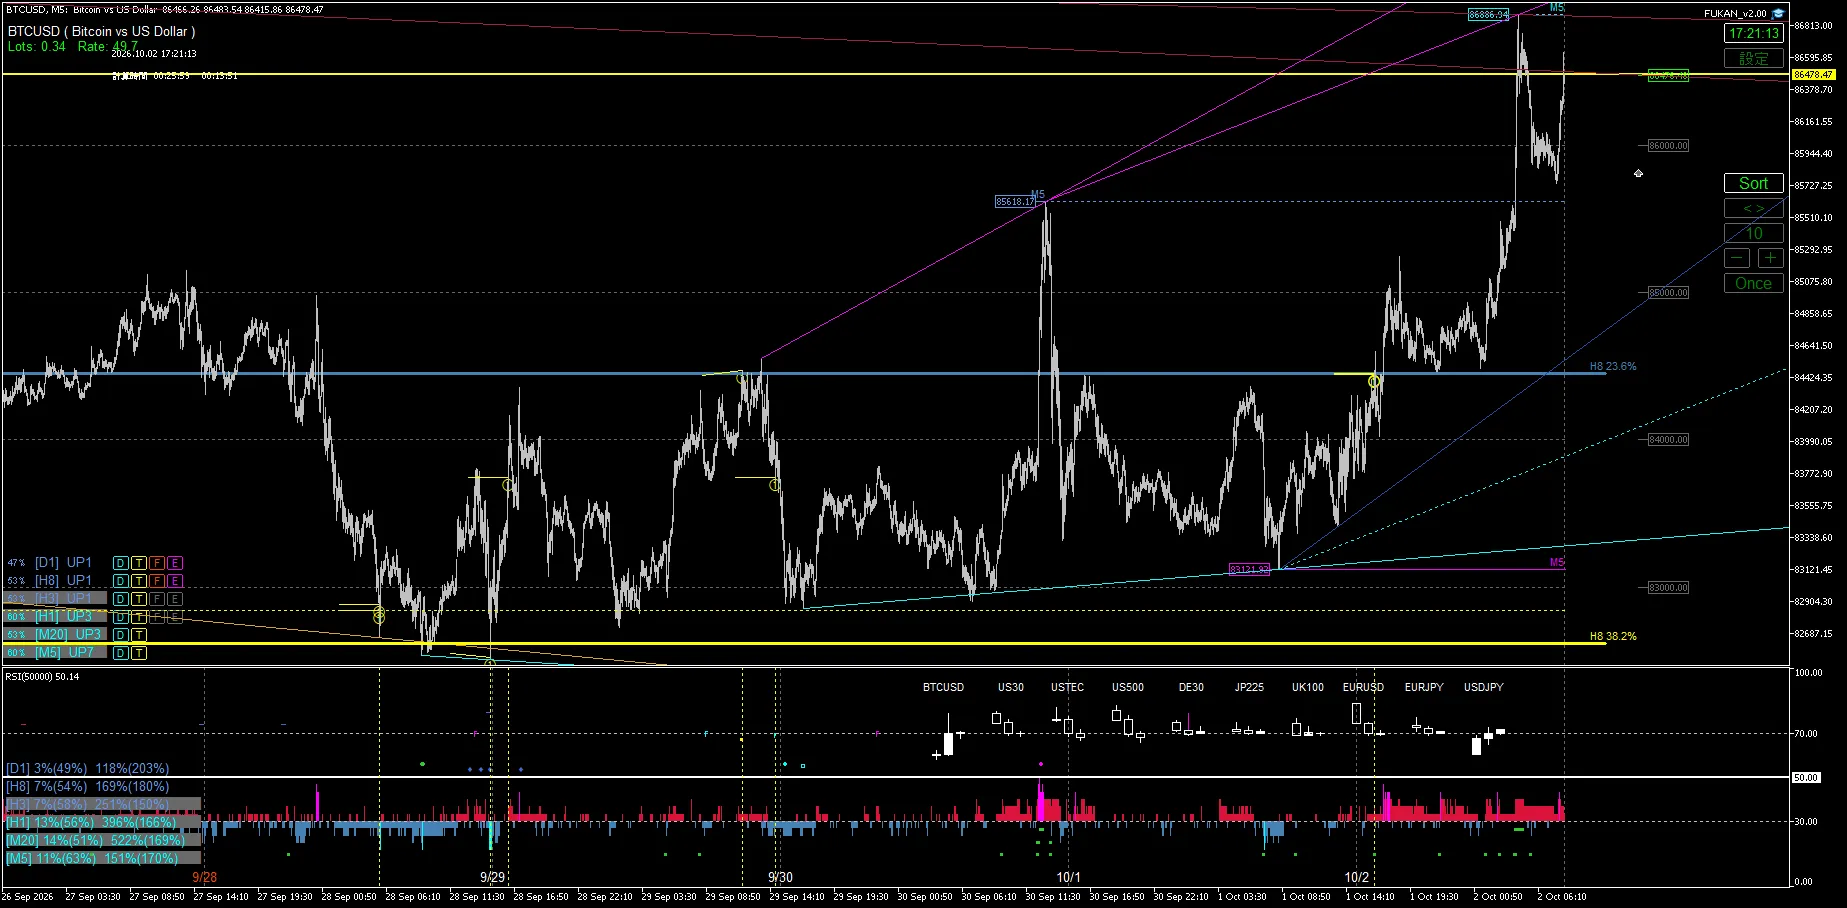
5|October 2, 17:21 — Continued rise after the rebound
At 17:21, after rebounding around 23.6%, the price moves further upward. By recording not only the breakout but also the upward move following a pullback, we create a more context-rich Market Record.
What we are looking at in FUKAN
In FUKAN, we do not draw conclusions from a single line touch or a momentary breakout. We keep multiple time-frame display levels and the current price on the same screen, and verify how price moved before and after.
In this BTCUSD case, H8 23.6% is not just a single line; it sits at the center of the sequence: the September 30 month-end NY session breakout attempt, the rising-lows range, the late-night October 2 re-break, the retrace, and the rebound followed by an ascent. FUKAN Market Record is a record designed to preserve these before-and-after relationships.
Summary
In this BTCUSD case, after attempting to break upward from the lower side of 23.6%, a range formed with the upper limit at 23.6% with rising lows, and a re-break occurred in the early hours of October 2. After that, the price retraced to around 23.6% and rebounded upward.
From this set of images alone, it is not possible to determine statistical superiority of a particular line or future price movement. We will continue to record reactions, breakouts, non-reactions, and subsequent developments using the same method.
FUKAN offers a 7-day Trial. After confirming display, operation, and calculation time in a real MT5 environment, you can decide whether to continue usage.
This article is market observation and analytical record, not investment advice or a buy/sell recommendation. It does not guarantee future price movements, profits, or win rates. The recorded image times and market session representations are described separately to avoid confusion.