
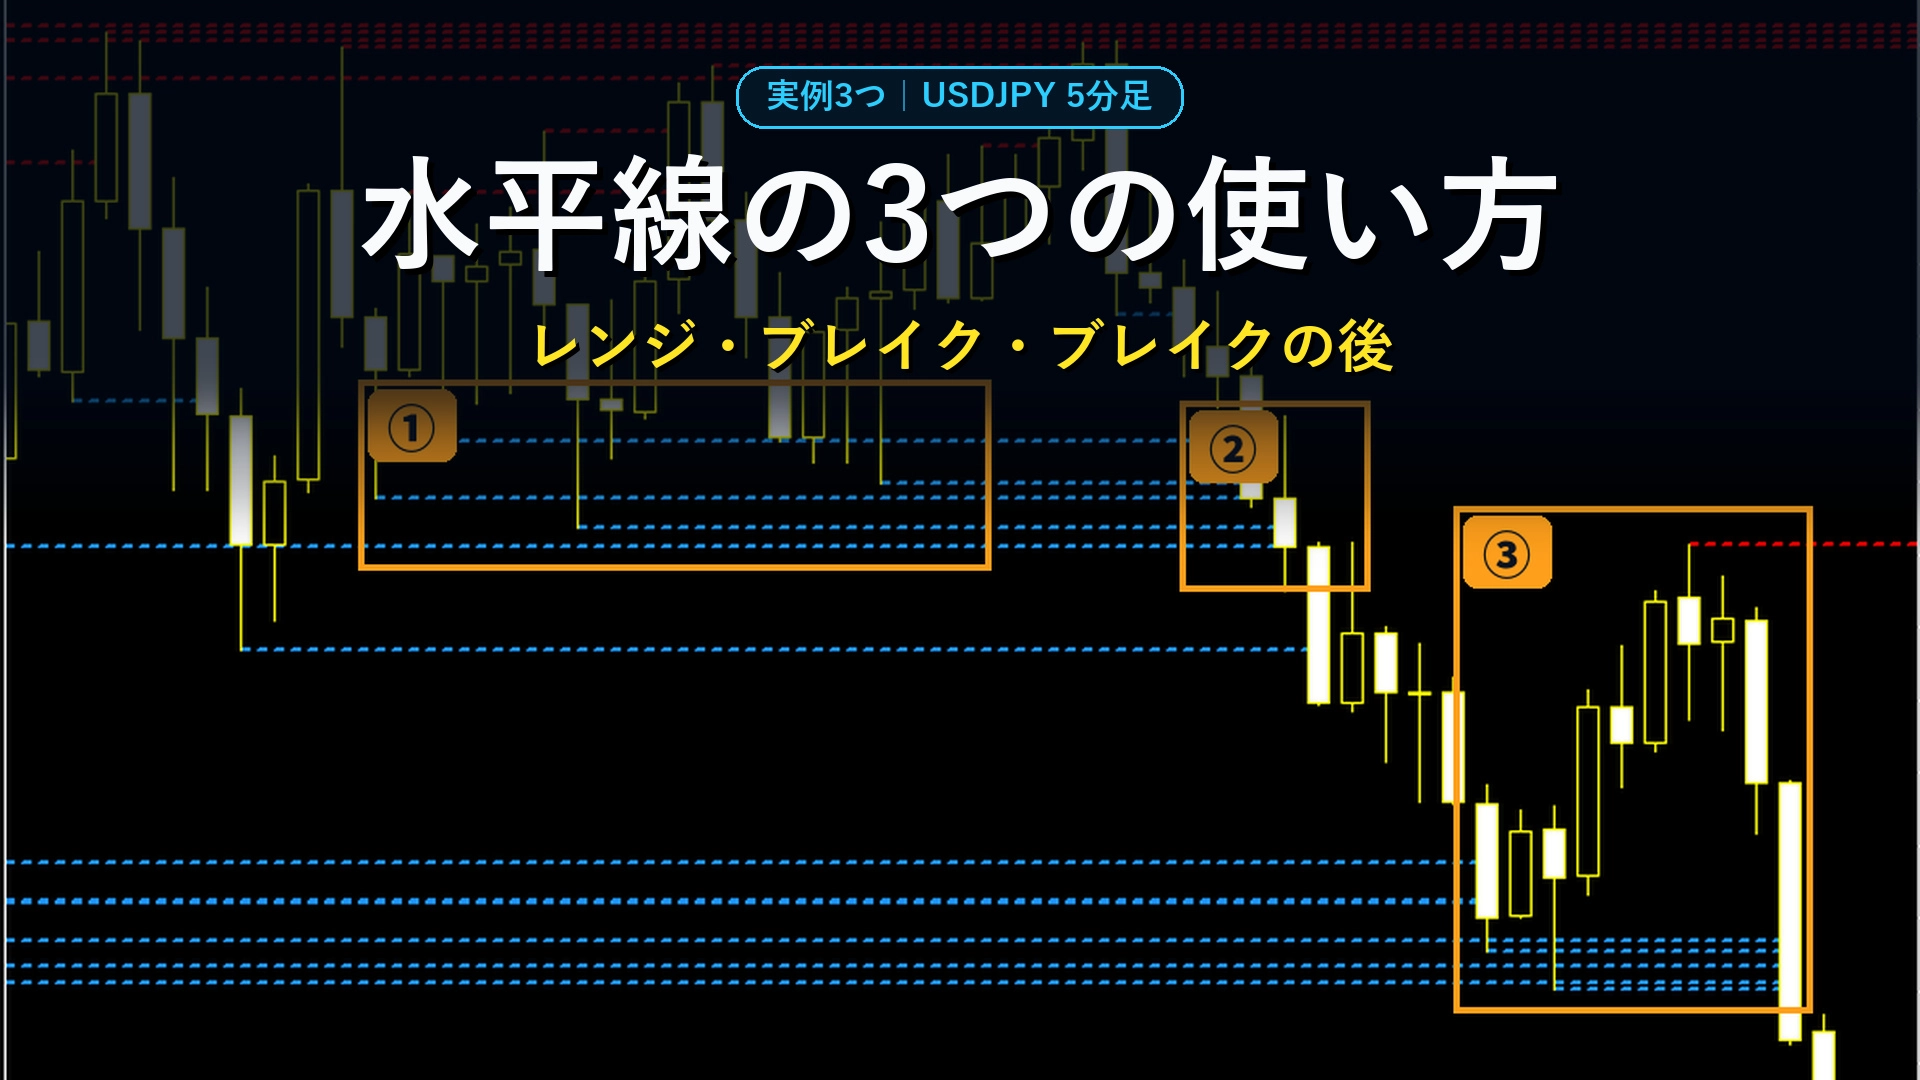
[Three Examples] Three Ways to Use Horizontal Lines: Range, Break, and Break After (USDJPY 5-minute chart)
Even if you draw a horizontal line, you probably won’t wonder, “How should I use this line?”
Horizontal lines have three main usesThree uses.
・ Range targeting: when price action stalls near the line
・ Range breakout targeting: when price breaks through the line
・ After the breakout: the price that breaks becomes a guide for the next move
In this article, we will use USDJPY 5-minute charts to introduce the three uses with actual charts, one by one.
Settings for this article
・Currency pair and timeframe: USDJPY 5-minute chart
・High/low determination: a single bar protruding above the left and right hills and valleys
・End of the line: the line ends when the body (the thick part of the candlestick) crosses the line. If only the wicks cross, the line remains
・The lines were drawn automatically by the MT5 indicator and were not moved afterward
This day’s chart overall
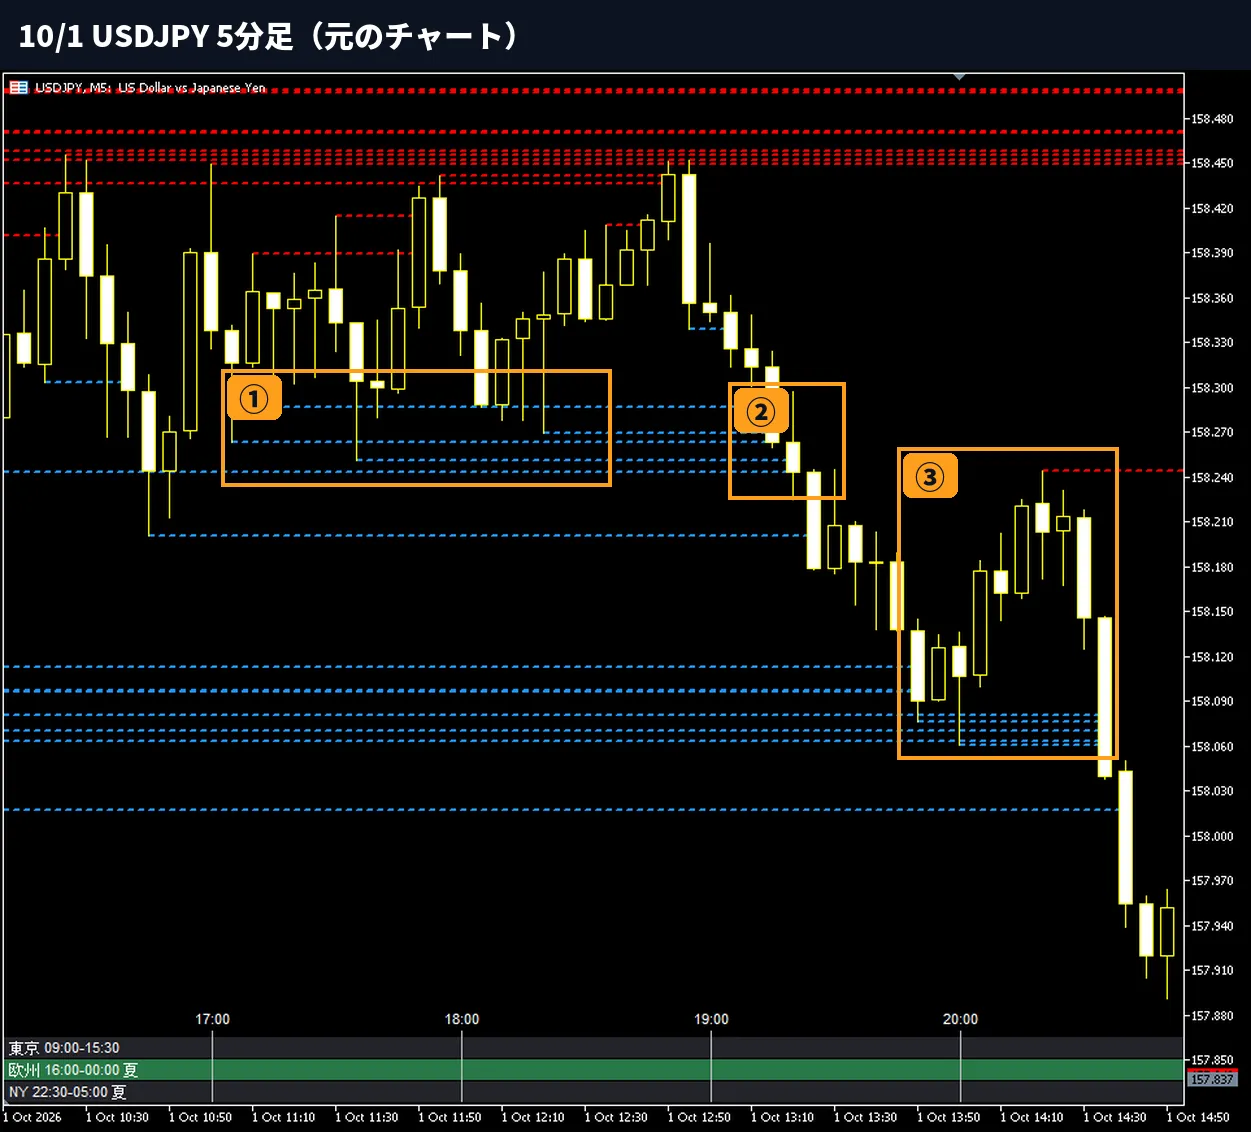
This is USDJPY 5-minute chart for October 1. Within this day’s chart, all three usage scenarios were present. We will enlarge and examine parts within the boxes ①–③ one by one later.
Usage ①: Range targeting
When the low-line area shows a price reversal
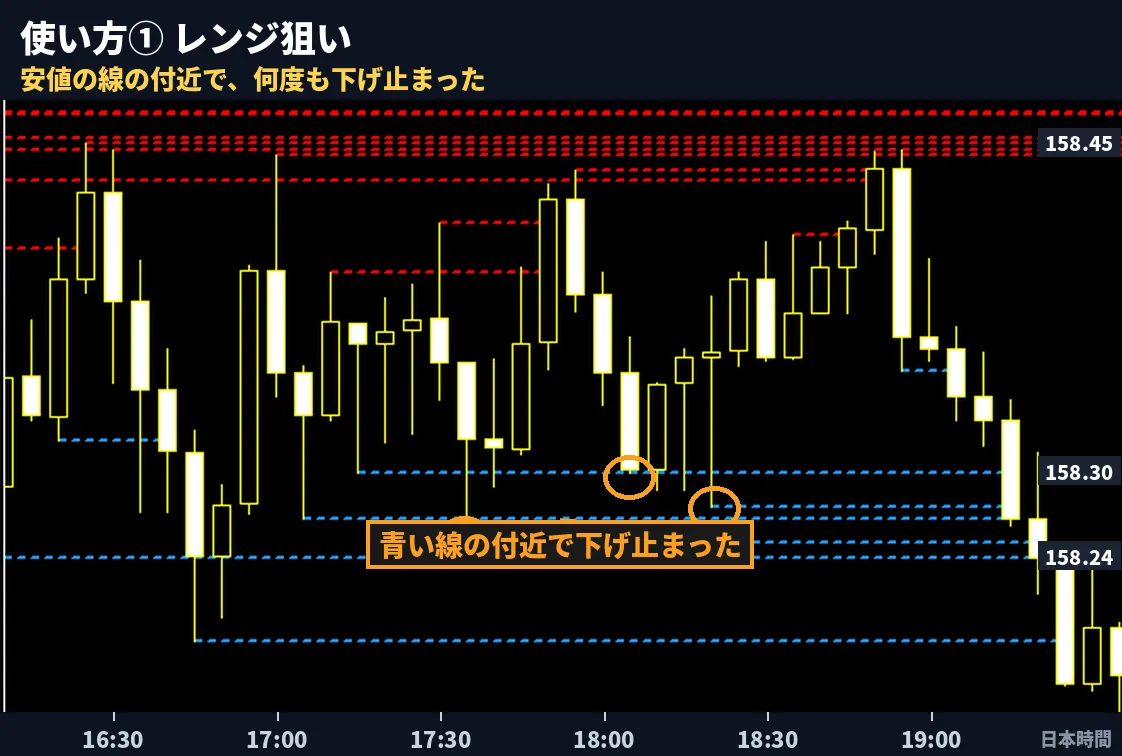
Around 17:30–18:30 on October 1, the price repeatedly fell toward the blue line near 158.25–158.30 yen, found support, and moved back up. The upper boundary is near 158.45 yen (red line), and the lower boundary is the blue line—forming a range.
There are candles that slightly crossed the line with their wicks, but the body ended above the line, so the line did not disappear and remained.
These lines appeared after 17:00. If you know where the lower end of the range is in advance, you can watch price action calmly.
Usage ②: Range breakout targeting
When the price breaks below the low line
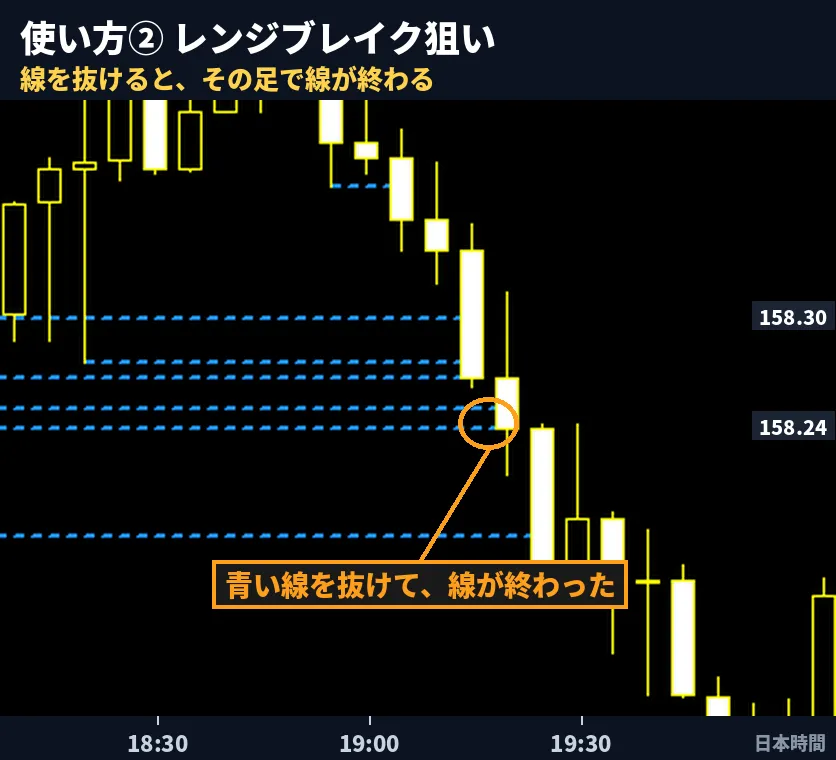
Around 19:15, the body of the candle reached the blue line near 158.24 yen, which used to be the range’s lower bound.
The line ends at the candle where the body reached it. In the next candle, price broke sharply downward.
By looking at where the line ended, you can instantly see that price has broken through.
※ When the line ends at the “body,” the line ends on the candle where the body (closing price) touches it. It may end on the candle before a large break as well.
Usage ③: After the breakout
The price that broke through becomes a resistance for further upside
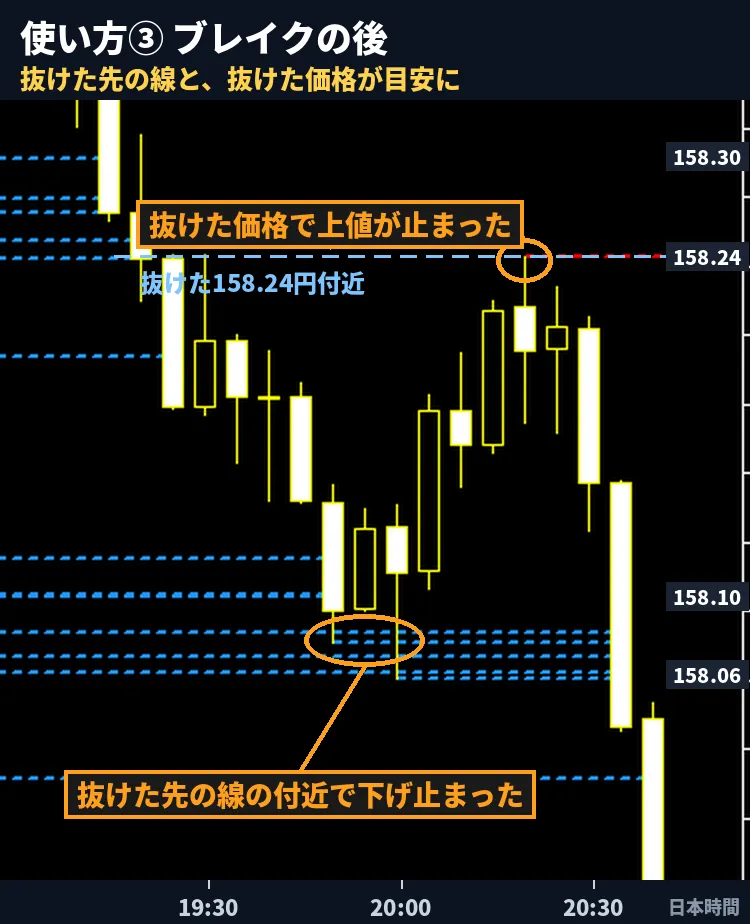
After the break below, price paused around 19:50–20:00 near the blue line around 158.06–158.10 yen, and briefly held lower.
Then, around 20:15, price retraced and found resistance near the previously broken 158.24 yen area.
The price that supported the downside can become the price that caps the upside after a break.
In English-speaking markets, this idea is called “role reversal.”
The line beyond the breakout becomes a reference for where price may stall next
※ Roles can revert and price may return without much change.
On this day too, price later broke below the line near 158.06 yen and continued downward.
Summary
These three scenarios illustrate the three uses of horizontal lines.
・Range targeting: price paused near the low line (Usage ①)
・Range breakout targeting: price broke through the line and the line ended (Usage ②)
・After the breakout: price paused above the line after the breakout and the price that broke through stopped the upside (Usage ③)
The line is not a price where price movement stops; it isan approximate reference for where price movement may changeso you can make calm judgments whether it has paused or broken through.
If you want the line drawn automatically
The lines in this article were drawn automatically with the MT5 indicator I created, “Leave-It-to-Horizontal Line.”
I made it after oversleeping and missing the chance to draw lines, causing me to enter late and incur losses.
It was released today, Saturday, October 3. The launch price is 980 yen until 23:59 on Monday, October 12.From October 13, the price will be 1,280 yen.
▼ Leave-It-to-Horizontal Line (GogoJungle)
https://www.gogojungle.co.jp/tools/indicators/86972
The basics of drawing horizontal lines are summarized in a free PDF (9 pages total).
▼ Horizontal Line Drawing Guide (Free)
https://www.gogojungle.co.jp/tools/ebooks/87242
※ This article records price movement near the lines on past charts and does not recommend any specific buying or selling.
Price movement does not necessarily stop at the line’s position.
Please make trading decisions at your own risk.
※ Leave-It-to-Horizontal Line is a product I sell.