
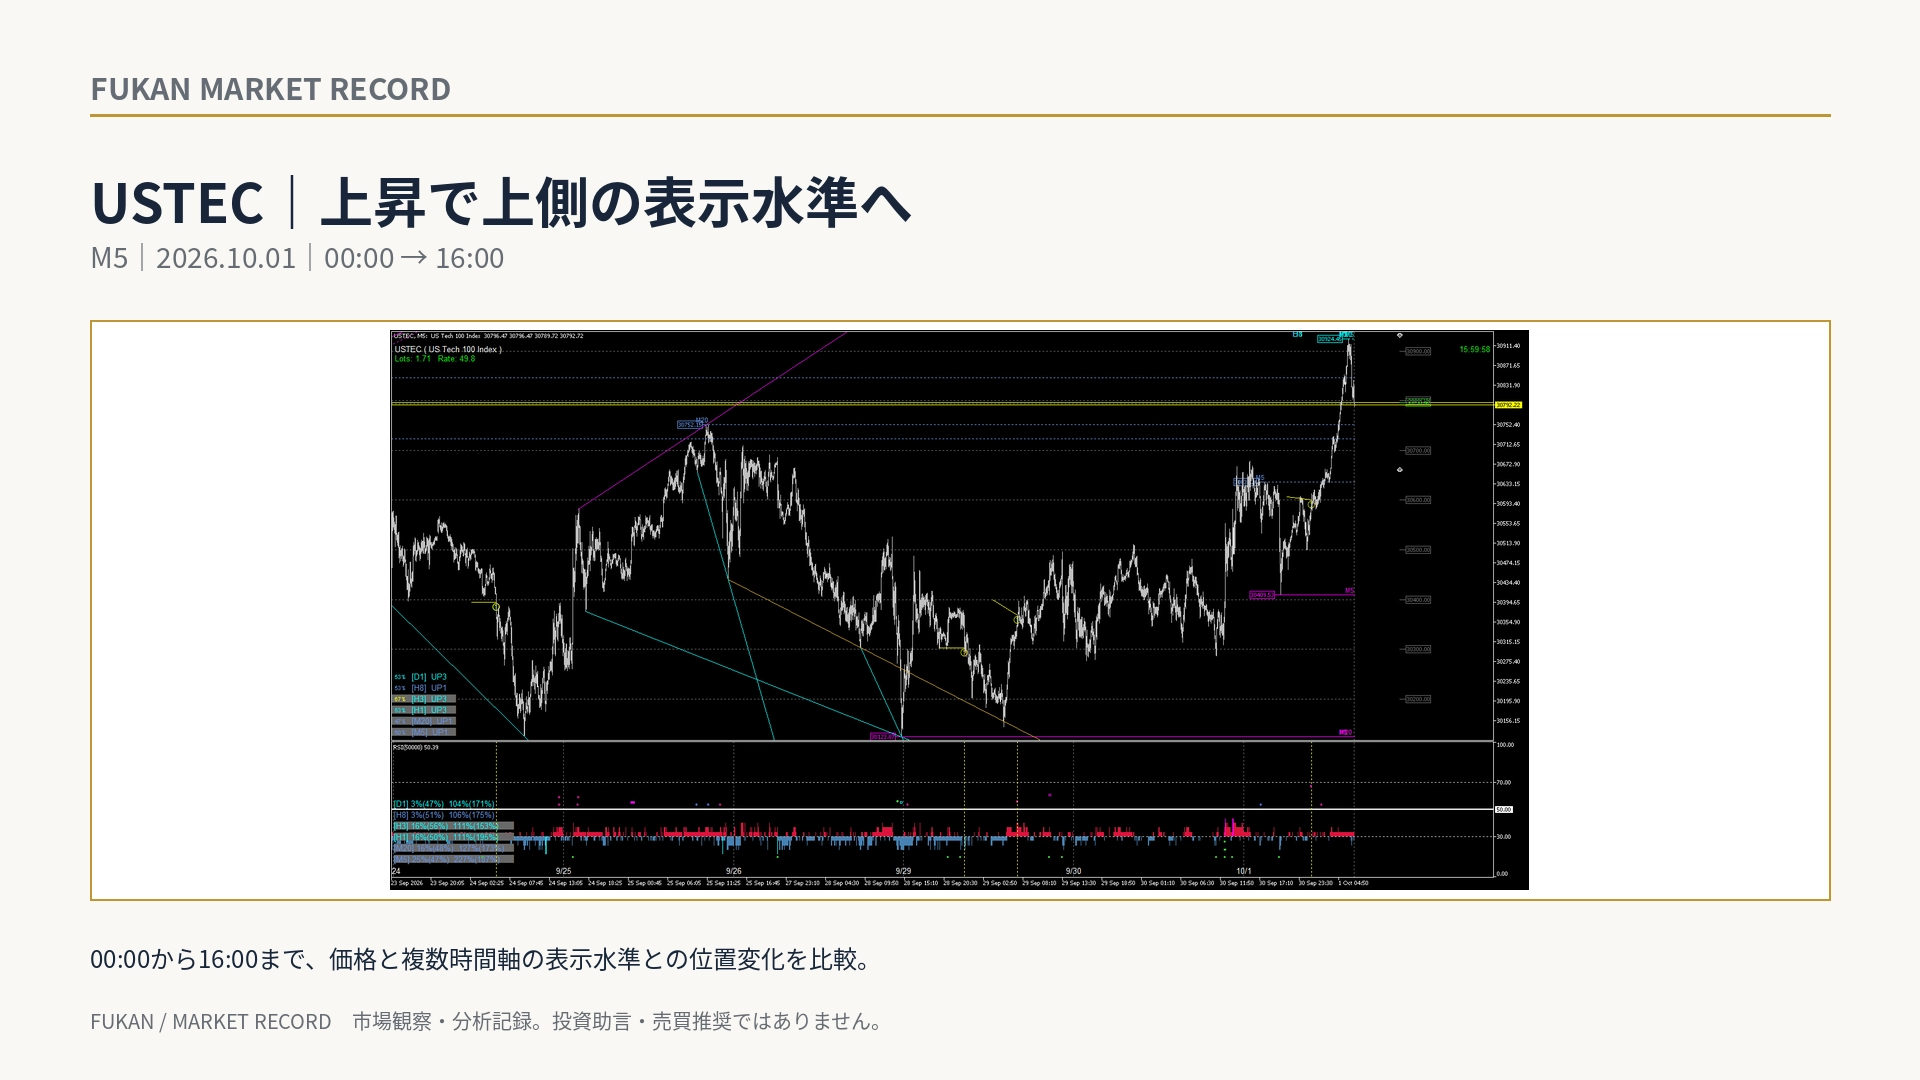
Track USTEC's rise for 16 hours — until approaching the upper display level
Tracking USTEC's Rise for 16 Hours — Until Approaching the Upper Display Level
We compare the saved FUKAN real screen of USTEC M5 on October 1, 2026 at five times: 00:00, 04:00, 08:00, 12:00, and 16:00.
This time, we follow the process of the price moving upward within a day and approaching the upper display levels derived from multiple timeframes. Instead of looking only at the final point, we line up the period from 00:00 to 16:00 under the same display conditions.
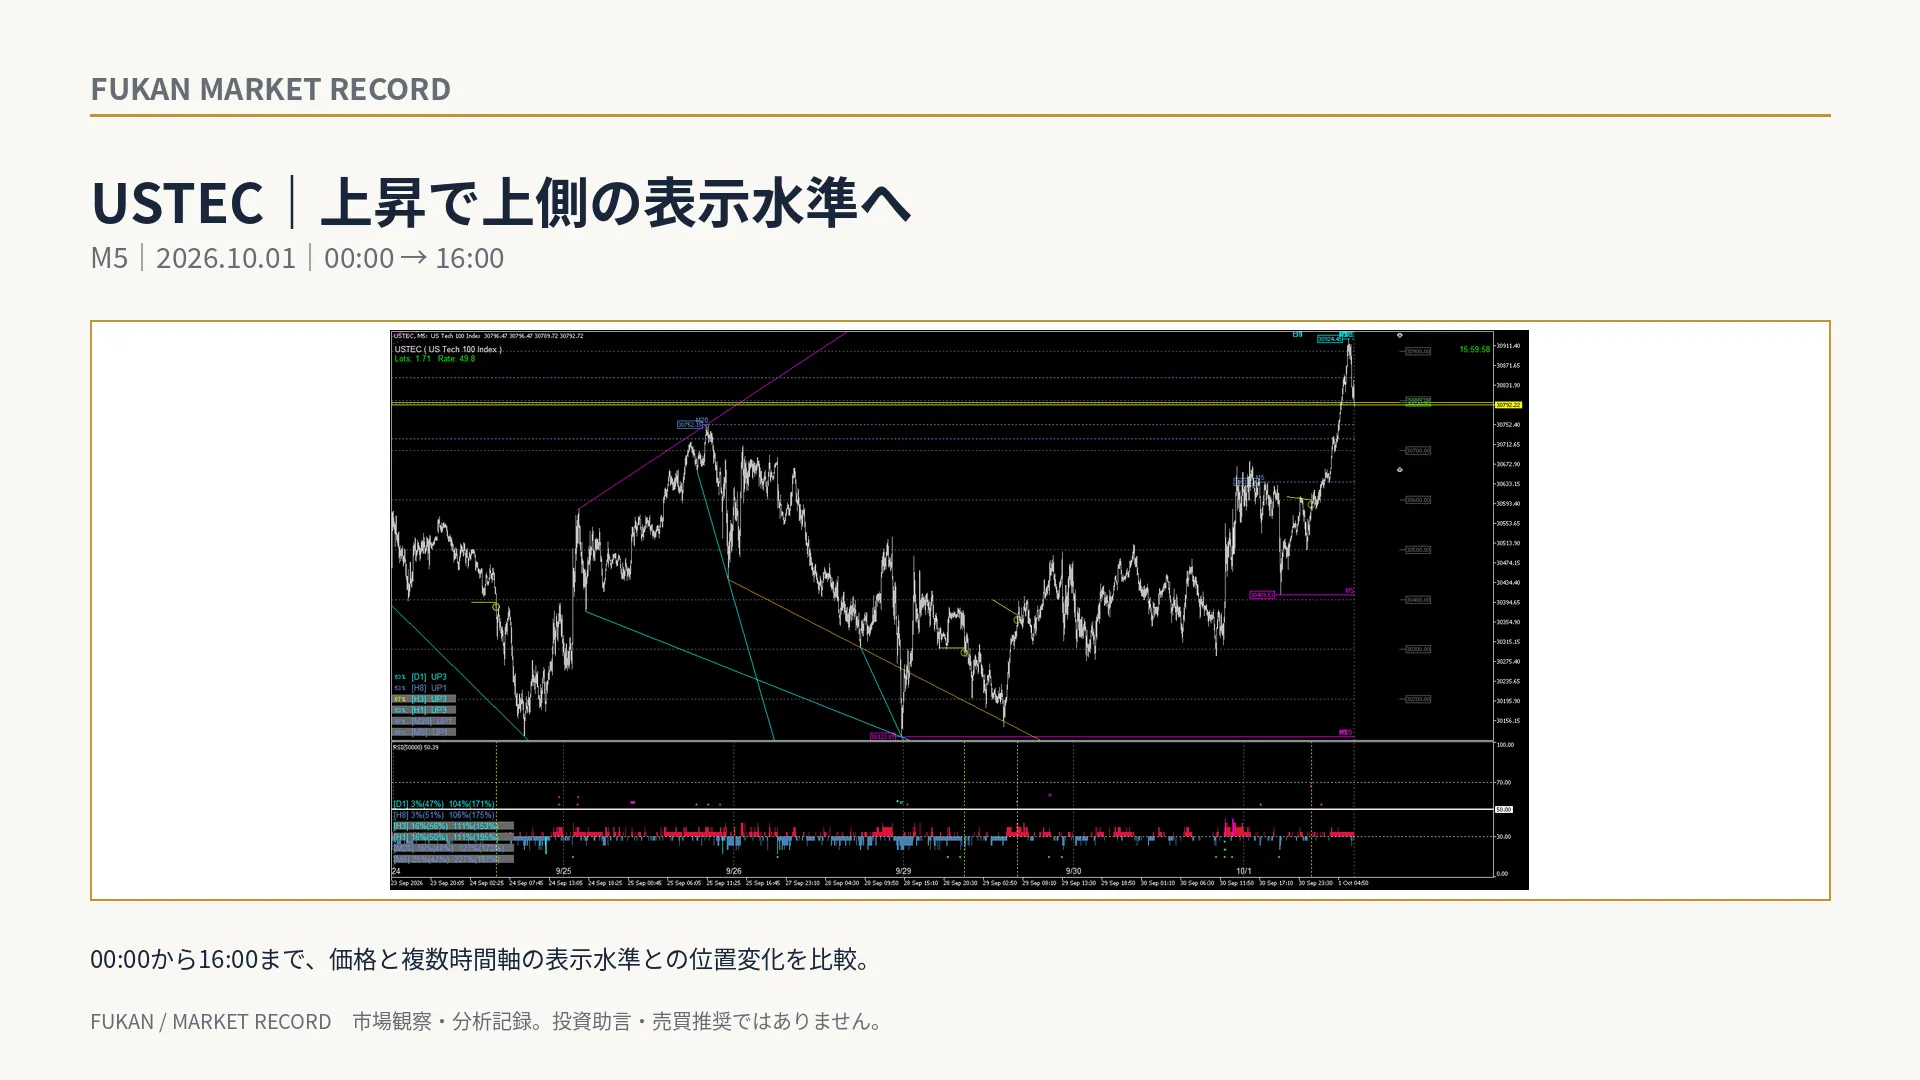
1|00:00 — Starting from within the range
In the saved image at 00:00, the price on the right edge fluctuates within the most recent movement. Above it, several display levels remain, and this position will be used as the starting point for subsequent comparisons.
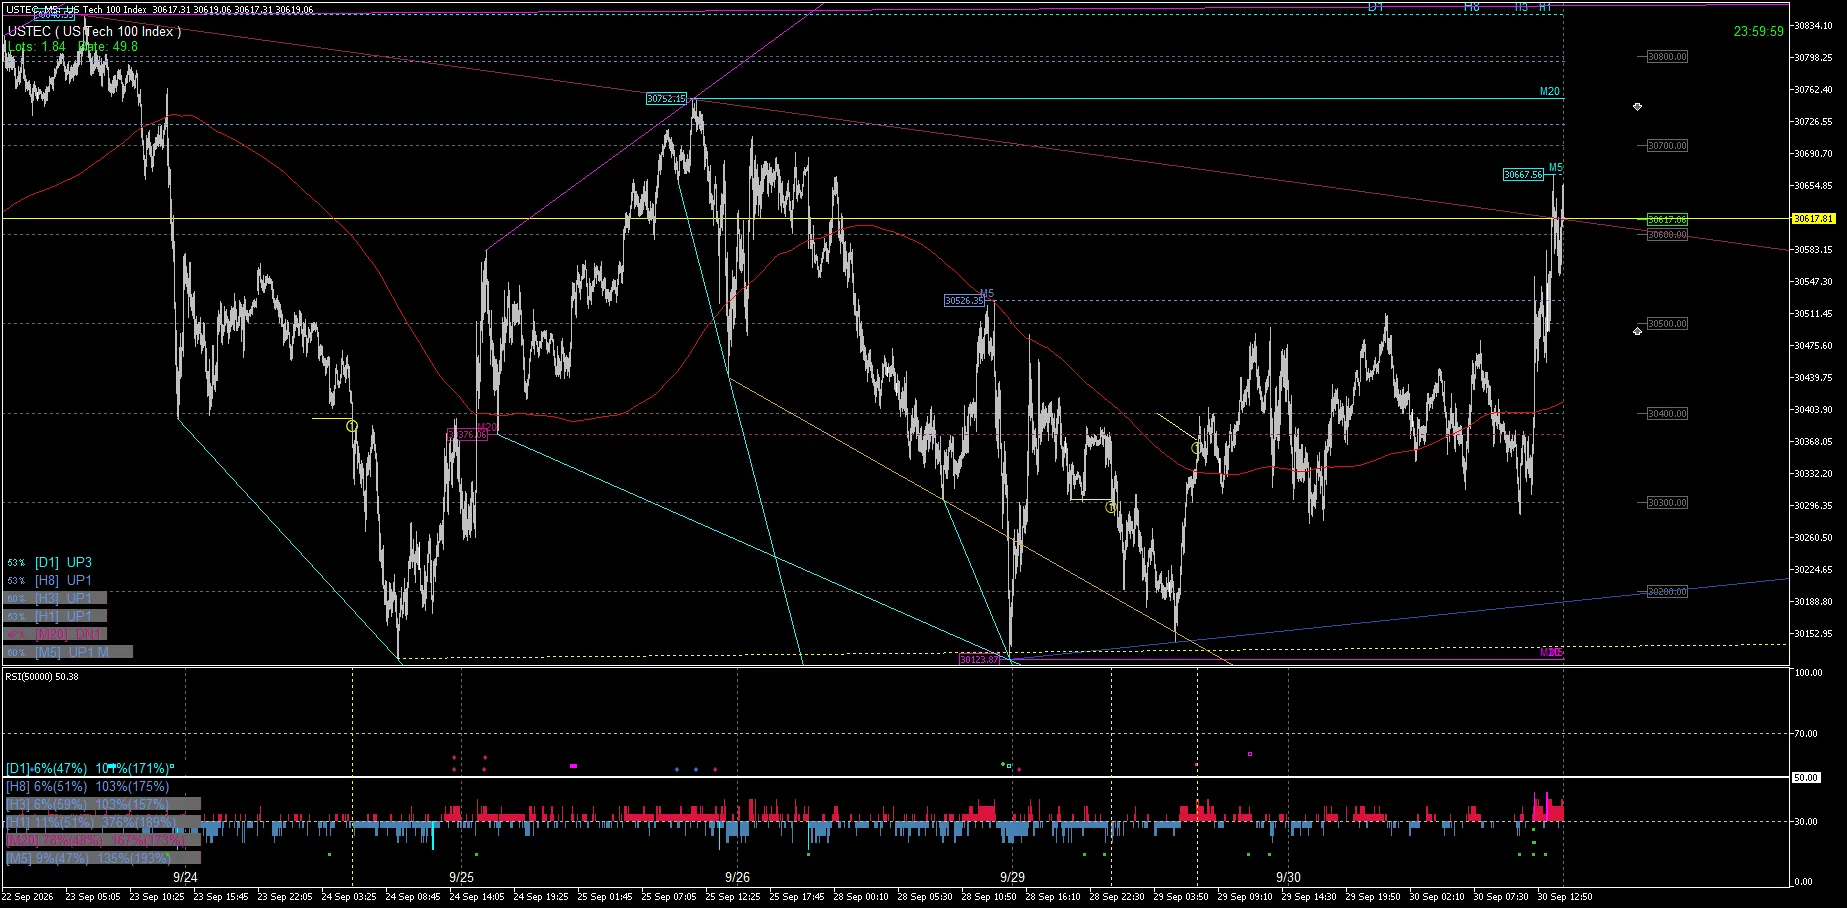
2|04:00 — Moving upward
At 04:00, the right-edge price has moved higher than at 00:00. The distance between the price and the upper line group begins to shrink.
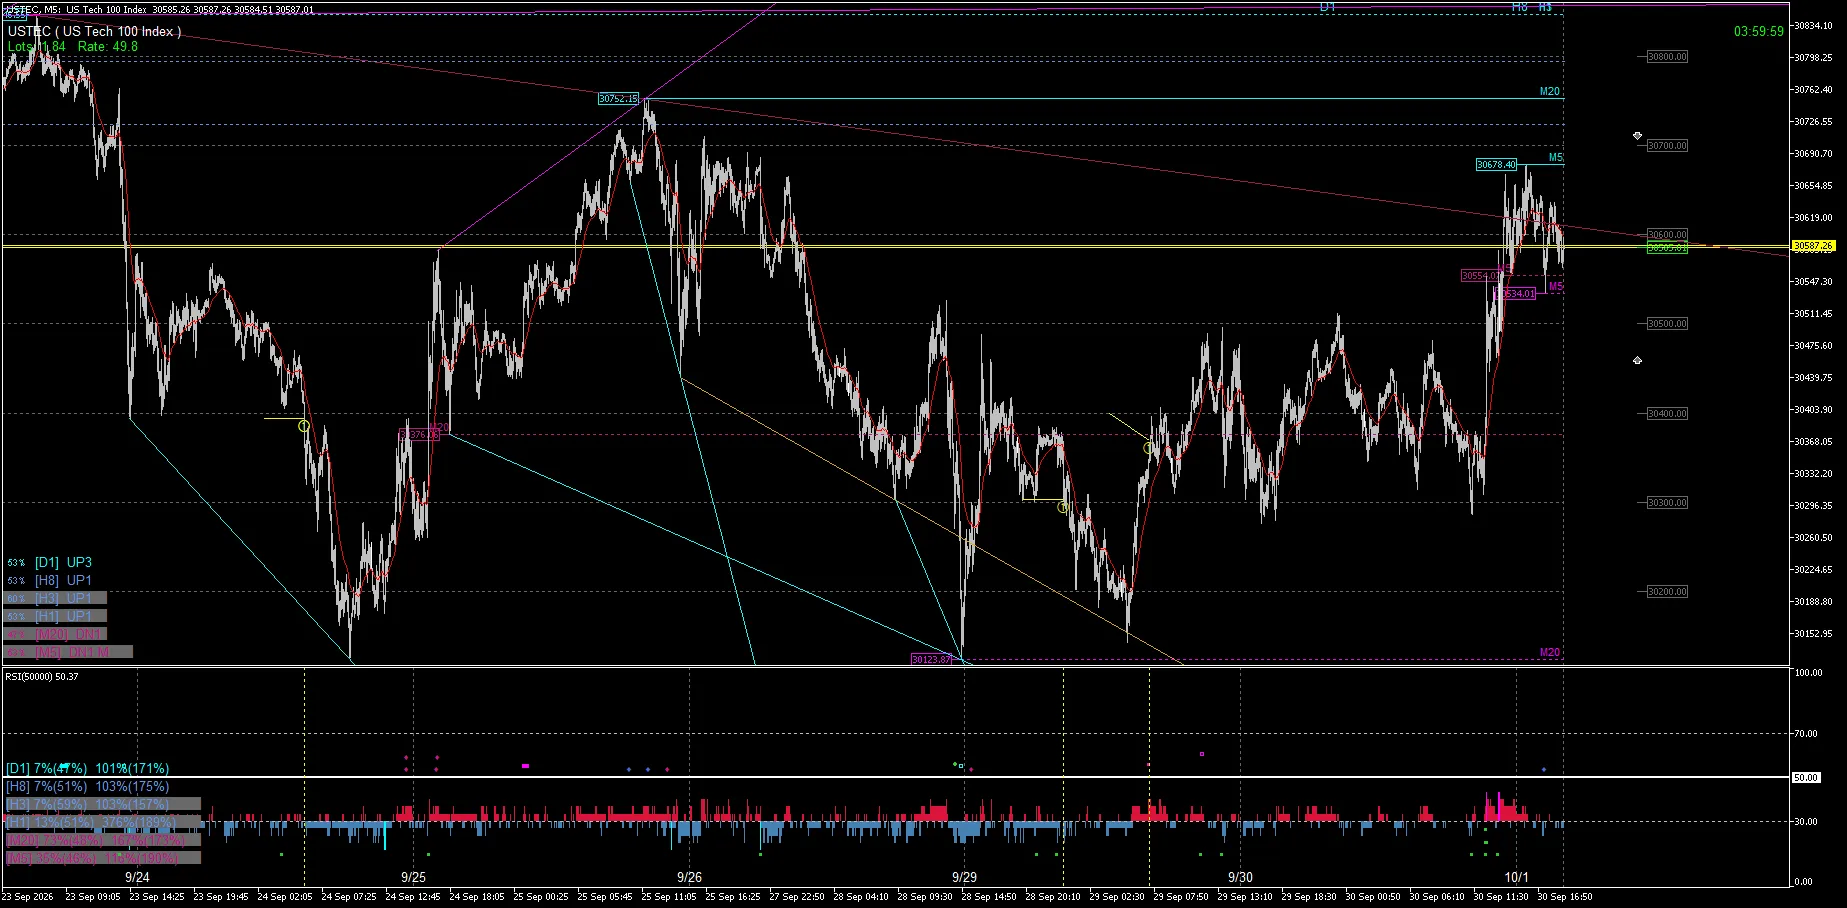
3|08:00 — Into the upper region
Movement upward continues at 08:00 as well, and the right-edge price progresses toward the vicinity of the upper display levels.
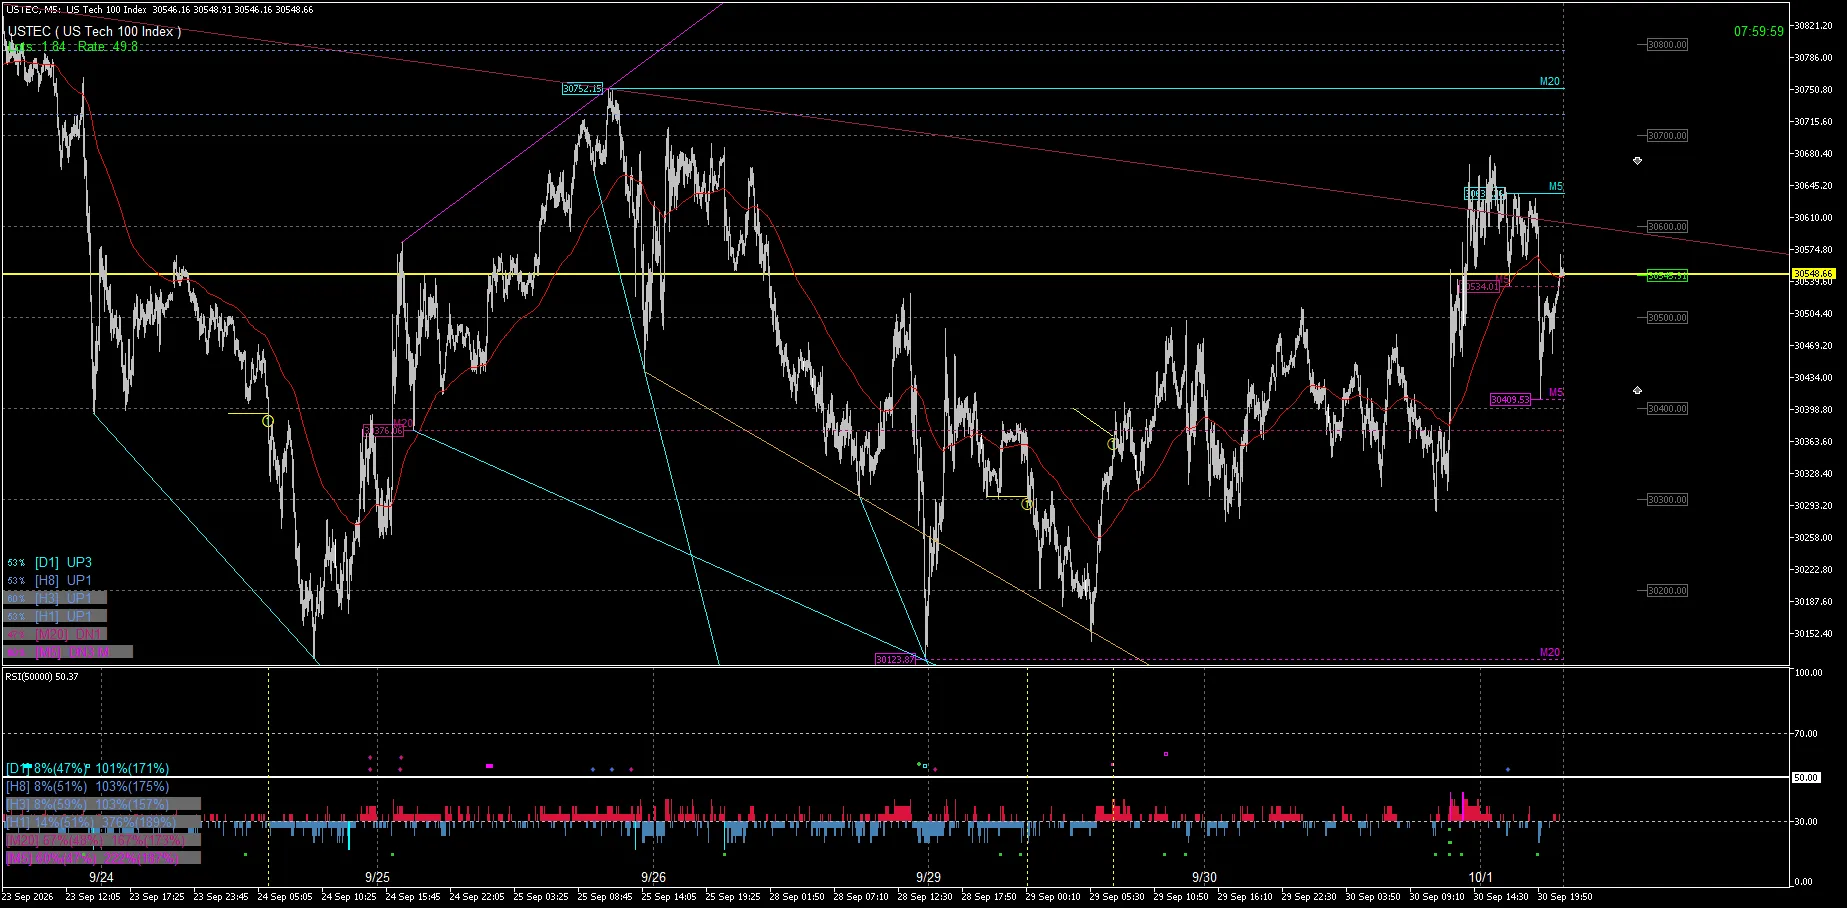
4|12:00 — Trading in the high zone
By 12:00, you can observe a tendency to trade in the high-price zone. Viewing in chronological order from 00:00 shows that it's not just a single rise, but the positional relationship with the upper display levels changes in stages.
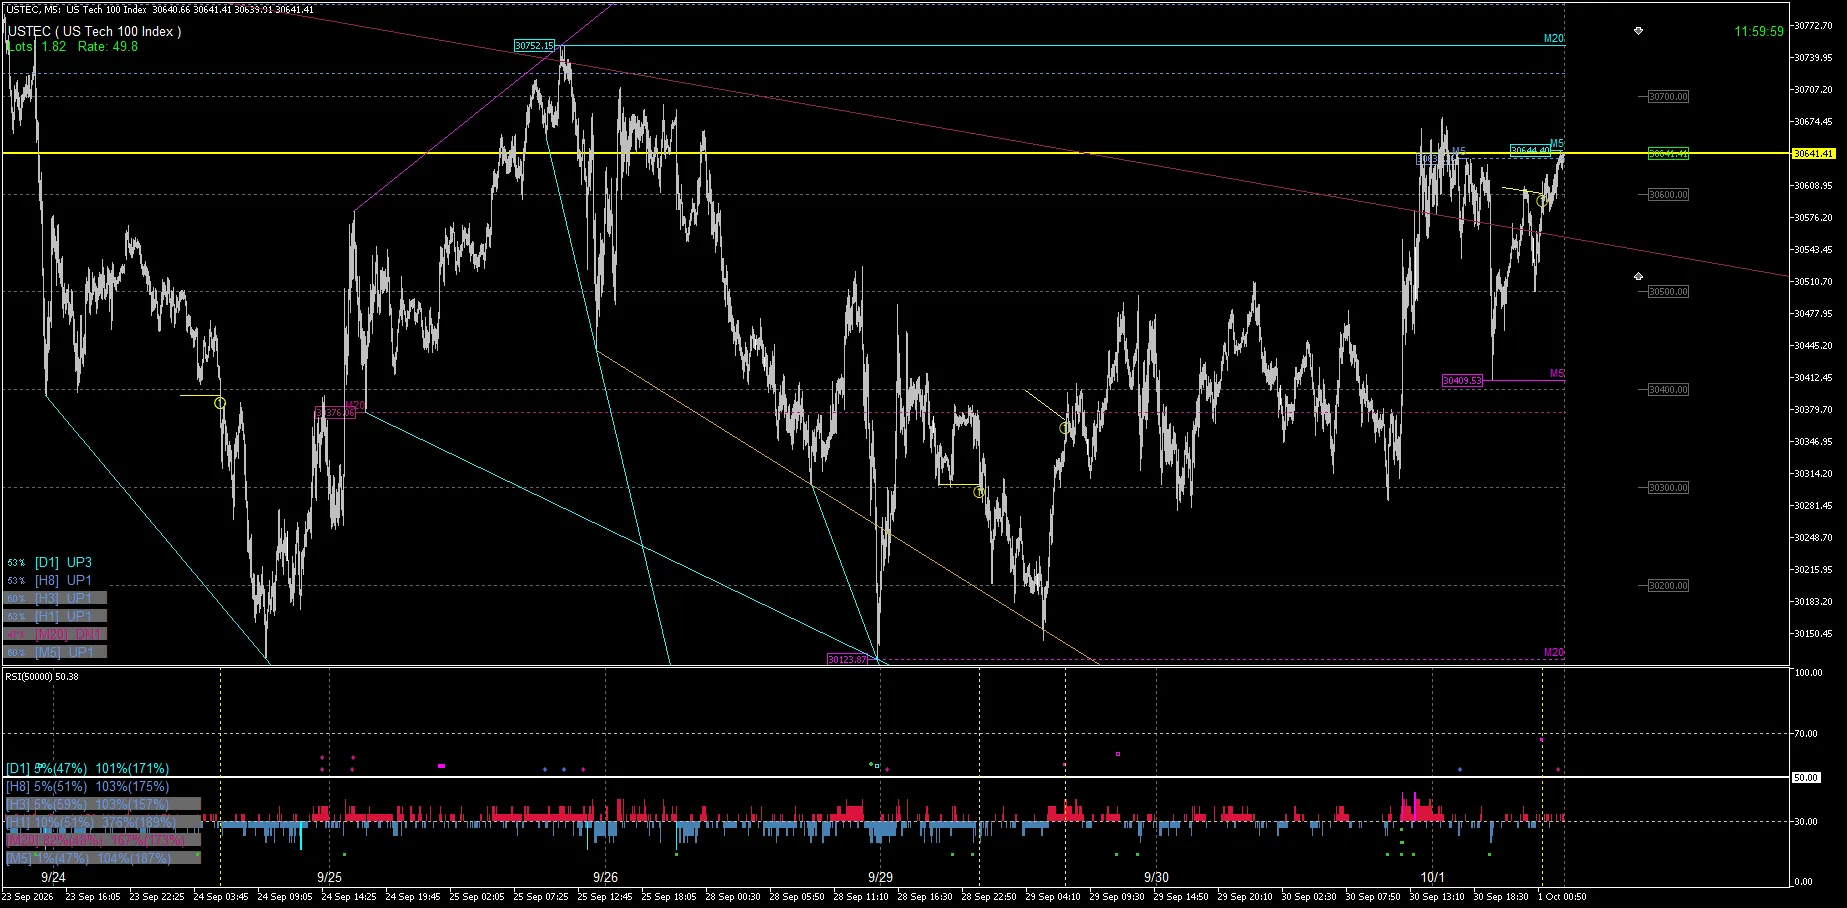
5|16:00 — Near the upper display level
By 16:00, the right-edge price reaches near the upper display level. What matters here is not deciding “what happens next because of this level,” but recording how far the price actually moved.
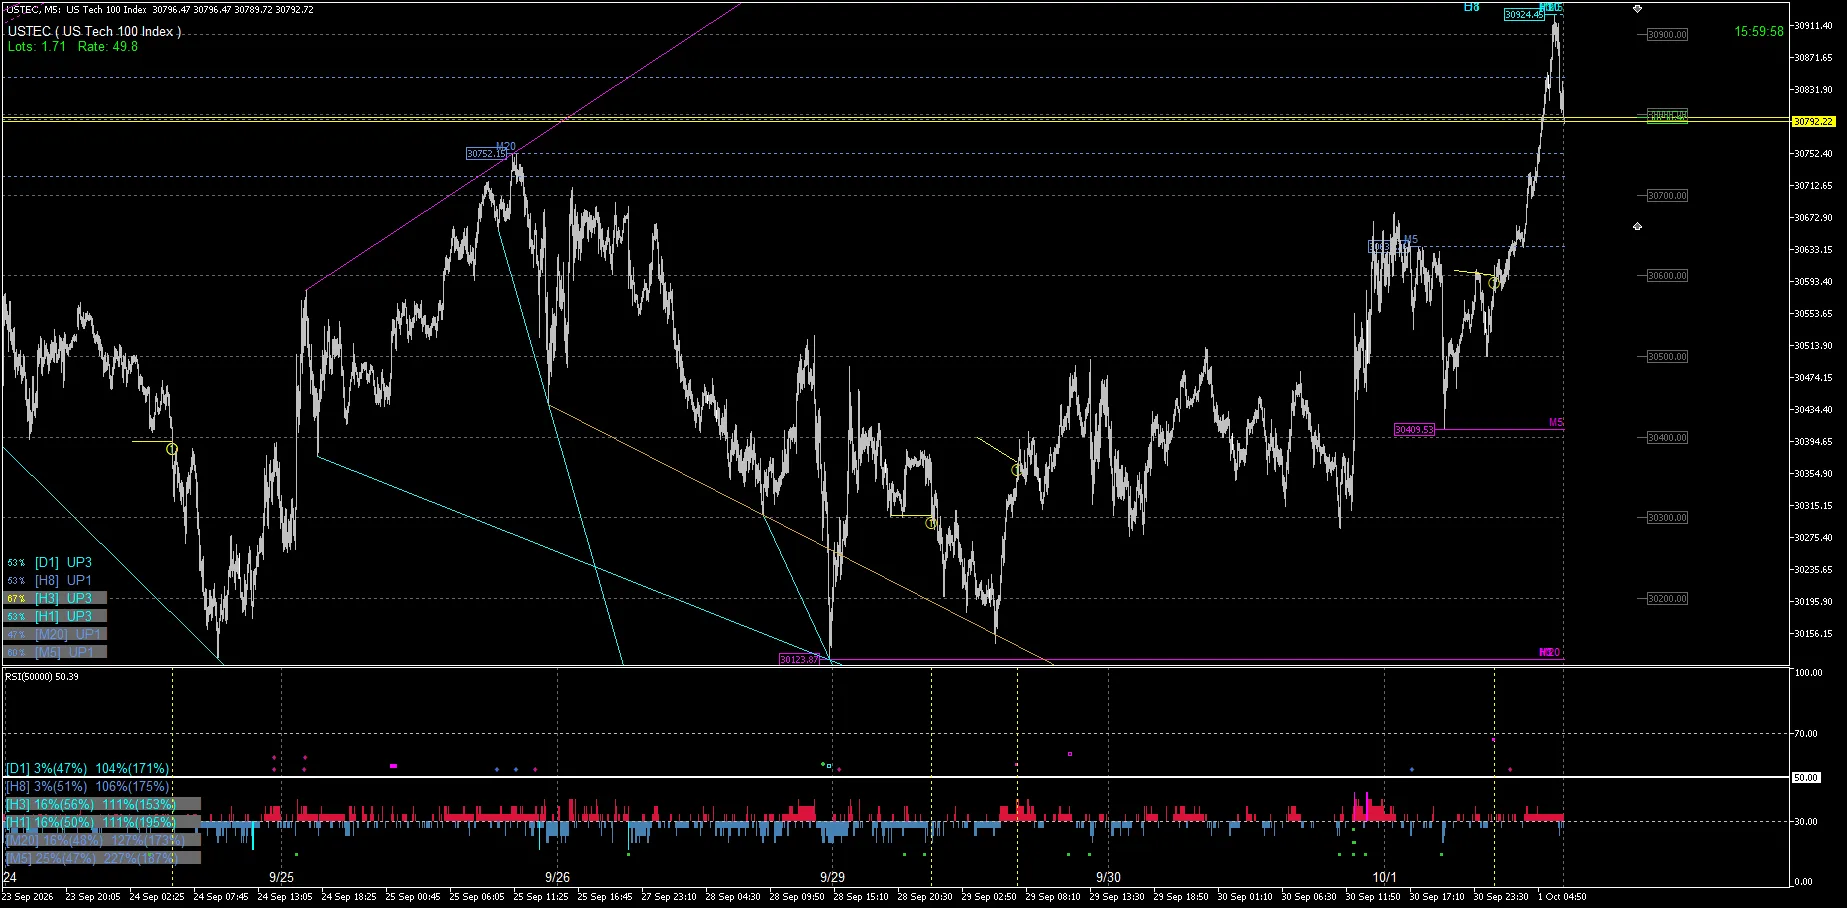
What we observe in FUKAN
In FUKAN, we organize on one screen the market structure shown across multiple timeframes and the current price position, not just M5 movements.
In this USTEC example, you can confirm the upward movement from 00:00 and that the distance to the upper display level narrows over time. The goal of Market Record is not only whether it reacted, but also to preserve “how far it reached” to that level.
Summary
On October 1 for USTEC, the price moved upward from 00:00 to 16:00 and reached near the upper display level.
From these five points alone, you cannot determine statistical superiority of a specific line or future price action. We will continue to record proximity, reaction, breakout, no reaction, and subsequent developments in the same manner.
FUKAN offers a 7-day trial. After checking the display, operations, and calculation times in a real MT5 environment, you can decide whether to continue use.
This article is market observation and analytical record, not investment advice or trading recommendation. It does not guarantee future price movements, profits, or win rates. The times shown use the times recorded in the original image.