
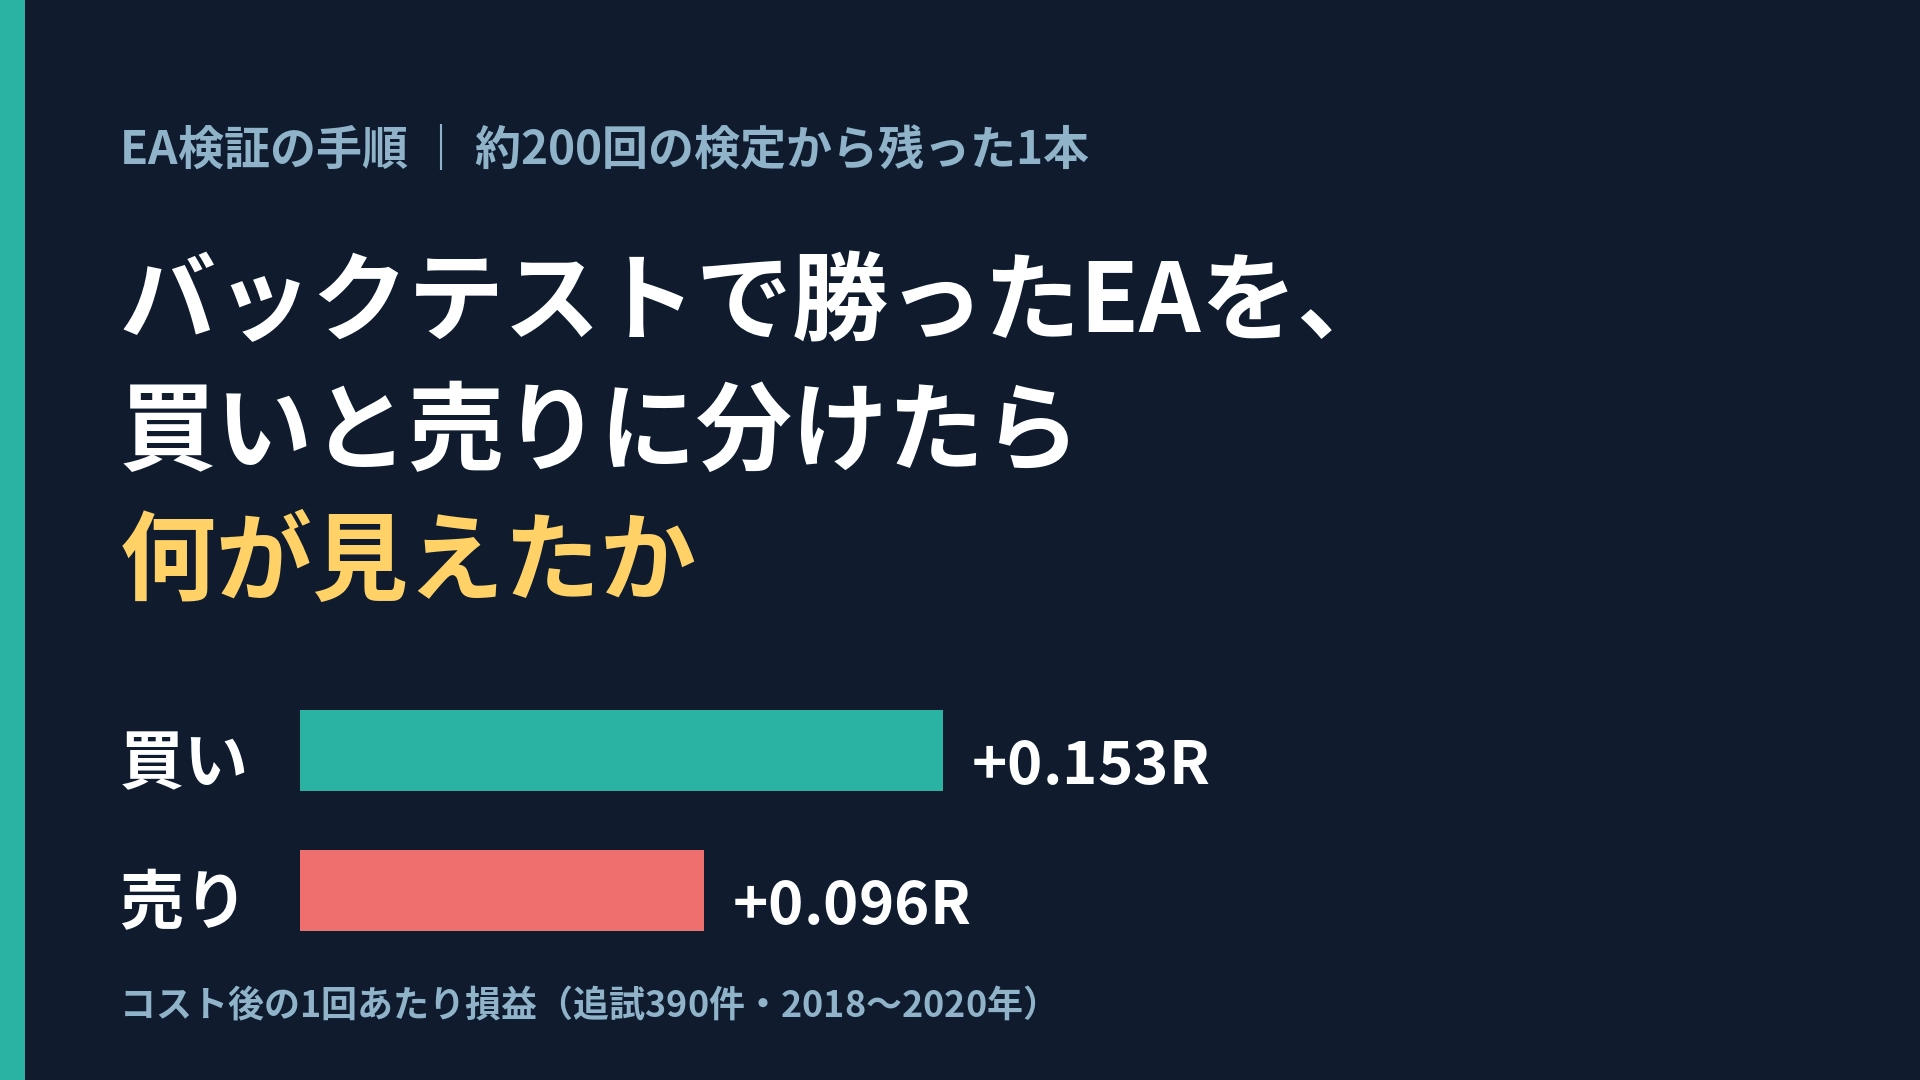
What did we see when we split the profitable Expert Advisors in backtests into buys and sells?
In half a year, I created about 40 EAs, conducted around 200 tests, and only one rule remained after all trials. Overall, I am winning. However, if you divide the EAs that show profit into buy and sell, you can roughly see one of the following three patterns.
- Only one side is profitable: It was not the power of the rule itself, but simply measuring the overall upward (or downward) move of the market
- Both sides are profitable: There is a possibility that the rule itself has strength
- A form that would make things even better: However, once found, it becomes a trap immediately
What did my single rule reveal? I will describe the procedures I followed to reach that point (how many attempts I made, and retesting during periods no one watched) together with actual numbers. This is not a sale or recommendation of an EA, but a sharing of a methodology to doubt one’s own EA.
Assumptions for Validation
Before reading the numbers, I fixed what and how I measured. In each test I performed,before calculating profit and lossI documented the conditions and passing threshold, and hashed them to lock in.
| Item | Condition |
|---|---|
| Rule (K2) | If the high/low of the previous 6 days is penetrated by the close, enter in that direction. Close in 24 hours, stop loss 3 ATR, no take profit |
| Target instruments | BTCUSD / ETHUSD / BTCETH / ZECUSD (chose based on cost relative to price range before assessing profits) |
| Time frame | 30-minute chart (retests use 4-hour chart) |
| Learning period | 〜June 2023 |
| Validation period | July 2023〜September 2026 |
| Retest period (period no one observed) | May 2017〜June 2020 (actual trading from March 2018) |
| Data | Tick data from my MT5 account |
| Costs | Projected based on current round-trip spread by price proportion, and swap recorded only on the payer side every night (including weekends) |
| Unit | R (one stop-loss width equals 1) |
There are two key points. First, the cost should be accounted for from the exploration stage, not after the fact. Second, the period used for retesting should never be opened until the rule is fixed.
Step 1: When you test a large number, profit can be “manufactured”
When testing 200 rules at a significance level of 5%, even if there is no edge, about 10 rules will be judged as significantly profitable. This is the trap of multiple comparisons.
Expected number of false profits = number of tests × significance level = 200 × 0.05 = 10
Trying to optimize EA parameters by varying them follows the same logic. The more combinations you increase, the more random profitable combinations surface as the “optimum.”
I take three countermeasures:
- Tighten the criterion by testing many at once: If testing four at the same time, the passing threshold becomes 0.05 ÷ 4 = 0.0125 (Bonferroni correction)
- Compare with a random baseline: Compare to a control where the buy/sell directions are randomized, or the same time’s different day control (4,000 trials each) to see if you can beat them
- Set the passing lines to 4–12 items, and don’t adopt unless all pass: Consider count, post-cost average, margin against cost (post-cost average ≥ spread × 3), maximum drawdown, etc.
K2 (breaking through 6 days) was one of the four crypto assets tested simultaneously. The results during the validation period are as follows.
| Item | Value |
|---|---|
| Number of cases | 1,208 (about 31 per month) |
| Pre-cost average | +0.219R |
| Cost | 0.081R |
| Post-cost average | +0.124R |
| PF (95% interval) | 1.20 (1.04–1.41) |
| Direction random control | p = 0.0002 |
| Same time different day control | p = 0.0001 |
| Maximum drawdown | 37.5R |
The random results clearly show profit. Yet, the assessment wasFailure. The post-cost average (+0.124R) did not reach the “spread × 3” (0.242R), and the maximum drawdown exceeded the 30R limit. Moreover, because the error in the cost calculation was corrected after assessing profit and loss, this number itself had to be discounted. Therefore next, I tested in a period where no one was watching.
Step 2: Retest in a period no one watched, split into buy and sell, and break it apart
K2, even using data from 2018–2020 that had never been used before, showed the same direction and magnitude of edge. Among about 200 tests, this was the first rule that passed through retests in independent periods. Before collecting data, I fixed the passing criterion (at least 100 cases, post-cost positive, PF > 1, two controls with p < 0.05).
| Item | Retest results (4-hour chart, 2018–2020) |
|---|---|
| Cases | 390 |
| Pre-cost / Post-cost averages | +0.154R / +0.125R |
| PF / Win rate | 1.49 / 45.9% |
| Max drawdown | 9.7R |
| Direction random control / Different day control | p = 0.003 / p = 0.001 |
| By year (post-cost) | 2018 +0.168R / 2019 +0.159R / 2020 +0.050R |
Even then, the rules that show overall profit often come from “one side only.” In fact, a rule found in US equities that showed profit only on the buying side was merely measuring stock price advances, not the strength of the method. Therefore I split the 390 retests into direction-specific groups without changing the decision criteria.
| Direction | Cases | Pre-cost | Post-cost | Win rate |
|---|---|---|---|---|
| Overall | 390 | +0.154R | +0.125R | 45.9% |
| Buy | 203 | +0.183R | +0.153R | 46.8% |
| Sell | 187 | +0.122R | +0.096R | 44.9% |
Selling was also positive. It is not the case that only one side profits.During the big drop of BTC in 2018, selling (+0.233R) outperformed buying (+0.066R). It was not simply measuring a rising market.
The axis of decomposition is not only buy/sell direction. If you split by instrument, year, and time of day, you can see where profits come from. For K2, ZECUSD was nearly zero after costs (−0.018R). However, I did not exclude ZEC here because that would mean choosing instruments after seeing the results.
Step 3: Do not add the found pattern to the rule; verify it with future data
When you decompose, you inevitably find a form that would make things even better. That is the “3” mentioned at the top. In K2, only entering in the same direction as BTC’s flow of the previous 30 days was profitable.
| Compared to the flow of the previous 30 days | Cases | Post-cost average |
|---|---|---|
| Entered in the same direction | 250 | +0.221R |
| Entered in the opposite direction | 140 | −0.046R |
If you add a filter to take only the forward direction, you end up searching with the same data and evaluating with the same data, returning to the trap of Step 1. Moreover, this number could not be reproduced once. The initial tally was “same direction +0.190R / opposite direction +0.026R,” but when the definition was made explicit and recalculated, it yielded the values in the table above, and with another straightforward definition, opposite direction was −0.05 to −0.08R.That numbers moving with definitions themselves demonstrates the unreliability of this form.
Therefore I kept the current rule unchanged and handled it as follows.
- Fix one definition, and document and lock in a weighting that slightly increases the forward direction and suppresses the reverse direction
- Keep the original rule intact and perform a virtual buy/sell (observation without placing orders) while computing the weighted version on the side
- Decision only once. With 840 cases or the earliest date of 2029-09-30, perform a weekly bootstrap to test that one side p < 0.05
- Even if it looks good midway, do not adopt it
If you simulate the power of detecting this decision, the effect was 71–79% the same as in the development data. In other words, even if it were real, about one out of four times it would end with “could not be confirmed.” Knowing this in advance is also part of the validation.
The original rule itself also requires passing the “PF above 1.0 within the first 30 virtual trades before actual money is put in.” The future data is a one-time ticket. If you adjust the rule after seeing the results, that period becomes the “explored period.”
What happened in real operation: Of 65 lines, none were alive
In June 2026, before implementing this procedure, I did a full inventory of all live EAs. I evaluated actual executions (cost-included P/L in currency terms), splitting by magic number and instrument into “lines.”
| Assessment | Criterion | Number of lines |
|---|---|---|
| Alive | Total positive PF ≥ 1.1, at least 15 cases | 0 |
| Fragile | Total is ≥0 but below the above conditions, or spreads eat at least 25% of average profit | 48 |
| Dead | Total negative | 17 |
Of 65 lines, 61 had fewer than 30 cases, so there was not enough data to judge wins or losses. Increasing the number of lines might make it look like some were profitable, but that is the same structure as Step 1.
Another flaw when looking only at win rate: for one line of XAUUSD (22 cases), the average lot size of losing trades (0.032) was about 3.2 times that of winning trades (0.01).That is, even with the correct direction, if you blow up the lot size on losses, you won’t survive.
A Verification Checklist Usable for Your Own EAs
This checklist can be used for both EAs you are considering purchasing and ones you have built yourself.
- □ Record the total number of rules and parameters tested (including those not adopted)
- □ Subtract spreads, fees, and slippage from the exploration stage
- □ Post-cost average should be several times the spread (my passing line is 3x)
- □ Are the number of trades sufficient for judgment (if few, mark as “pending”)
- □ Do profits not favor one direction when split by buy/sell, time of day, or year
- □ Do losing trades’ lot sizes not exceed winning trades
- □ After decomposing, have you not added the found pattern to the rule on the spot
- □ After finalizing the rule, reserve a period opened only once (OOS)
Summary: When Split, Patterns 2 and 3 Emerged
To answer the initial question: dividing my single rule into buy and sell revealed patterns 2 and 3.
| Three patterns at the start | Did you see it | Details (post-cost) |
|---|---|---|
| 1. Only one side is profitable | Not seen | Sell side also +0.096R. In the 2018 downtrend, selling earned more |
| 2. Both sides are profitable | Seen | Buy +0.153R / Sell +0.096R |
| 3. A form that could be better | Seen | Flow of 30 days in the same direction +0.221R / opposite direction −0.046R |
What was split and seen is not the answer but a hypothesis to test next.Please try dividing your own EA into buy and sell as well. If you see 1, be cautious; if you see 3, pause before adding anything.
Disclaimer: This article introduces validation methods and is not intended to endorse any particular EA, instrument, or trading activity. Past validation results do not guarantee future performance. Please make investment decisions at your own risk.