
Daily Nikkei 225: 2026/10/1
Detailed analysis tool link
We have earnestly received high ratings.
■ New development performance + indicator DAVID (David)
https://www.gogojungle.co.jp/tools/indicators/73936?via=users_products
■ Superb trendline drawing indicator “Sword of Unmatched Skill”
https://www.gogojungle.co.jp/tools/indicators/54499?via=users_products
■ Indicator pack MT4/5 version, monthly subscription
“Unrivaled” Synchronization System
https://www.gogojungle.co.jp/tools/indicators/50319
“David” Synchronization System
https://www.gogojungle.co.jp/tools/indicators/73939?via=users_products
Trial version・Ultimate・Synchronization System Monthly
https://www.gogojungle.co.jp/tools/ebooks/50353
Below: Current analysis article
One-line comment: signals of potential rebound
Daily chart:MAX Oscillator: Synchronization Band“Strong rise””
4-hour chart“Neutral””Indication suggesting
Weekly chart “Weak rise” Indication suggesting
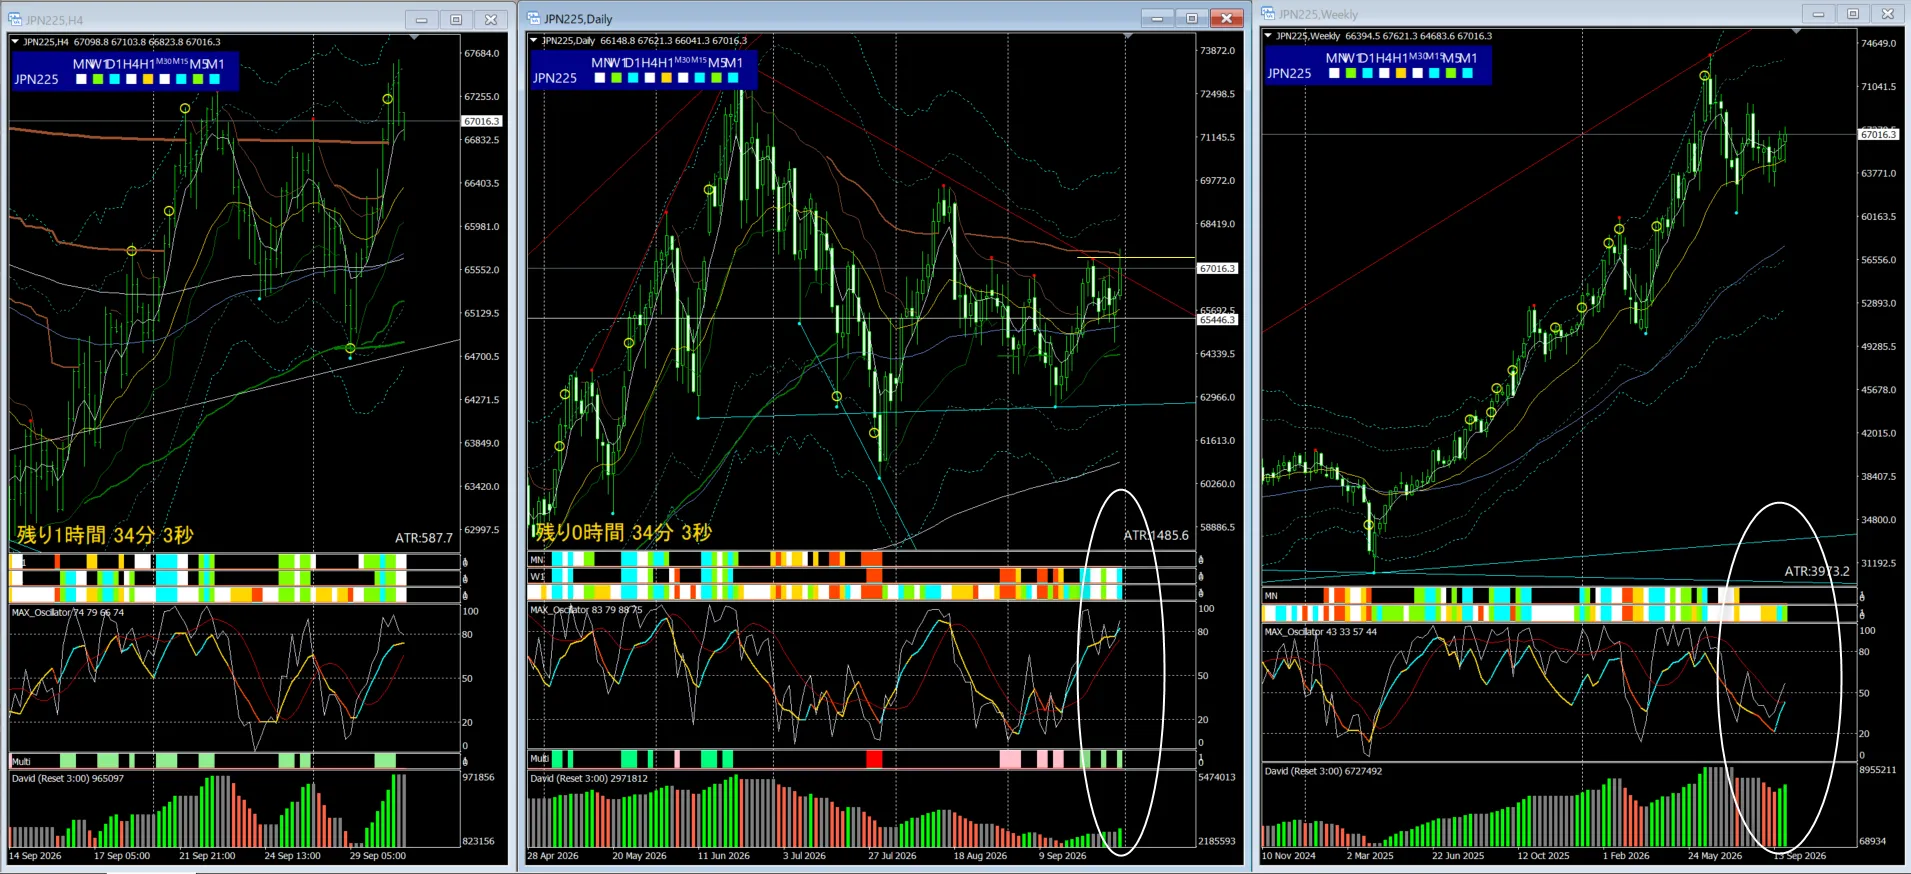
※ Signs of rebound
Daily chart up signal lit・Weekly chart up signal lit
In the shape that breaks above the daily trendline, highs and lows show Williams%R? (Dow theory high-low made higher)
Whether it will continue remains, but
it might be reasonable to view as an upward trend?
Volatility can be very rough depending on the time of day
If you think it's dangerous, it's better to bail out quickly, and risk management is
still required to be cautious.
Do not ignore near-term moves; maintain a flexible attitude to short-term waves
Be careful of sudden, drastic changes!
※ Important Notes
Volatility is considerable, so pay close attention to capital management.
Important Notes
Original indicator analysis commentin current stateand
does not constitute buy/sell recommendations or guarantees of future movements.