

[Shock] The previously unseen “buying pressure vs selling pressure” has become visible

Hello, I’m Lucky.
Today’s release, the latest work [Kyokugan]
This time, what I wanted to show you is
a slightly different “world within the market”
Behind the charts,
buyers and sellers are constantly clashing.
Will the buying force push up
or will the selling force push back
which side is getting stronger
which momentum is weakening
as if,
Buying force VS Selling force
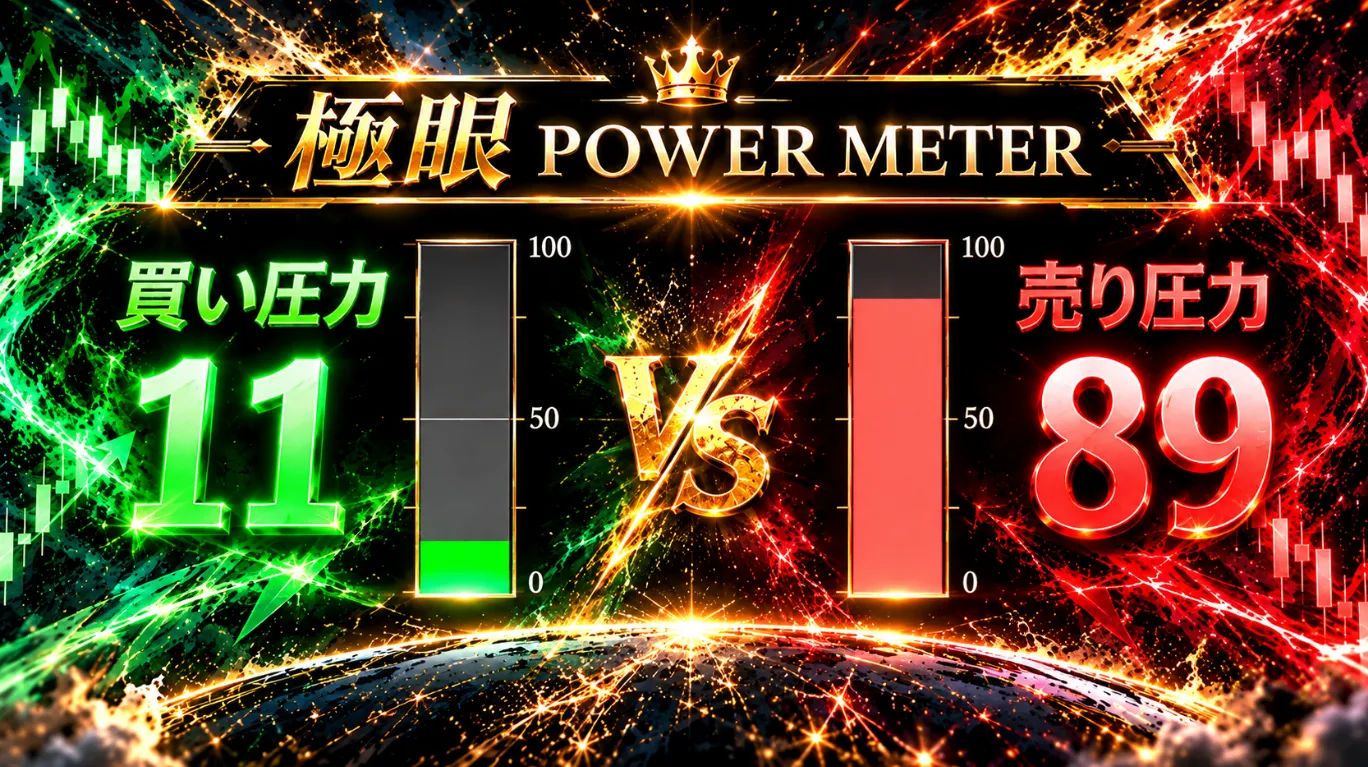
It feels like watching that clash of power
From a world that used to look only at candlesticks,
look also at the changes in the underlying power dynamics.
When I completed it,
I thought,
“I’ve released something interesting into the world……”
I laughed.So,
Please tell me someone, “You made this well! Amazing!”
…and then,
it actually happened (laughs)
Moreover,
from an 81-year-old active trader
a person who has faced the markets for many years sent such a happy DM.
The moment I read it,
“Ah, I’m glad I published this.”
I was touched.
That message is here.
⇩⇩⇩
Lucky-sensei Good morning. I read it this morning. The counter information you disclose thanks to your generosity is wonderful. I think the power relationship between buyers and sellers is an important point on the chart (candlesticks). In other words, to find a favorable wave, the background is the power relationship between buyers and sellers.
With various indicator information, there is a tendency to become confused and the criteria for entry and exit decisions become fuzzy. Ultimately, this counter information is the key. I view the buyer-seller power relationship with the following points, and if there is something that can be visualized, it would be easier to understand.
In any case, it is excellent information disclosure. Thank you
Receiving such a happy message makes me
“I’m really glad I published this information.”
I feel it again.
As you said, I also believe this is
one of the incredibly valuable pieces of information obtainable from the market
and I’m really glad you felt that way.
Furthermore, more than anything,
“For those who understand, this greatness is properly communicated.”
I thought about it deeply.
When I completed this and first displayed it on an actual chart,
“Perhaps I’ve created something amazing…”
I still remember staring at the chart for a while.
Honestly, the sense of awe at that time is hard to put into words.
That’s why when I receive empathy messages from those who actually use it,
I feel glad I developed it and published it.
That’s how I feel.
With this opportunity,
Thank you very much for your kind messages.
In trading, I value
“What is happening in the market right now?”
very highly.
Kyokugan is
“Now, this moment”
Now,which way is the buying vs selling leaning?
And,
is that force strengthening?
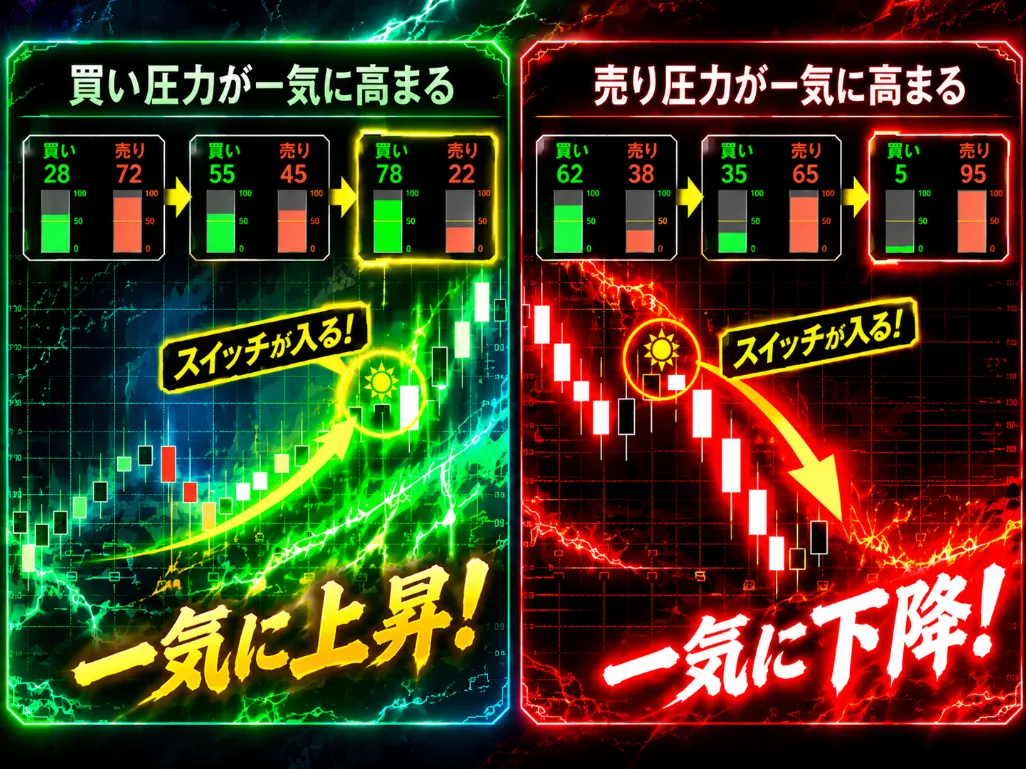
Or,
is it starting to weaken?
Seeing this current evolution while considering the chart.
It’s not about “will go up later,”
but rather,
“Right now the buying side is strengthening.”
Not “will go down later,”
but rather,
“Right now the selling side is starting to lean.”
This is the difference.
Not an eye that tries to predict the future,
an eye that watches the changes happening now.
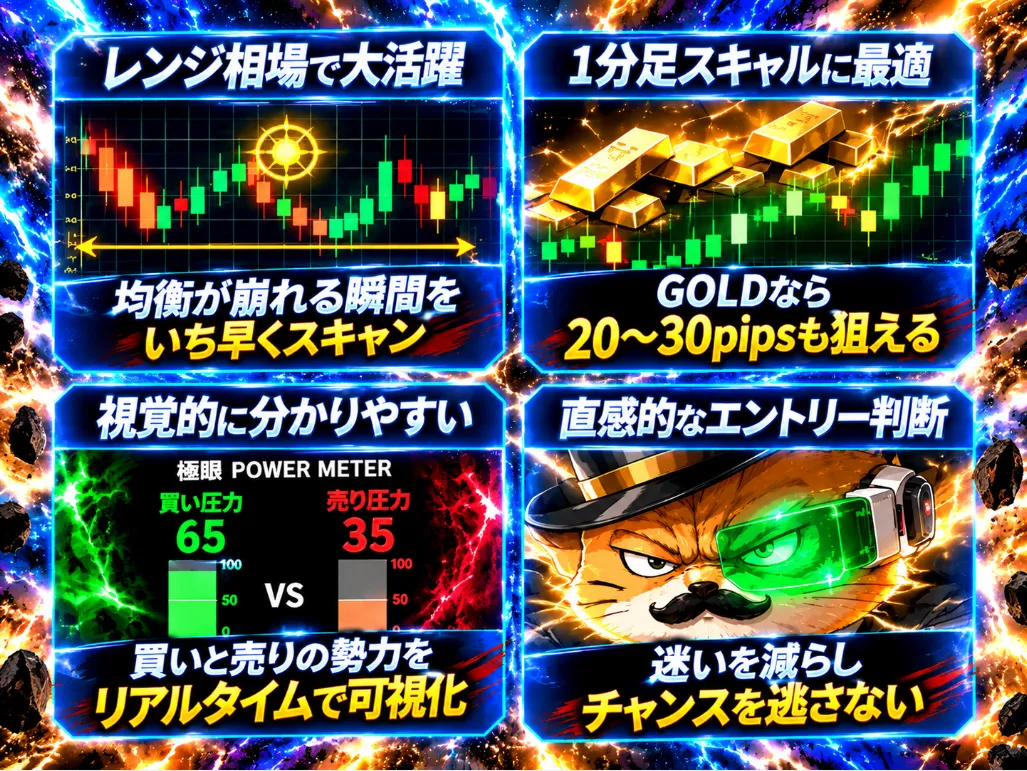
That is
【Kyokugan】
The principle I have upheld while facing charts for many years,
“First, see now before trying to predict.”
Please experience this concept on an actual chart.
【Limited quantity】Only a few left
Current limited-price offer is almost sold out.
Once the planned quantity is reached, a price update is planned.
If you’re interested, please check it out at the current price while you can.
【Lucky Latest】Kyokugan – product page is here ⇩⇩⇩