
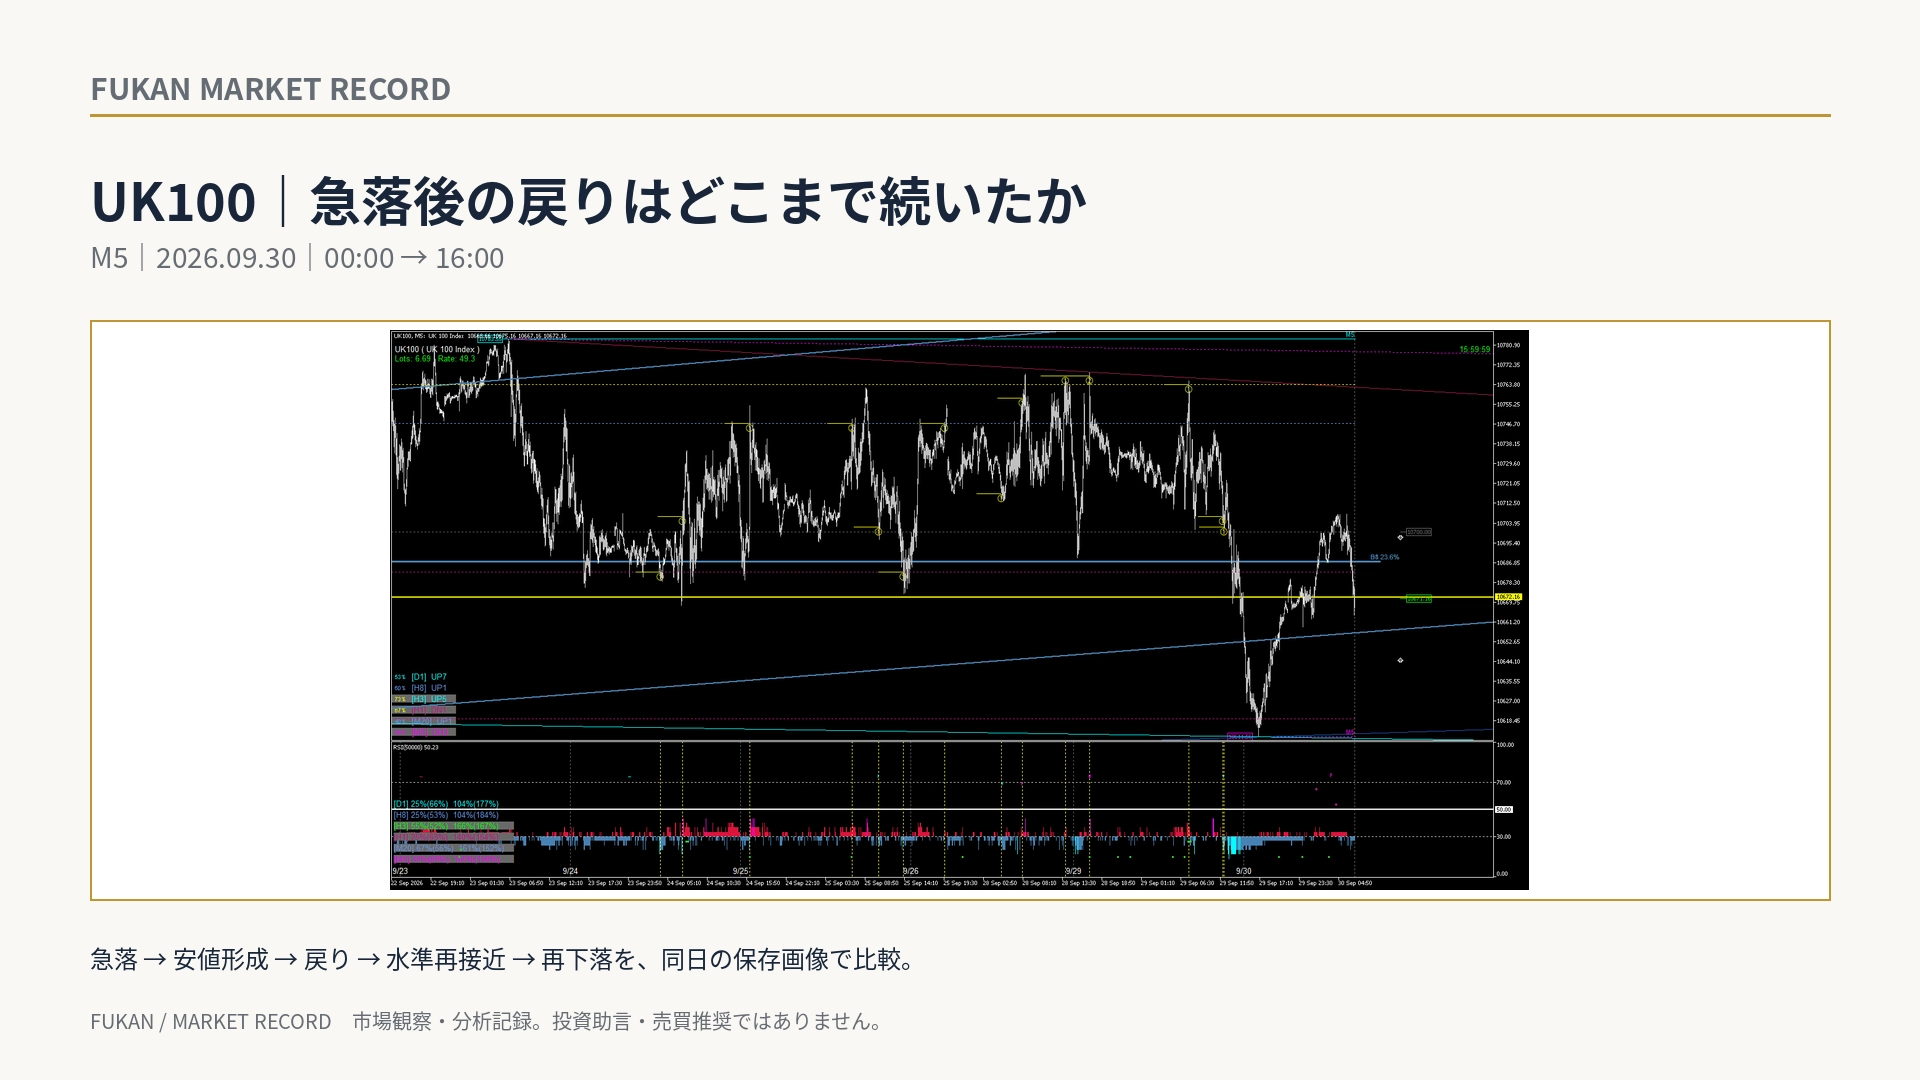
Follow the 16 hours after UK100's slump — the rebound from the trough and the subsequent pullback
UK100 After the Sharp Drop: 16-Hour Follow-Up — Rebound from the Lows and the Subsequent Dip
Saved on September 30, 2026, as UK100 M5 FUKAN live screen, compared at five times: 00:00, 04:00, 08:00, 12:00, and 16:00.
The key point this time is not merely looking at the “rebound moment” after the drop, but tracing, under the same display conditions, the path from the formation of the low, its return, and then its move downward again.
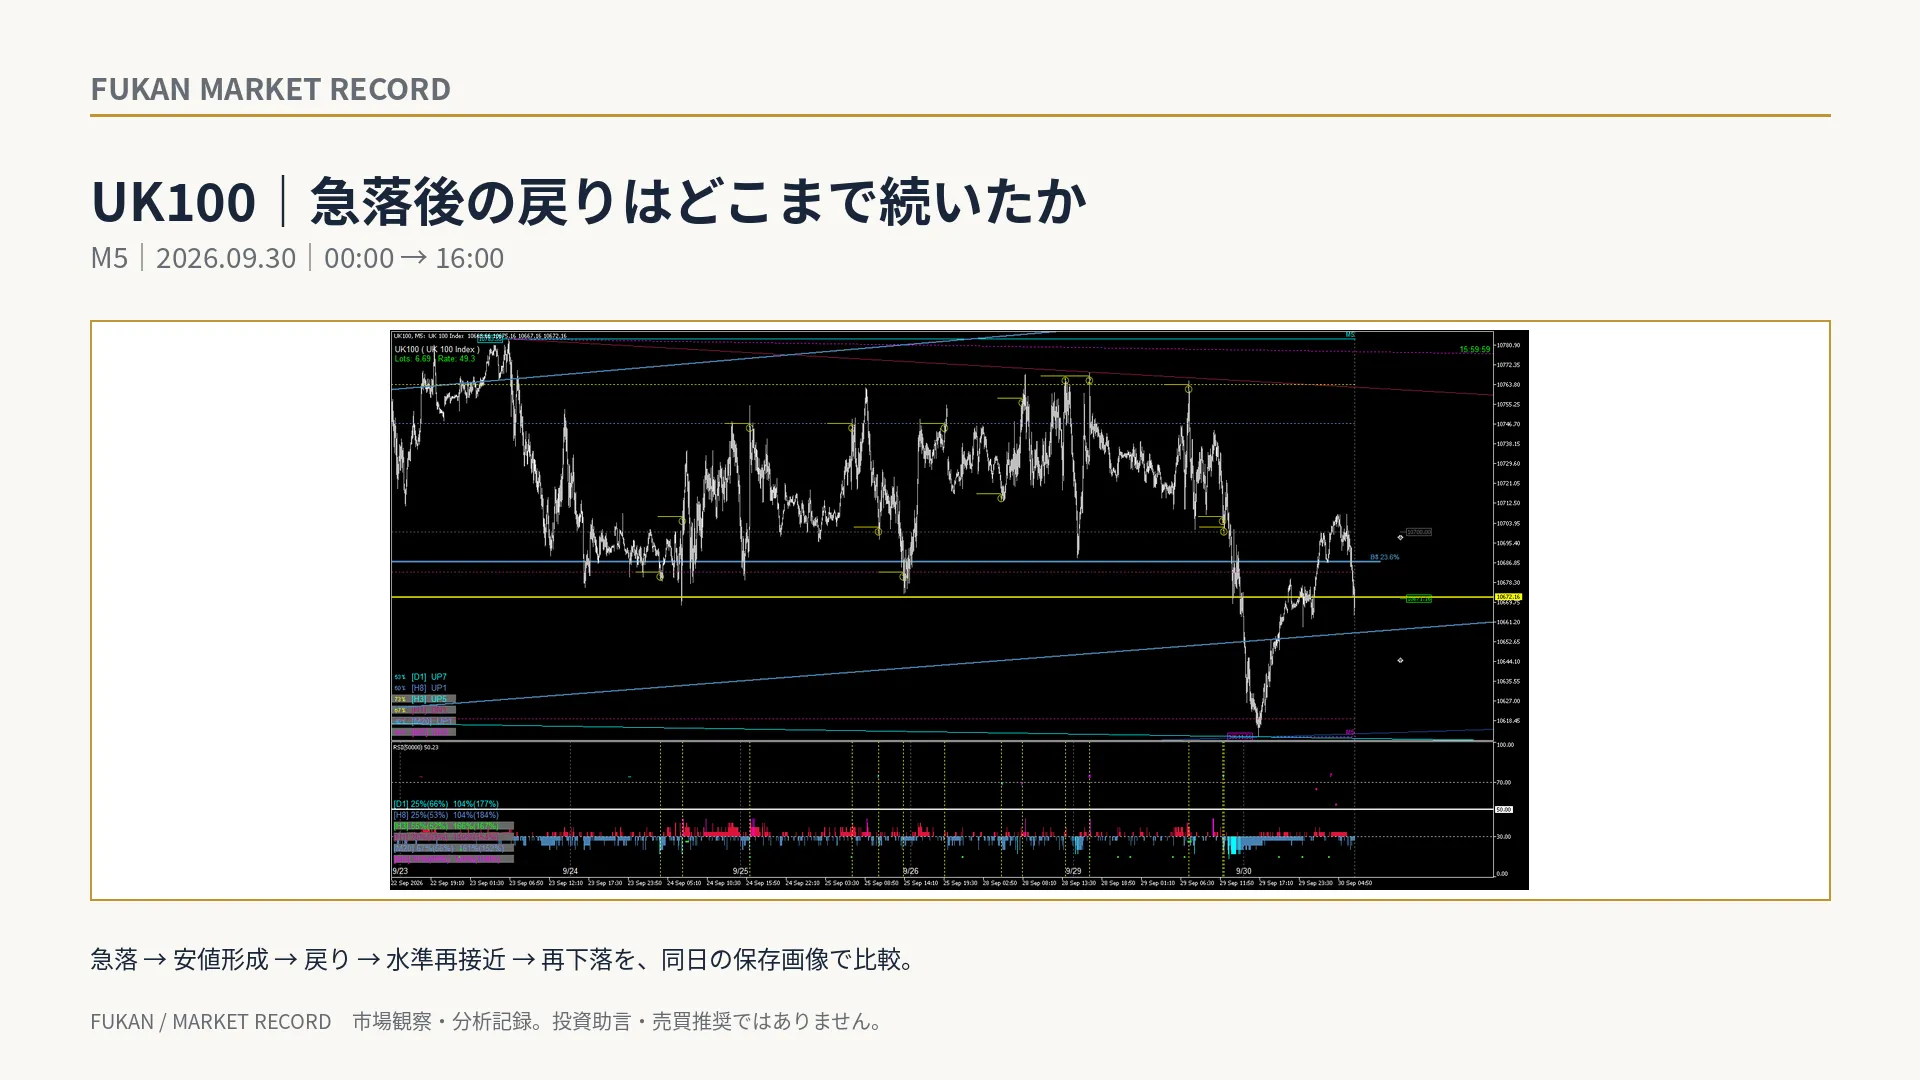
1 | 00:00 — Immediately after the plunge
In the 00:00 saved image, prices moved sharply downward just beforehand, and the right edge reaches near the lower yellow level. This point is set as the starting point for this time-series comparison.
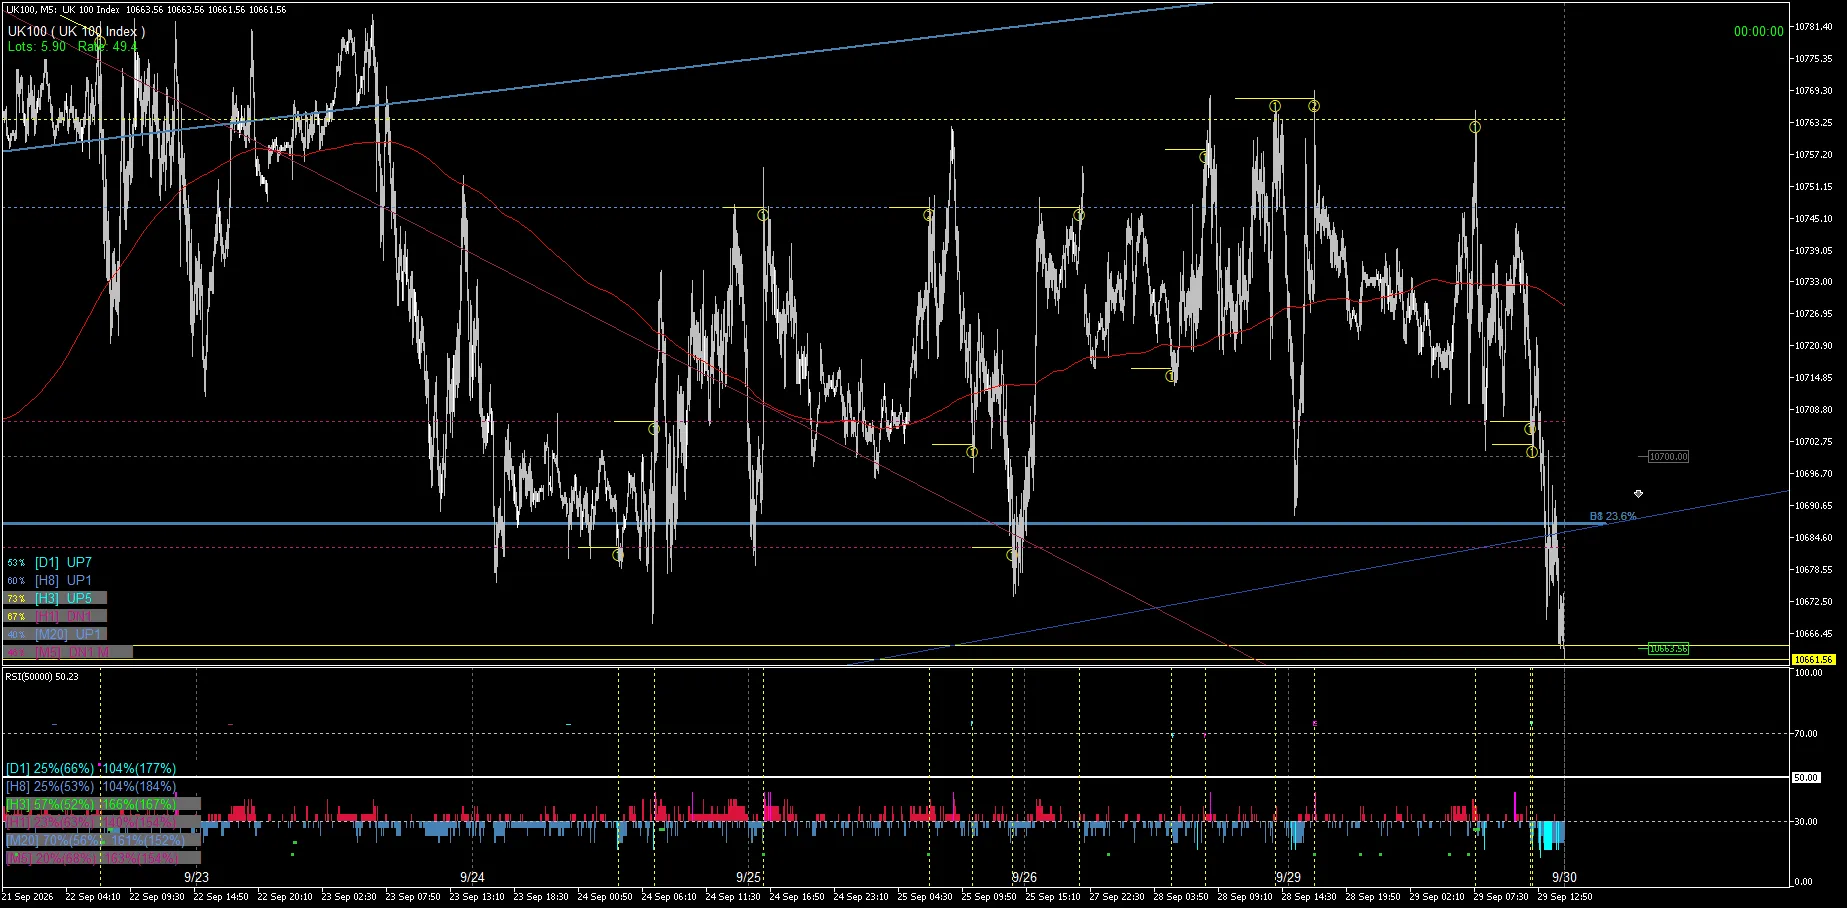
2 | 04:00 — After forming the Low, a rebound
At 04:00, after forming a new low on the lower side, prices begin to move back upward. The screen still shows the lower level and the upward blue line, and you can observe how the price position changes within that context.
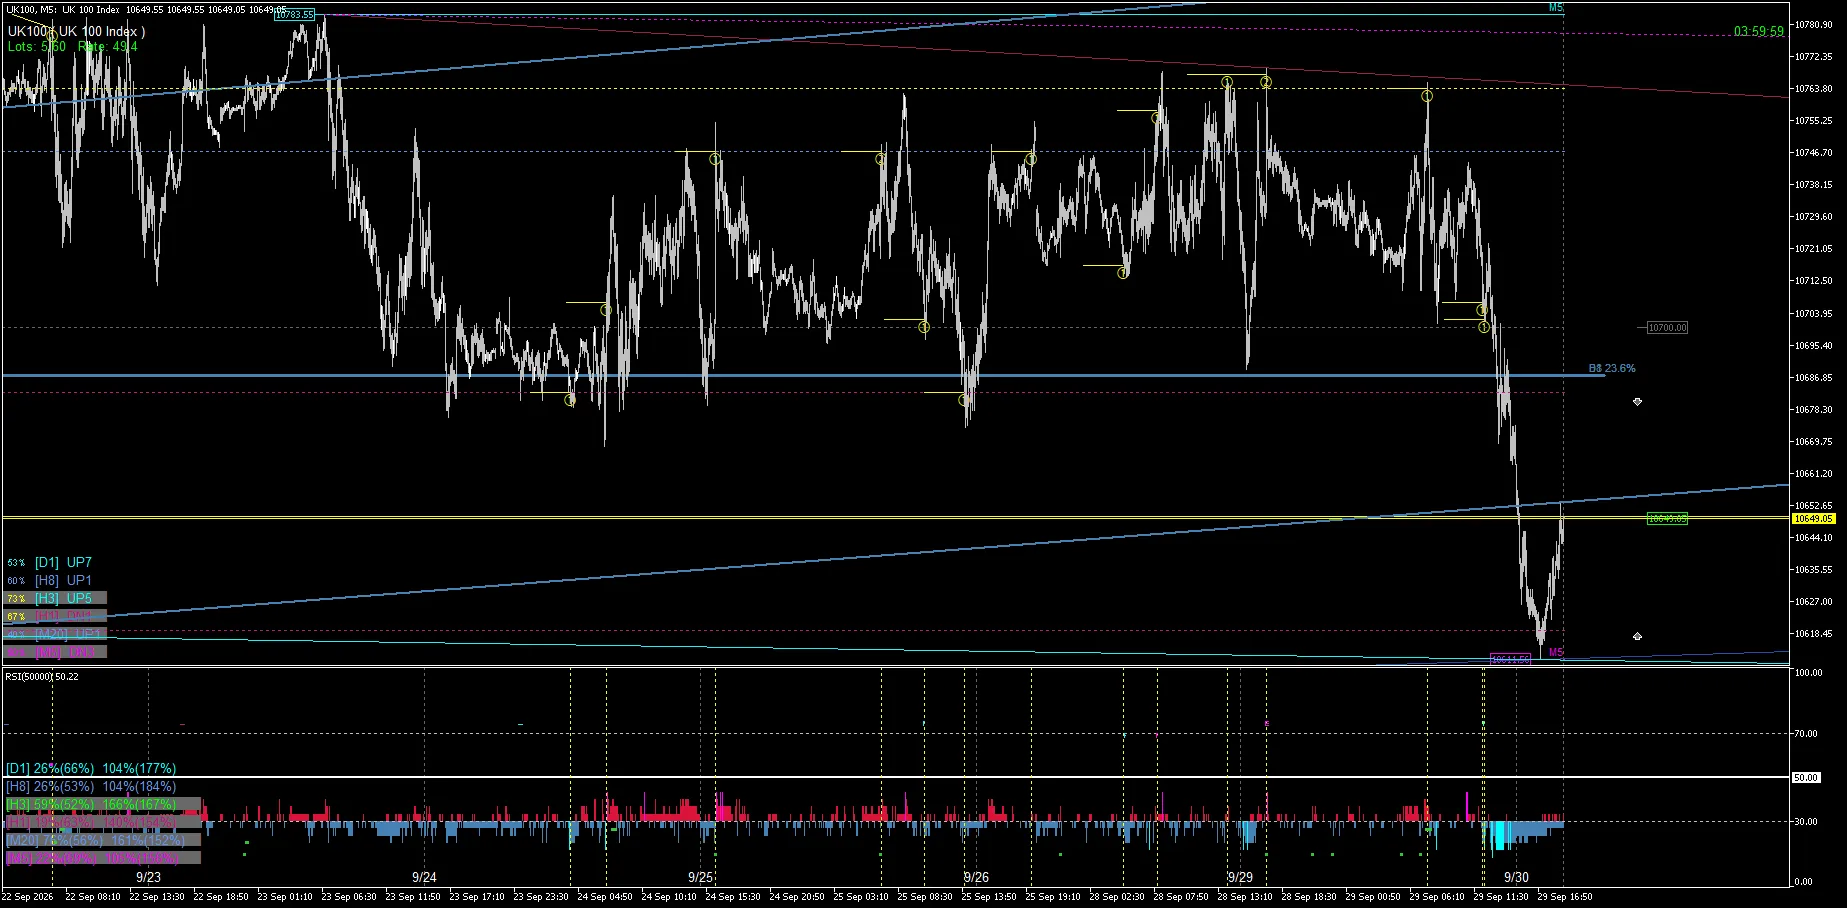
3 | 08:00 — The rebound progresses
At 08:00, the rebound from the 04:00 low continues. By following not just a single moment after the plunge but several hours, you can compare how much the price retraced after the reaction.
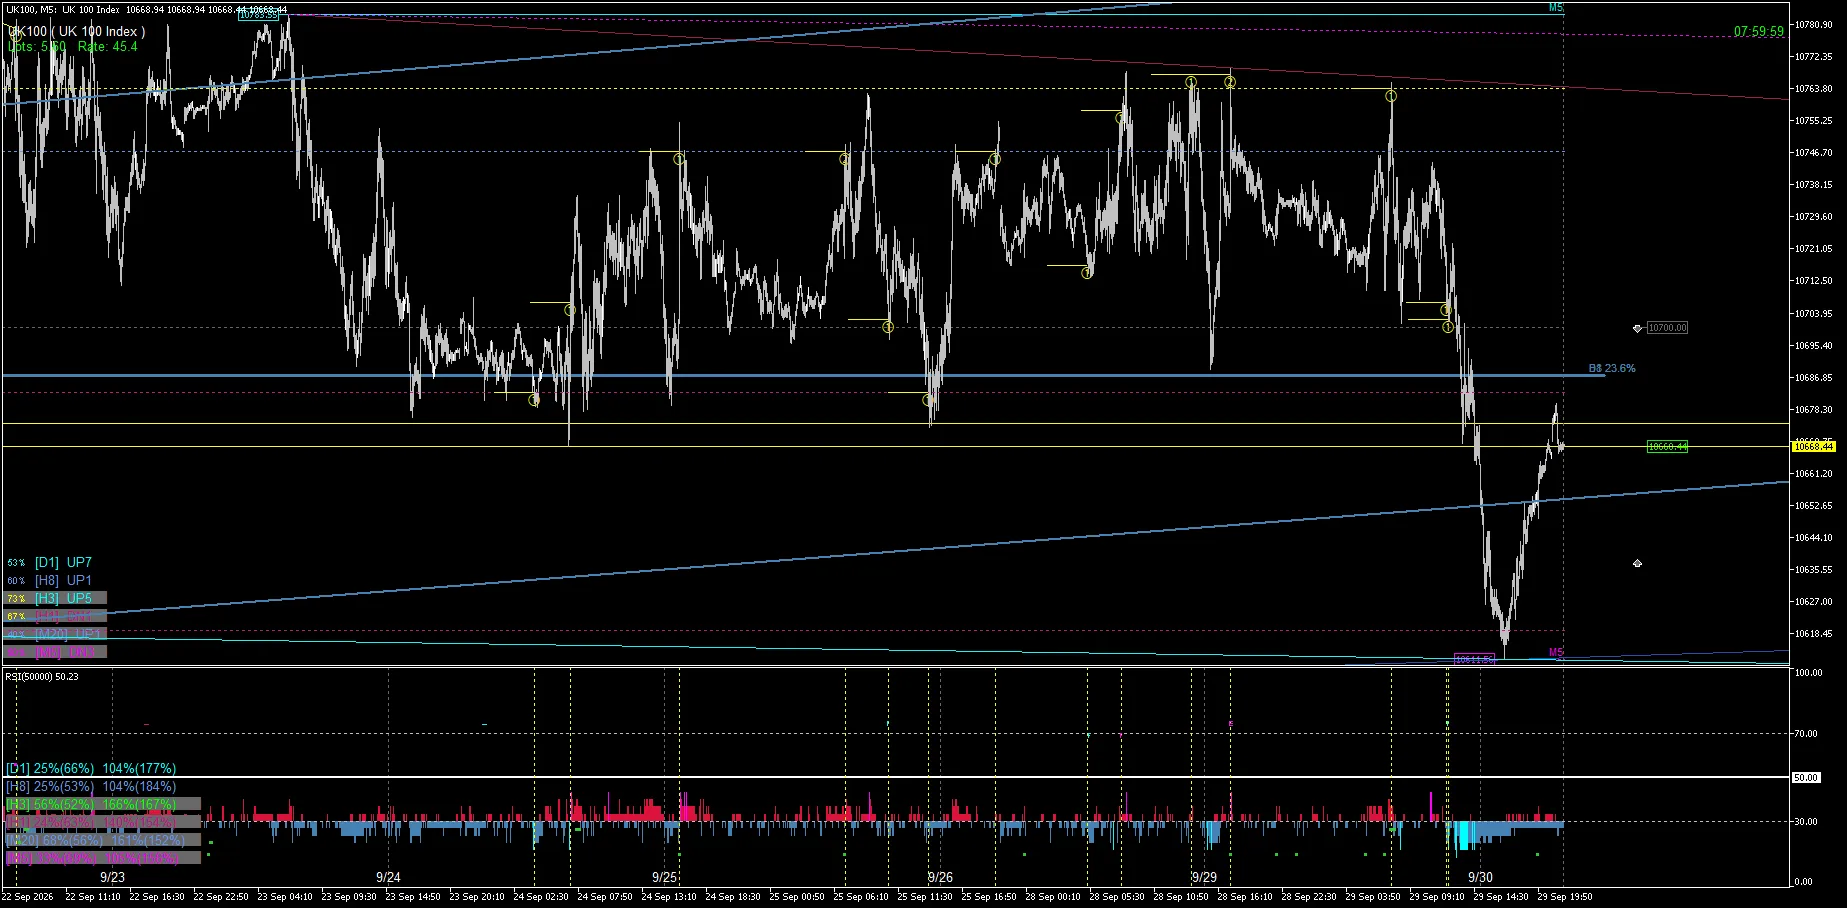
4 | 12:00 — Re-approach to the upper level
At 12:00, the rebound advances further, and the right edge price again approaches the upper yellow level. This is the process of the rebound from the low shifting its relation to another display level.
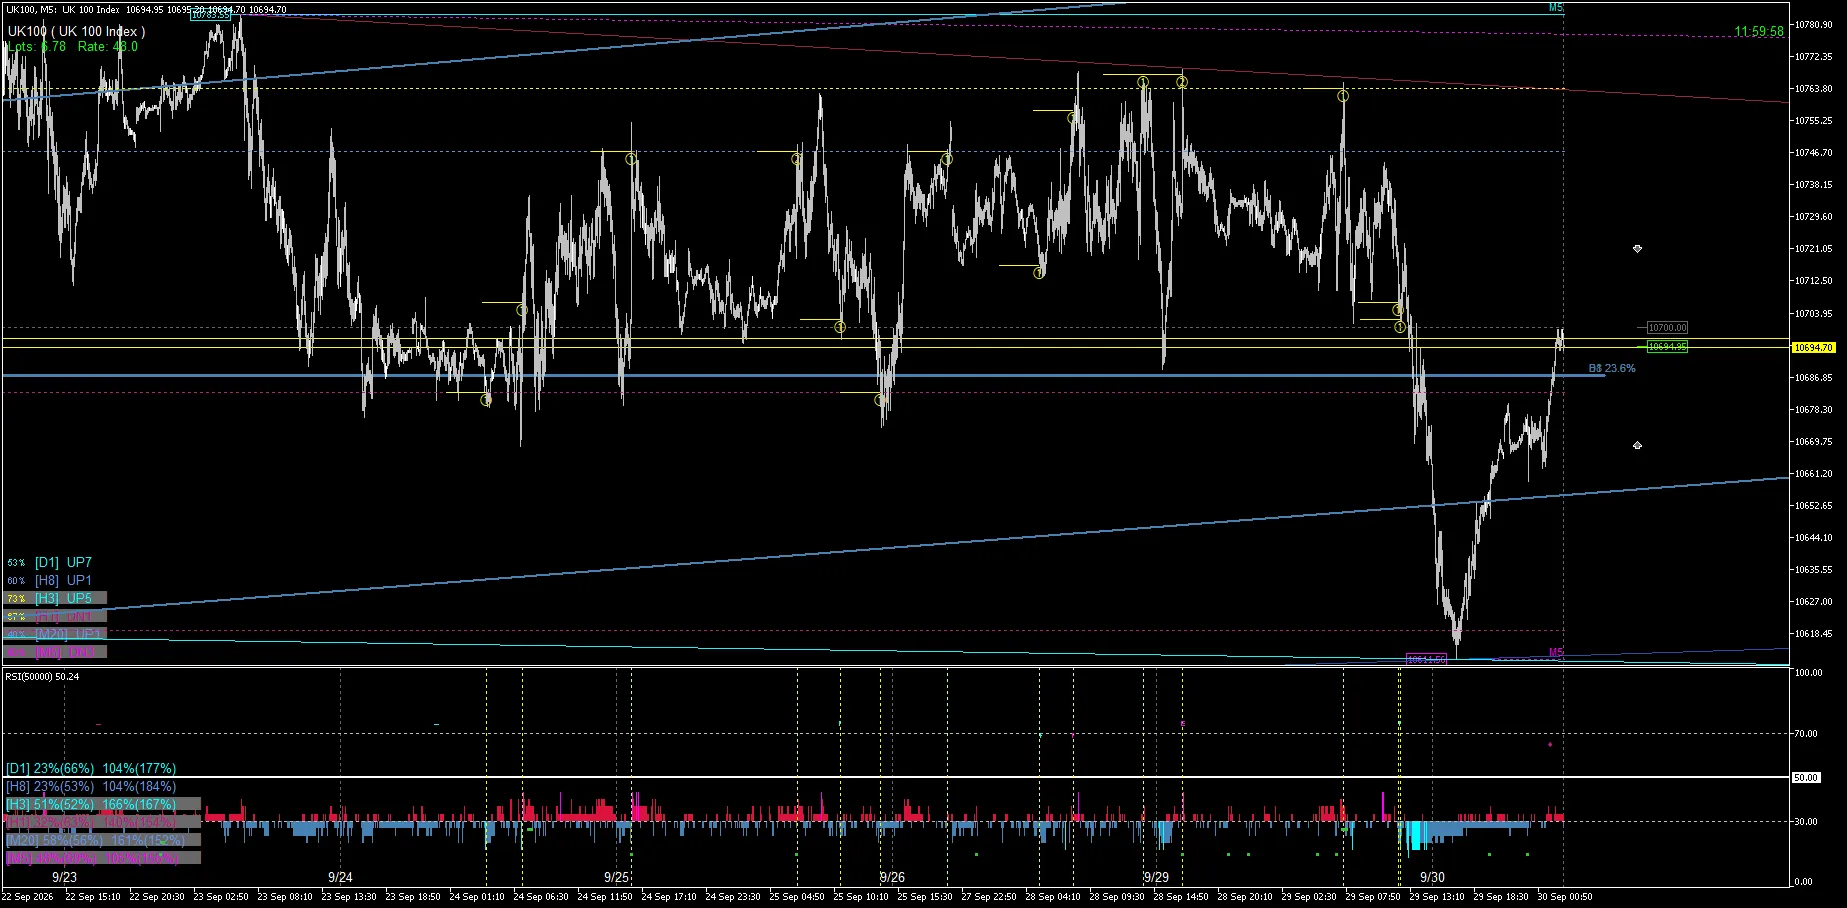
5 | 16:00 — After the rebound, a renewed downward move
At 16:00, after the rebound up to 12:00, the right-edge price again moves downward. In this record, including this “after that” prevents isolating a simple rebound success.
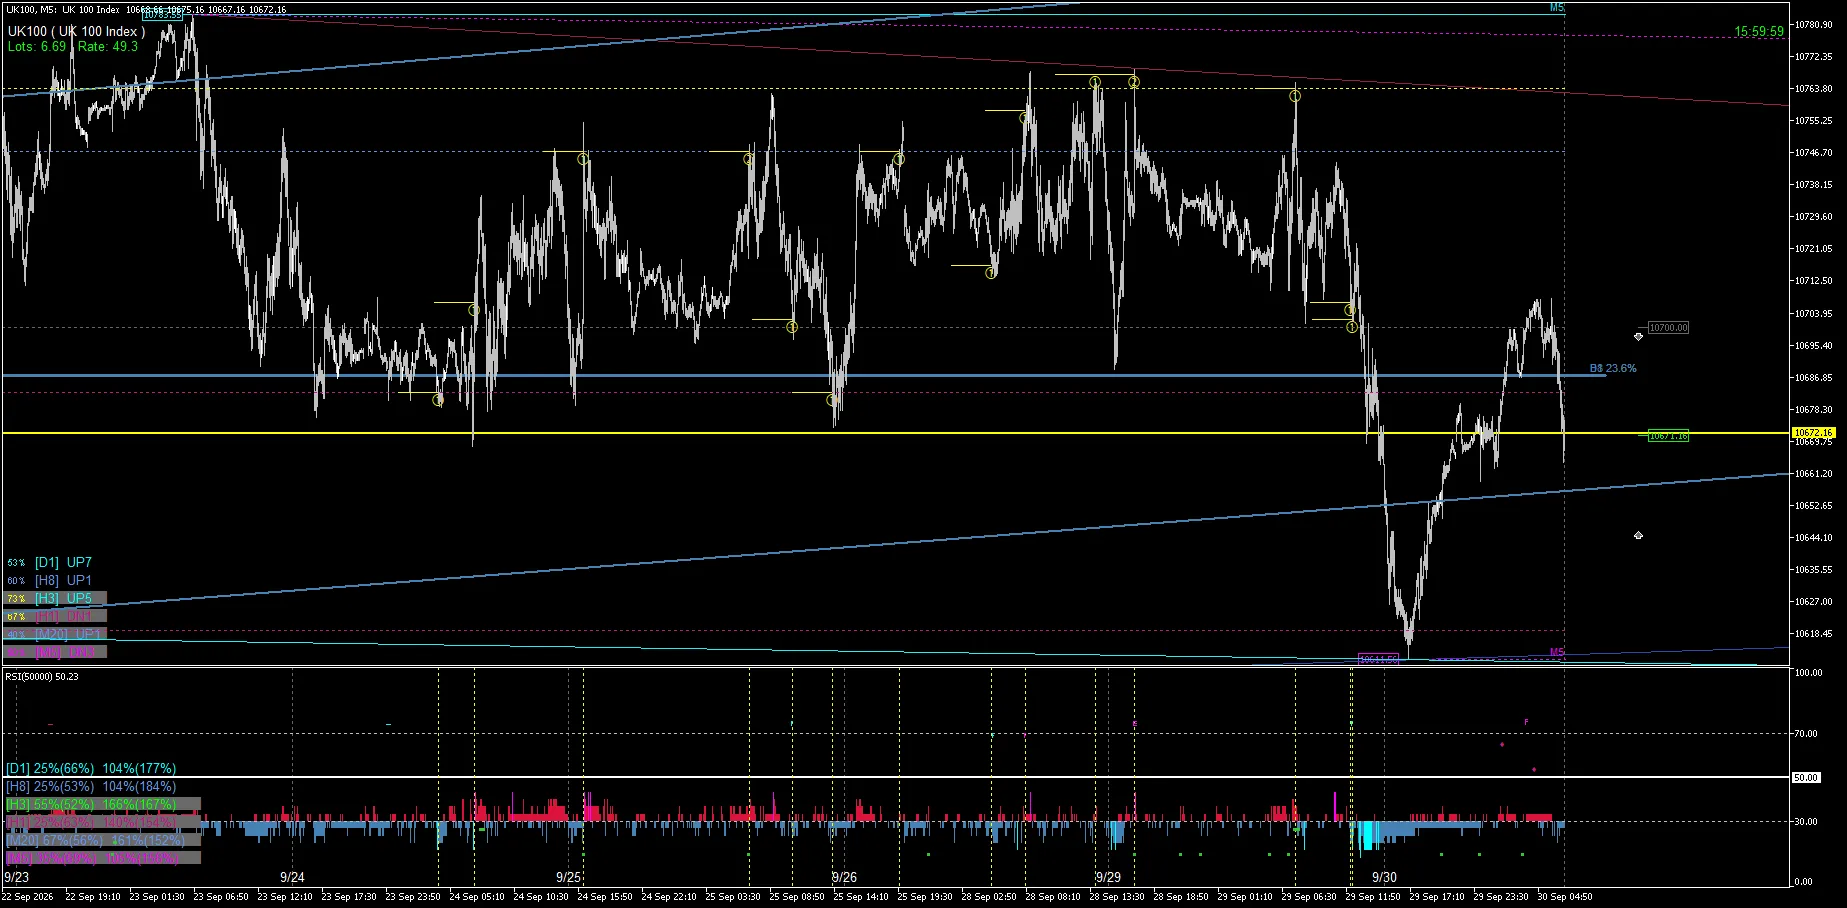
What FUKAN is watching
In FUKAN’s Market Record, conclusions aren’t drawn merely from the fact that the price approached a line or reacted once. It retains the position relationships of multiple time-frame display levels and current price on the same screen, and checks how those relationships change several hours later.
The present UK100, viewed as a sequence of drop → low formation → rebound → re-approach to the upper level → renewed decline, reveals a continuity of price movement that cannot be understood from a single reaction alone.
Summary
On September 30 for UK100, after a large drop around 00:00, prices rebounded from the low, approaching the upper display level by 12:00. Then at 16:00, a downward movement was observed again.
These five time points alone cannot determine the statistical advantage of a specific line or future price movement. In FUKAN, we record not only reactions, but also breakthroughs, non-reactions, and continuation after reactions using the same standard.
FUKAN offers a 7-day trial. After confirming display and operation performance in a real MT5 environment, you can decide on continued use.
This article is a market-observation and analysis record and is not investment advice or a buy/sell recommendation. It does not guarantee future price movements, profits, or win rates. The times used are the times recorded on the original image.