
In theory, if you know where FX will reverse, you will "not lose"
2026 Latest Version!!
You can watch the dialogue VTR with Godojan President Hayakawa and me here
Announcement of new products!!
↓↓↓

By the way, knowing this method
New Millionaire Trader's Scalping: Volume Plus
FX trading that is not ordinary hedging
If you engage in it, I believe your mind will clear regarding the turning points I write about daily in Investment Navigator and you can focus on trading.
Good evening, everyone.
Today, the USD/JPY range so far is about 1 yen, and today’s high and low were the Tokyo session’s highs and lows.
From now on, in this time frame I think it will stay in a range within this 1 yen width.
If the Tokyo session highs are cleared and it broadens further, it might lean more toward a drop?
I think so.
In the near term: around 15716 for the upside, and 15667–15641 for the downside
that’s the range.
USD/JPY 1-hour chart
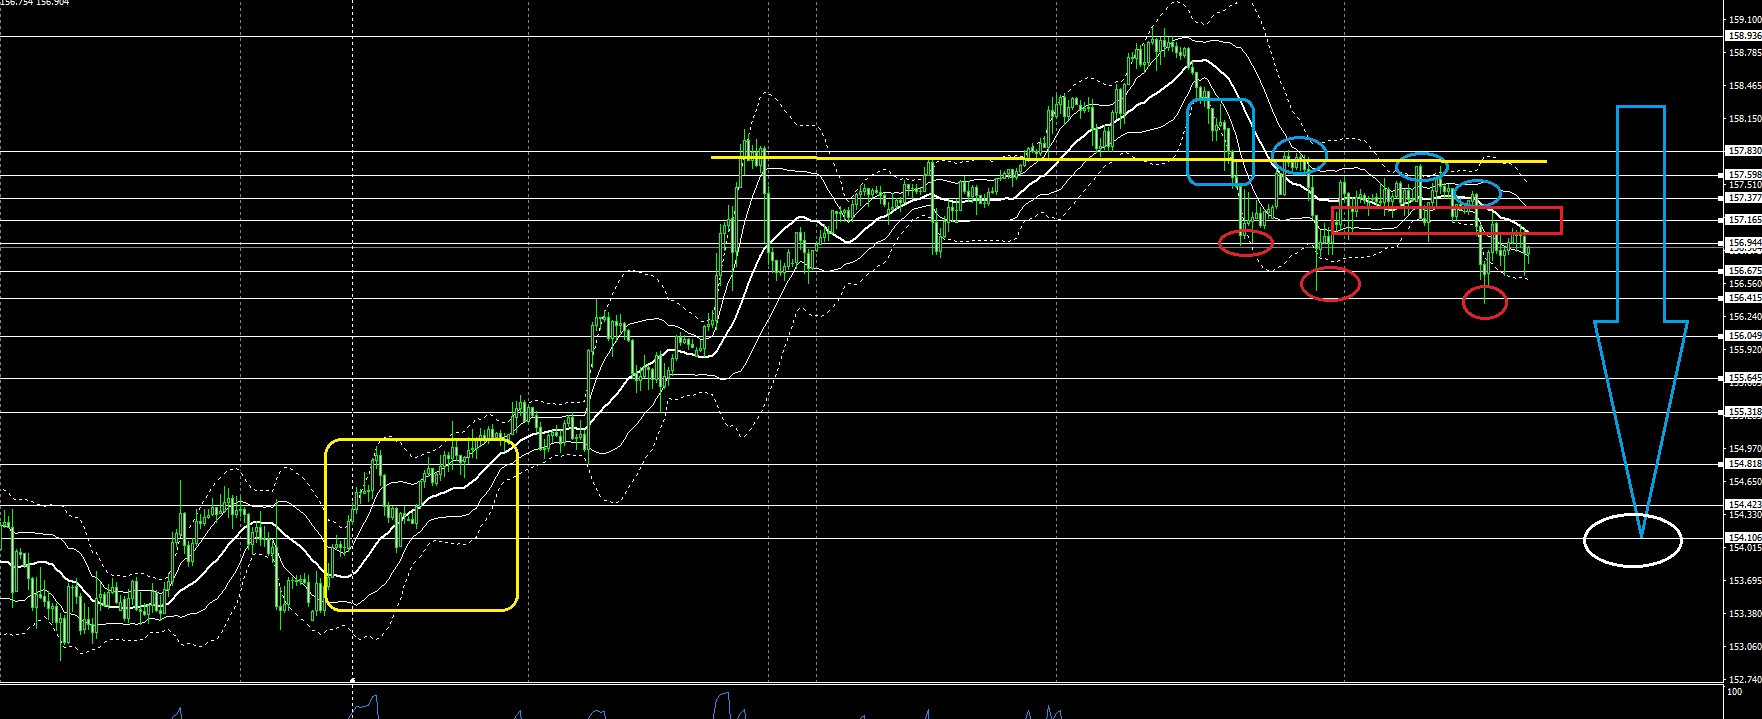
 For the Millionaire Traders, please confirm that you are switching to buy in yellow boxes and to sell in blue boxes.
Up to now, the blue and red circles have each been making lower lows.
Therefore, the judgment is that a downtrend is in place.
The white horizontal line is the Millionaire Trader 1-hour line.
The yellow horizontal line and red box zones are considered as support/resistance turning points.
If the decline continues and the downtrend persists, the rightmost red circle lows must be updated further.
From here, the chart will be watched focusing on that area.
If it keeps falling, the temporary target is around 15410 white circle.
All Millionaire Trader users, please check your own Millionaire Trader 1-hour chart.
From here, trading will be about L-position on pullbacks while the price is falling.
Or, from the pullback point, S-position so that you can hold until the recent low is broken...
This area seems to be the key point.
When you look at the attached chart, the price is clearly rebounding on the Millionaire Trader line.
If you position inside at that moment,it becomes easy and immediate profit.
People may say this kind of article is post-hoc, but if you base your chart analysis on the Millionaire Trader line, you can outline trading scenarios long before.
Looking at the chart, the price generally rebounds somewhere and expands.
That means you just need to find where it rebounds.
You need your own logic for where rebounds occur, but keep in mind what I always write about and be aware of chart rebound points.
If you can do this, your trading will improve and you’ll lose less.
Study the support/resistance swaps and past rebound points on the 1-hour chart, or learn about the Millionaire Trader Line.
Thank you for your continued support today.
You can verify the trading histories of the super traders to understand FX methods