
CALDO GOLD AI|Review of GOLD scalping buy signals and settlement results
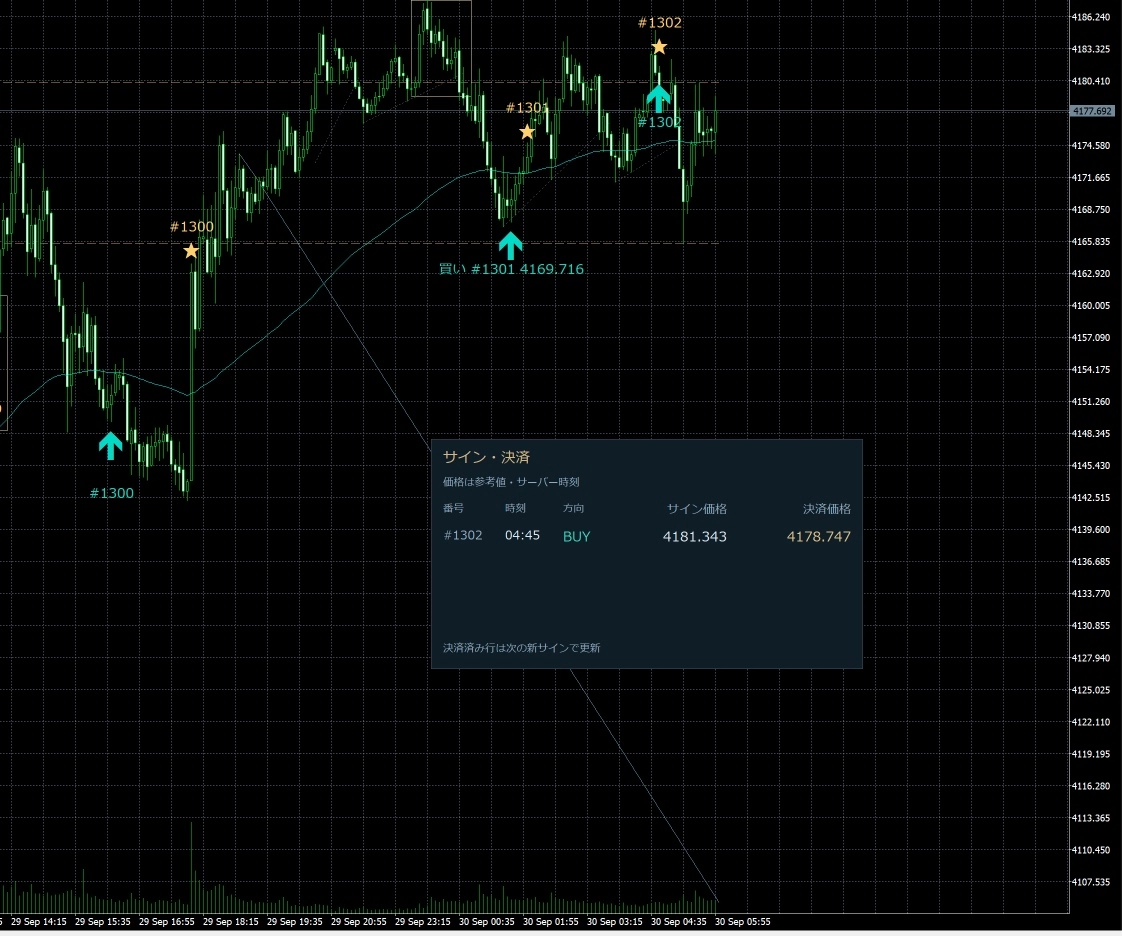
This time, we will review the buy signals and settlement records displayed on the CALDO GOLD AI chart. The attached screen shows three buy signals #1300, #1301, and #1302, along with star markers of the same numbers.
The horizontal axis of the chart represents price movement from September 29 to 30. The times listed in the chart's “Signals/Settlements” section are server times and have not been converted to Japan time.
CALDO GOLD AI display screen. Light blue buy arrows, yellow star markers, and the bottom-right “Signals/Settlements” section can be checked.
Review the three buy signals together with the price movement
#1300: Rebound from the decline
On the left side of the chart, a buy arrow for #1300 appears near the decline phase. Afterwards, the price tests lower briefly and then rebounds, and the same-numbered star marker can be seen within the rising trend.
This is a scene where you can confirm a pullback after the buy signal from actual price movement. Since the numbers for the signal price and settlement price for #1300 are not displayed on this screen, the profit range for this single trade is not listed.
#1301: A moment to confirm the retracement after the rally
In the center of the screen, “Buy #1301 4169.716” is displayed. After the rise and subsequent pullback, a buy signal appears, and the #1301 star marker can be confirmed in the following retracement phase.
The signal price is 4169.716. On the other hand, the settlement price for #1301 is not displayed numerically on this screen, so the exact profit range up to settlement has not been calculated.
#1302: Settlement results can be confirmed by price
In the right-side “Signals/Settlements” section, the following records are displayed.
- Signal number: #1302
- Time: 04:45 (server time)
- Direction: BUY
- Signal price: 4181.343
- Settlement price: 4178.747
The price difference for the buy direction is4178.747 − 4181.343 = −2.596This means that, according to the reference prices on the screen, settlement occurred at a price lower than the signal price, resulting in a negative price movement.
This −2.596 is the price difference of GOLD and does not represent an account loss or pips. Actual profit or loss depends on lot size, contract specification, execution price, spreads, and fees.
Do not rely solely on the position of the star to judge profit
The arrows and stars on the chart are clues to follow which signal they correspond to. However, you cannot read the execution price or profit amount from the visual height of the markers.
In this case, #1302’s settlement result is also confirmed by the numbers in the “Signals/Settlements” section. For #1300 and #1301, you should also view the rising price movement and consider their realized profits separately.
Therefore, this article does not publish total profit/loss across all three cases, win rate, or the profit factor. What can be confirmed here is the flow of signals displayed on the screen and the settlement results based on the reference price for #1302.
Review entry and exit on the same screen
GOLD experiences upward movement and pullbacks even within short time frames. By sequentially confirming “how it moved after the signal,” “where the settlement display appeared,” and “what the price difference was,” you can more easily review each trade decision.
CALDO GOLD AI is an MT5 indicator for confirming GOLD’s buy, sell, and settlement signals. As in this example, we introduced how to review entry and exit by tracing signal numbers. You are responsible for making trading decisions and for order placement and settlement operations yourself.
How to confirm signals and settlements in GOLD scalping. Please see the product page for specifications and usage conditions.
【MT5】CALDO GOLD AI | GOLD Scalping Signals
Points we would like you to confirm
This article reviews reference prices and signals shown in the attached chart. It is not a report of performance across actual account trade history, account profit and loss, or all signals. Display examples and past price movements do not guarantee future profits or win rates.
CFD trading of GOLD involves risk of loss due to price fluctuations. Please check your trading size and costs and use at your own discretion and responsibility.