

9/30 GLD Long Rebound with only a $3 discrepancy. Individual investors become the nutrients for algorithms.
I shared this in the online community “The Path to Becoming a Part-Time Pro Trader” as expected, gold declined as projected, and then I was aiming for a buying opportunity.
This is the rebound position I posted in the Investment Navigator on 9/25.
Below the white line is the area where the algorithm targets buys.
It can be targeted for selling as well, but the approach requires caution.
In other words, while individual investors are taking a trend-following approach, institutions are looking at the opposite.
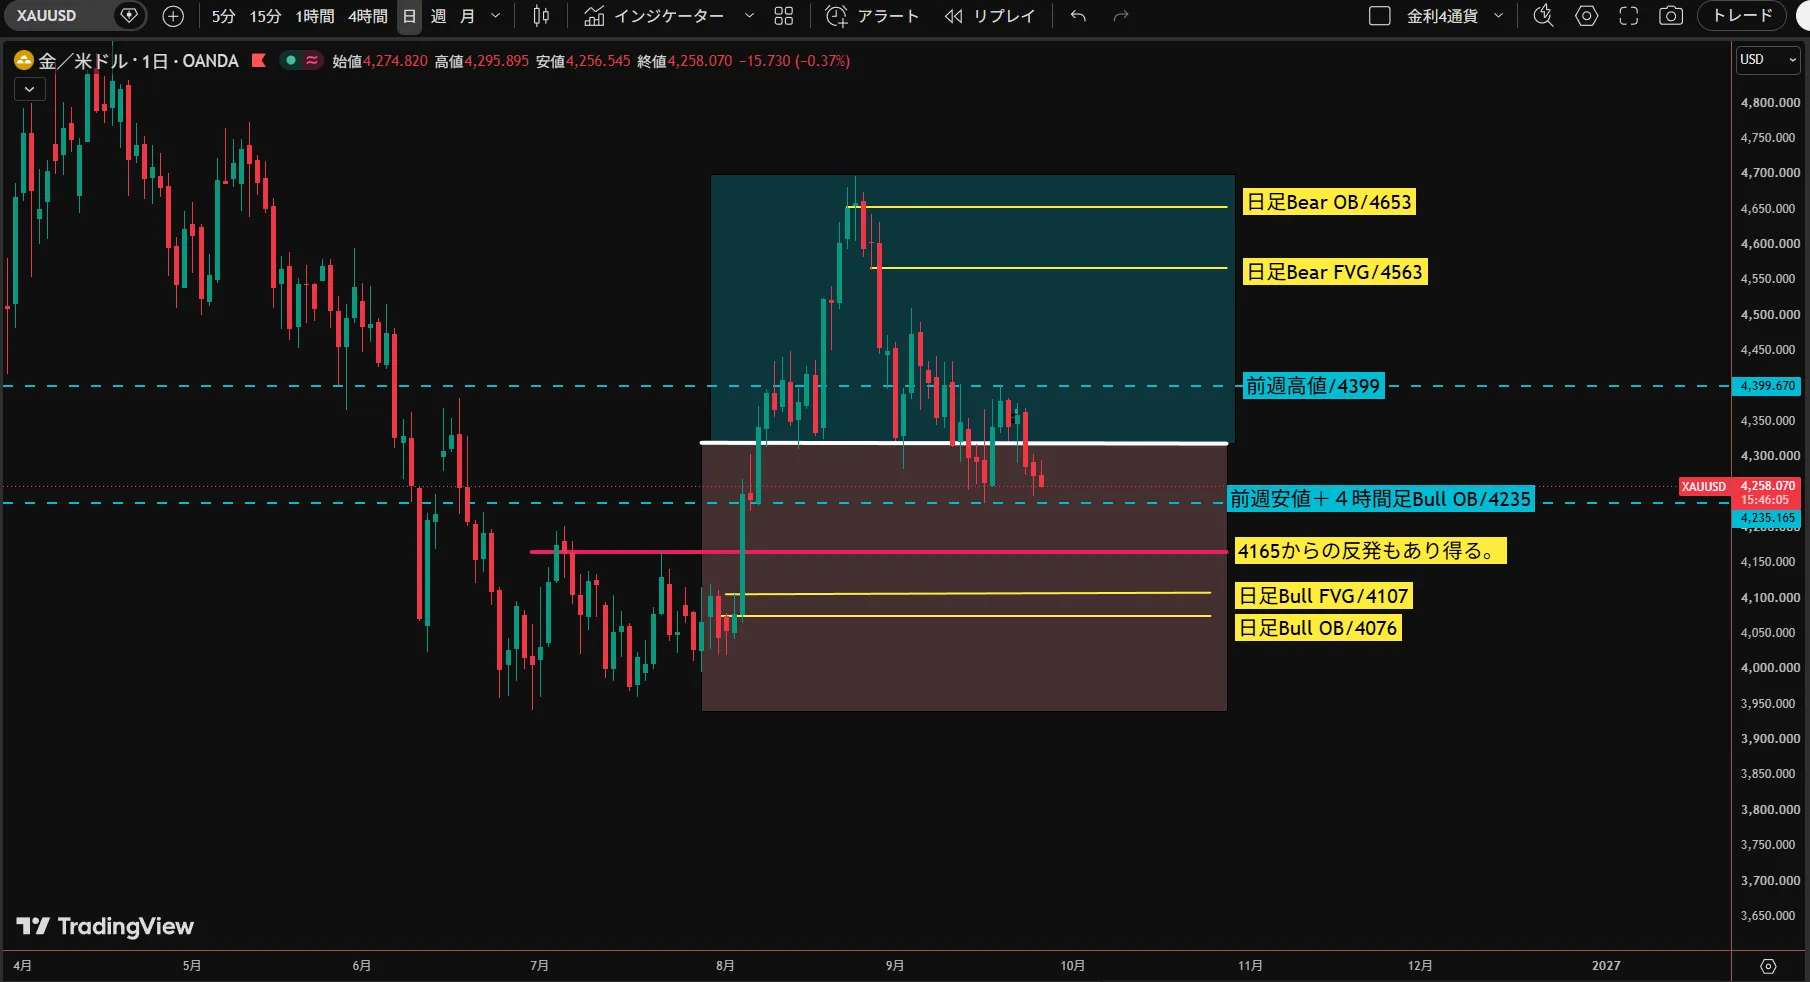
I was also watching the rebound at 4165, but since the conditions on the short-term chart didn’t line up, I couldn’t enter a buy.
Afterwards, I added a bit of analysis at the start of the week.
In other words, stop-losses had accumulated below this blue dashed line.
To students, I repeatedly emphasize that the blue dashed line updated weekly represents strong liquidity to be aware of.
9/28 19:46 Post
GLD, as I told you, fell from a descending triangle. Now it’s about whether it will fully fill the FVG. If it closes the daily chart like this, a Bear FVG will form, meaning a sizable amount of capital has entered the drop. If you look closely, there are also strong rebound locations lined up below it.
9/28 21:03
To students in the correction course. Those practicing comprehensive analysis are probably doing it on EURUSD, GBPUSD, and AUDUSD, but please analyze the buying opportunity for GLD. Especially try the lower-timeframe logic we emphasized in the study group. Please consider stop-losses with LQ as well.
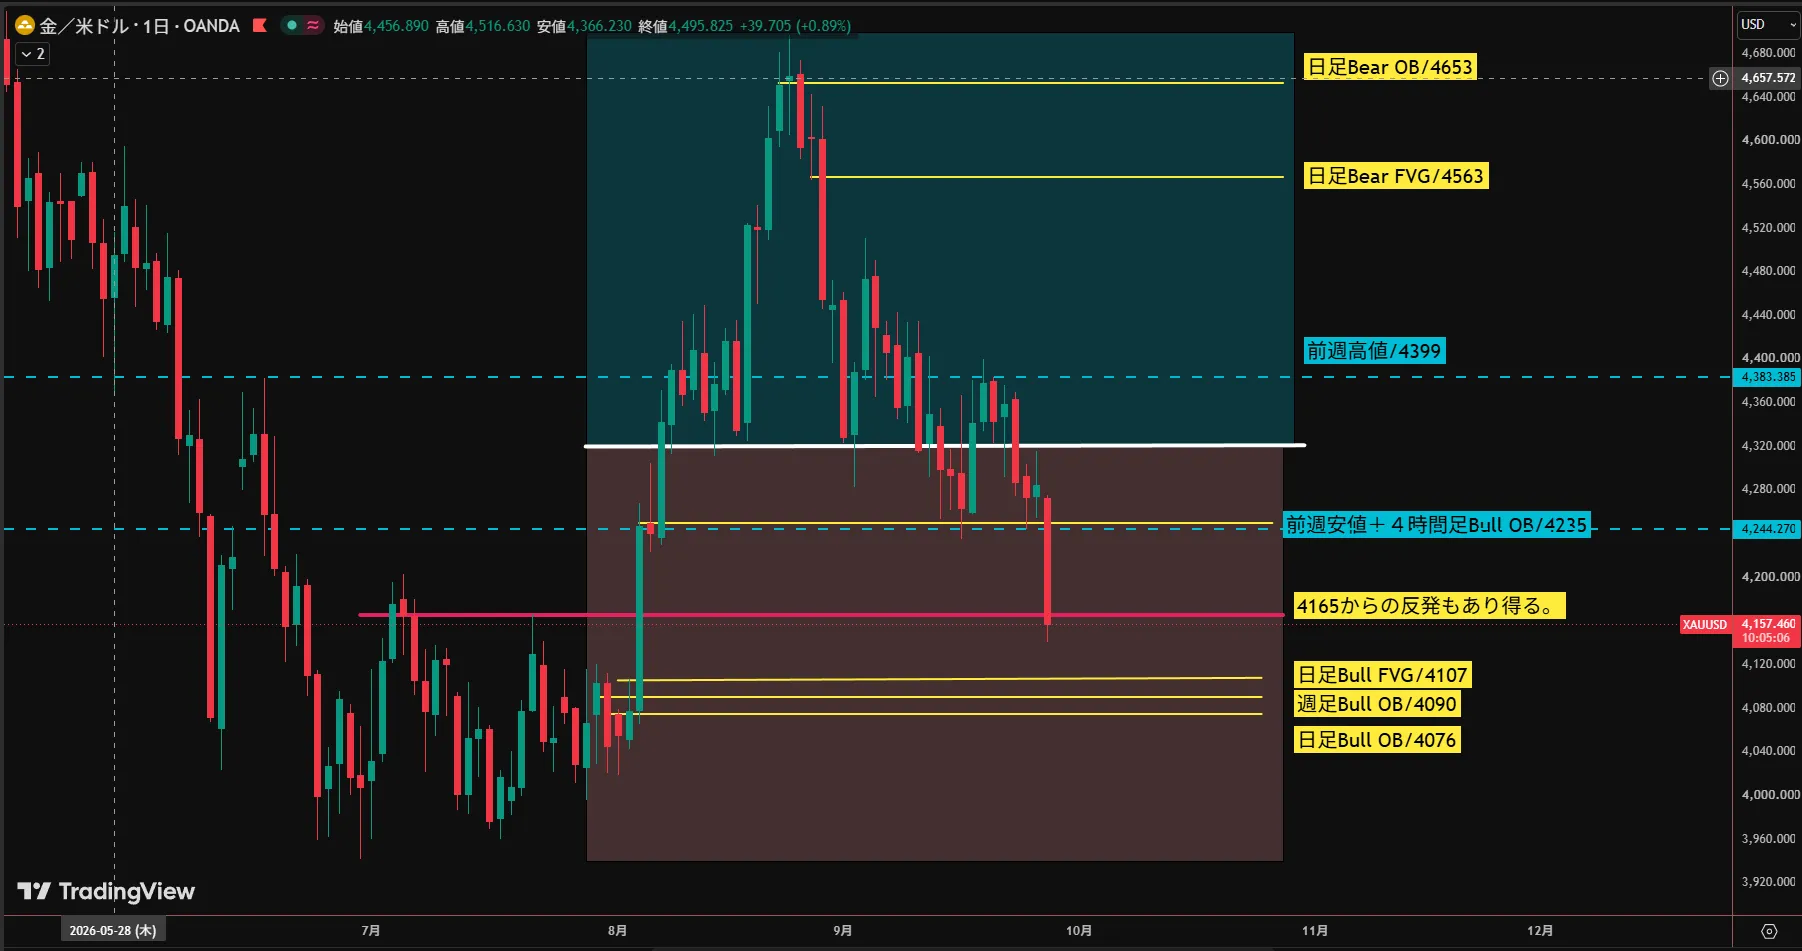
So, please analyze where the buying opportunity is, as I instructed during the comprehensive analysis step.
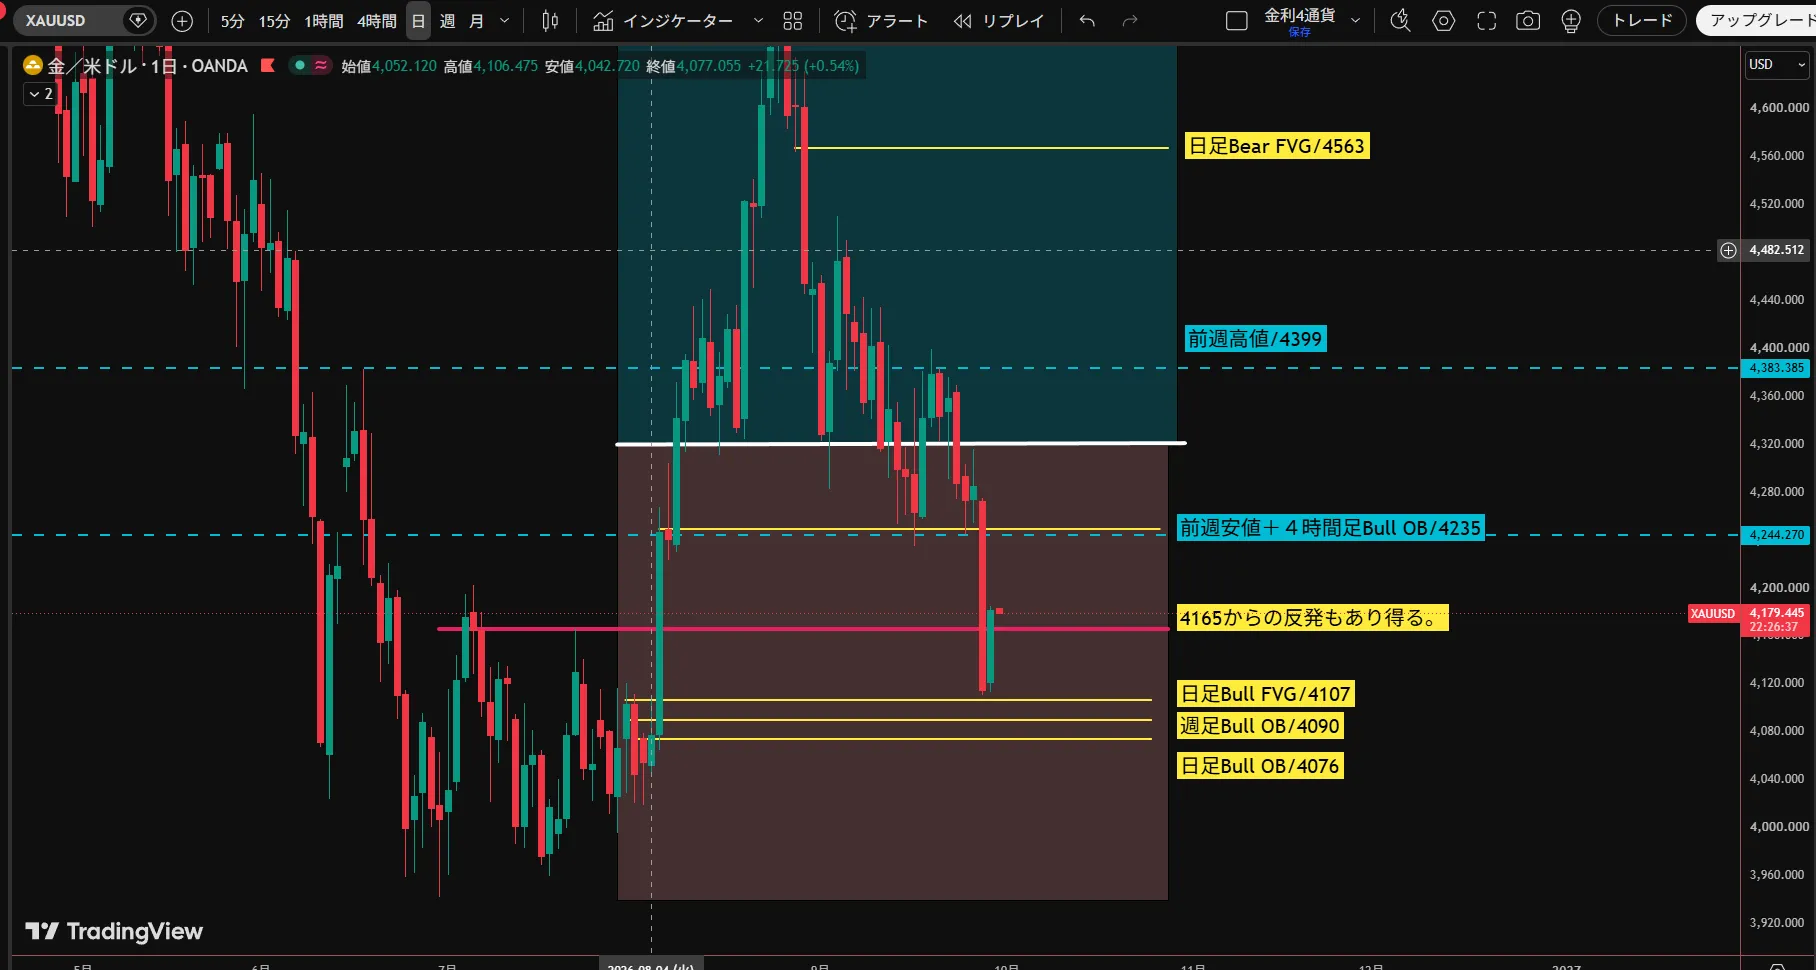
Those who analyzed have observed it in almost the same position.
The initial rebound position was 4107.
However, it rebounded at 4110, turning around just three dollars short.
Now I will look at this on the lower timeframe.
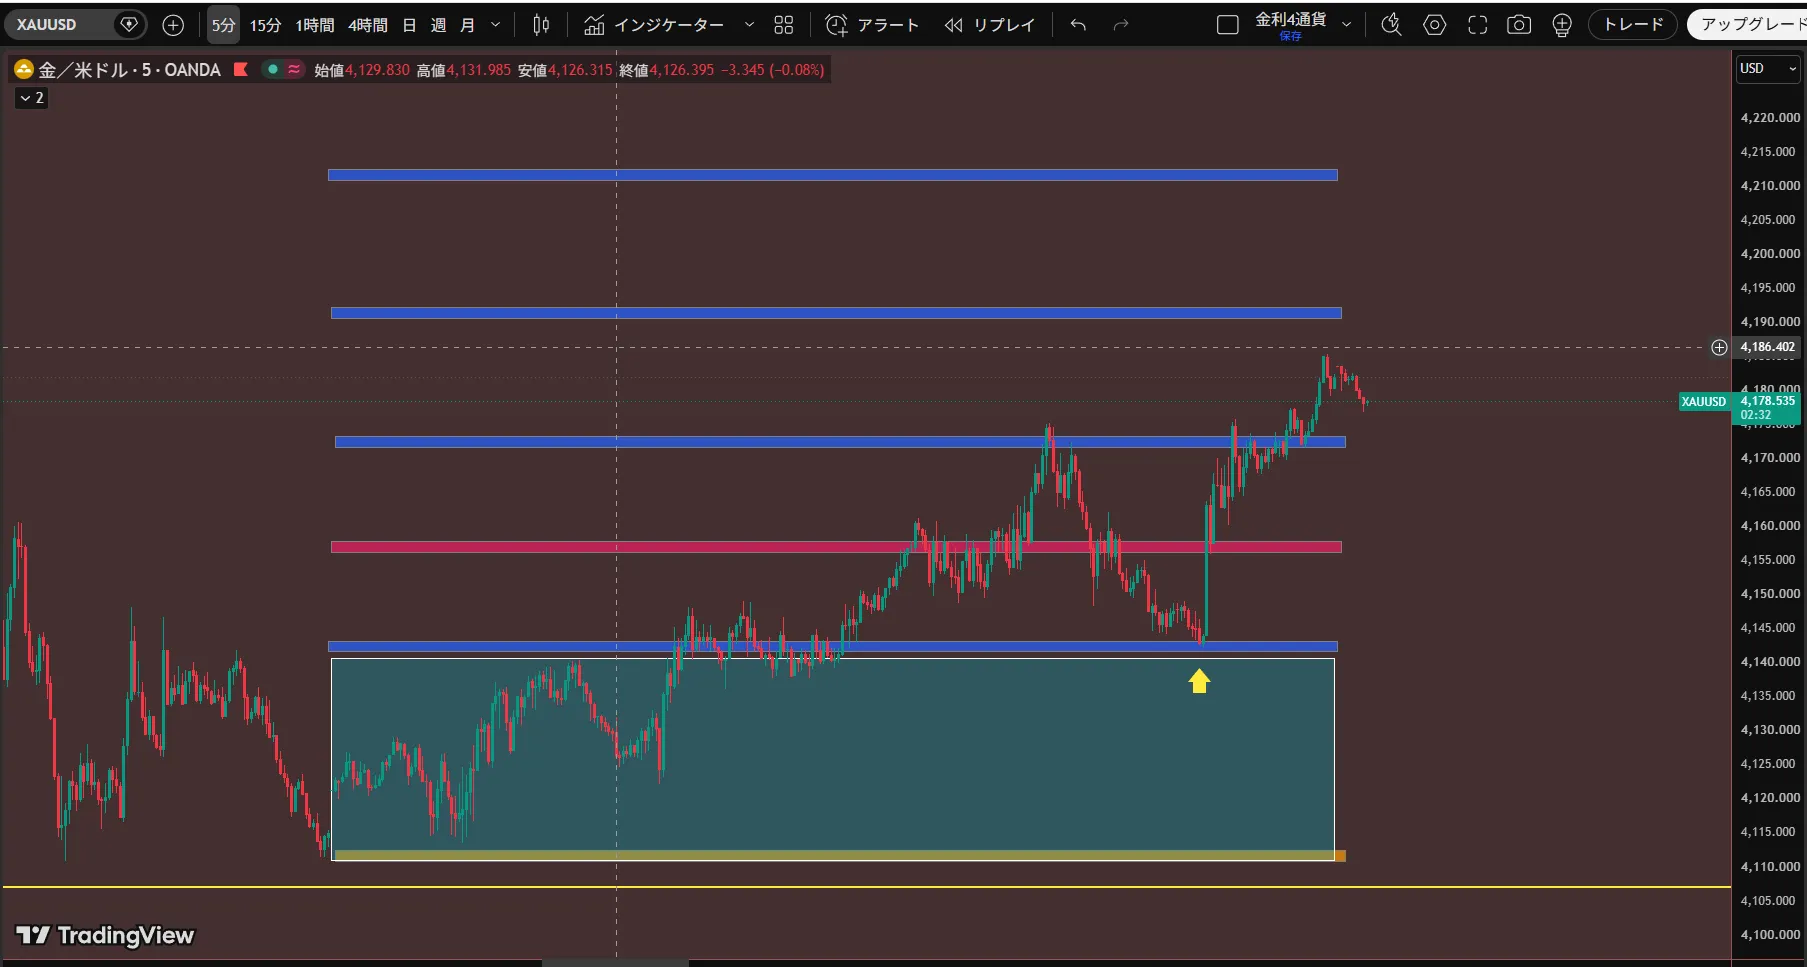
5-minute chart: the blue shaded area is the buying zone of 15M.
The upper boundary of the frame is also a line that often causes rebounds, and here the Koyaji-style zone overlaps.
After consolidation, it rose, right?
Subsequently, a decisive correction formed, making this an ideal buying opportunity.
One thing I want to say is that when individual investors go with the trend, once they cross a certain line, they become targets for algorithmic fuel.
The reason individual investors lose is clear.
Whether you understand this structure determines the outcome of the trade.
※Because results have started to show for students, I will raise the price as soon as the slots fill up.
---------------------------------------------------------------------
GogoJungle Feature
【Investment Skill Share Feature vol.2】The answer born from training with a 10% graduation rate.
A lifelong discretionary trading method directly taught by Mr. Koyaji, with 15 years of side work experience.
https://www.gogojungle.co.jp/info/23491?via=notification
---------------------------------------------------------------------
Second installment following RCI High-Probability Scalping!!
☆ Koyaji-Style Zone Trading × SMC Professional Analysis ☆
---------------------------------------------------------------------
What matters is not “winning” but not getting confused.
If your perspective is off, your effort will not pay off.
If your perspective matches, the market becomes suddenly simple.
A trading method that designs edge from chart structure.
※You can join the online community “The Path to Becoming a Part-Time Pro Trader.”
【Koyaji-Style Zone Trade Method × SMC Praxis Course Video Explanation Only (No Corrections)】
https://www.gogojungle.co.jp/tools/ebooks/76574
【Pro Trader Training 100 Knocks 3-Month Correction Course】
https://www.gogojungle.co.jp/tools/rooms/74700