
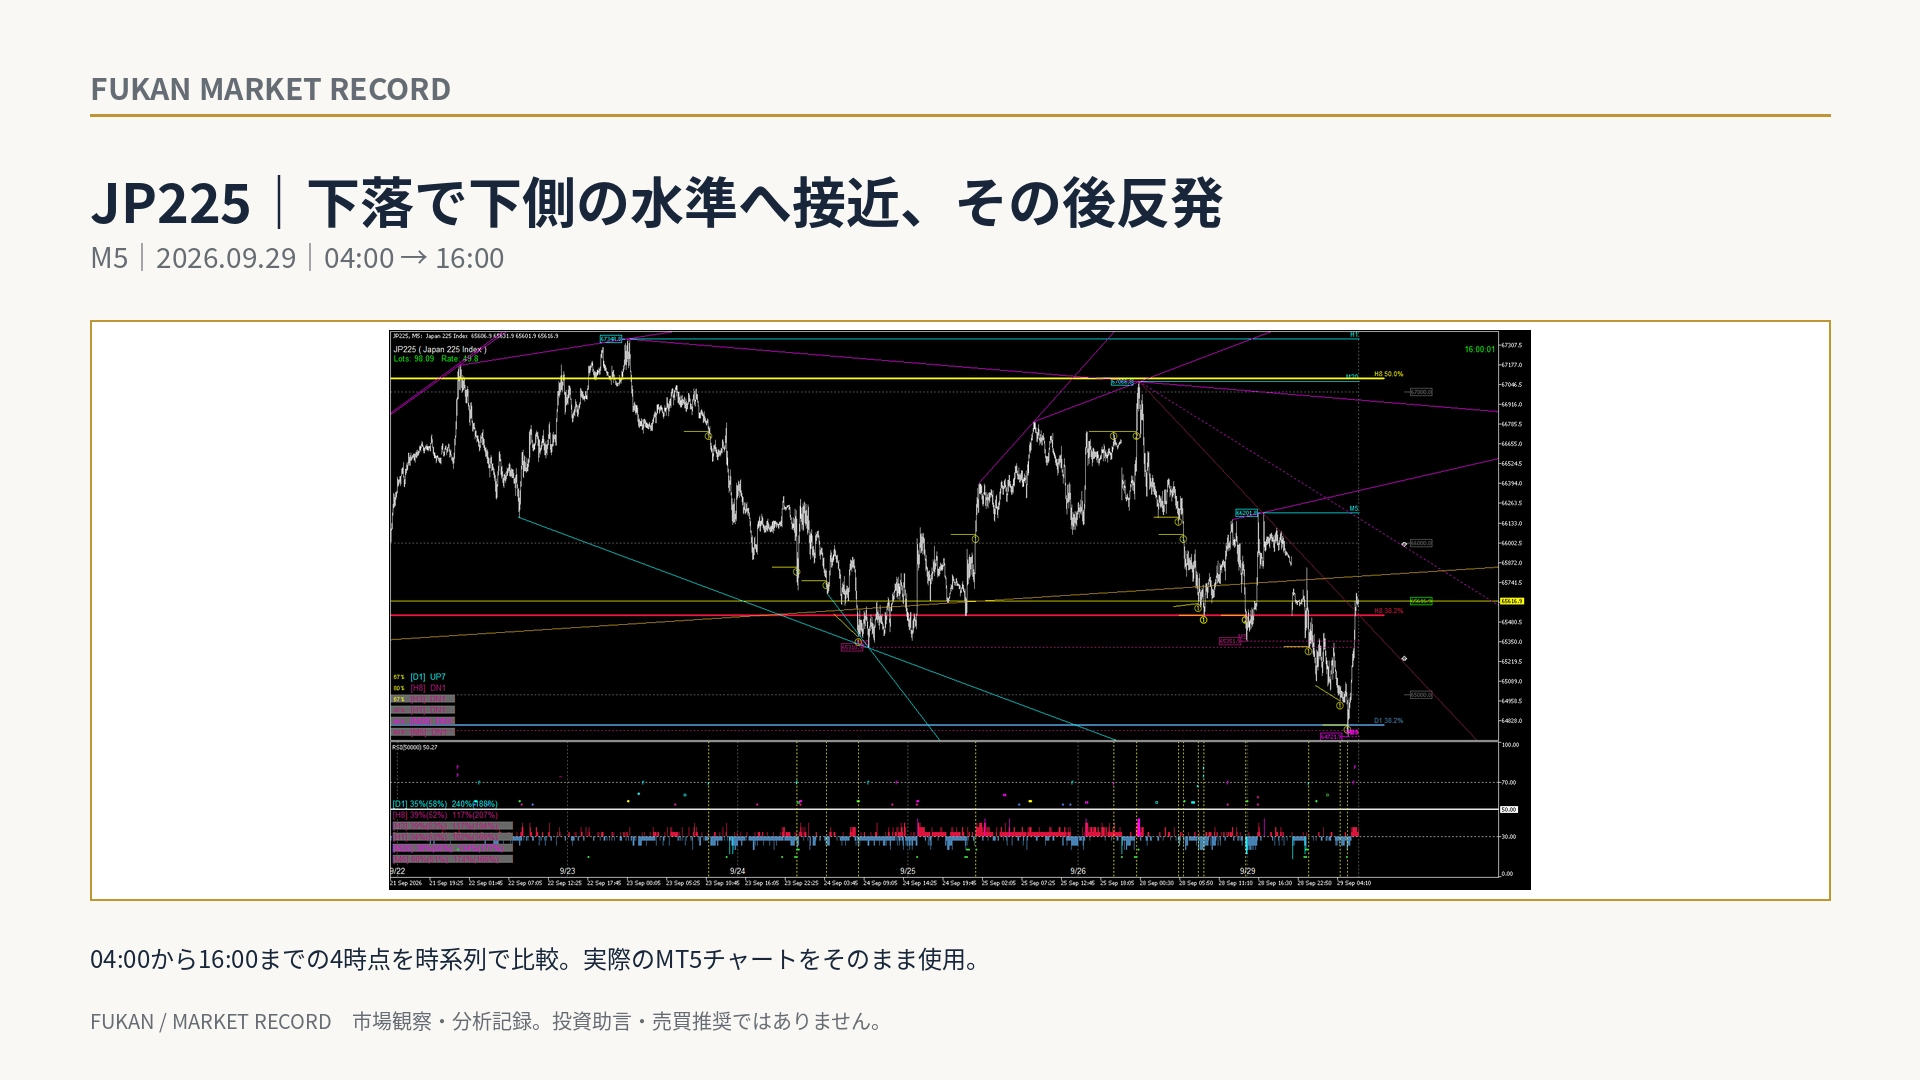
Track the JP225 decline at four time points
Tracking JP225's decline at four points — from approaching the lower levels to the rebound
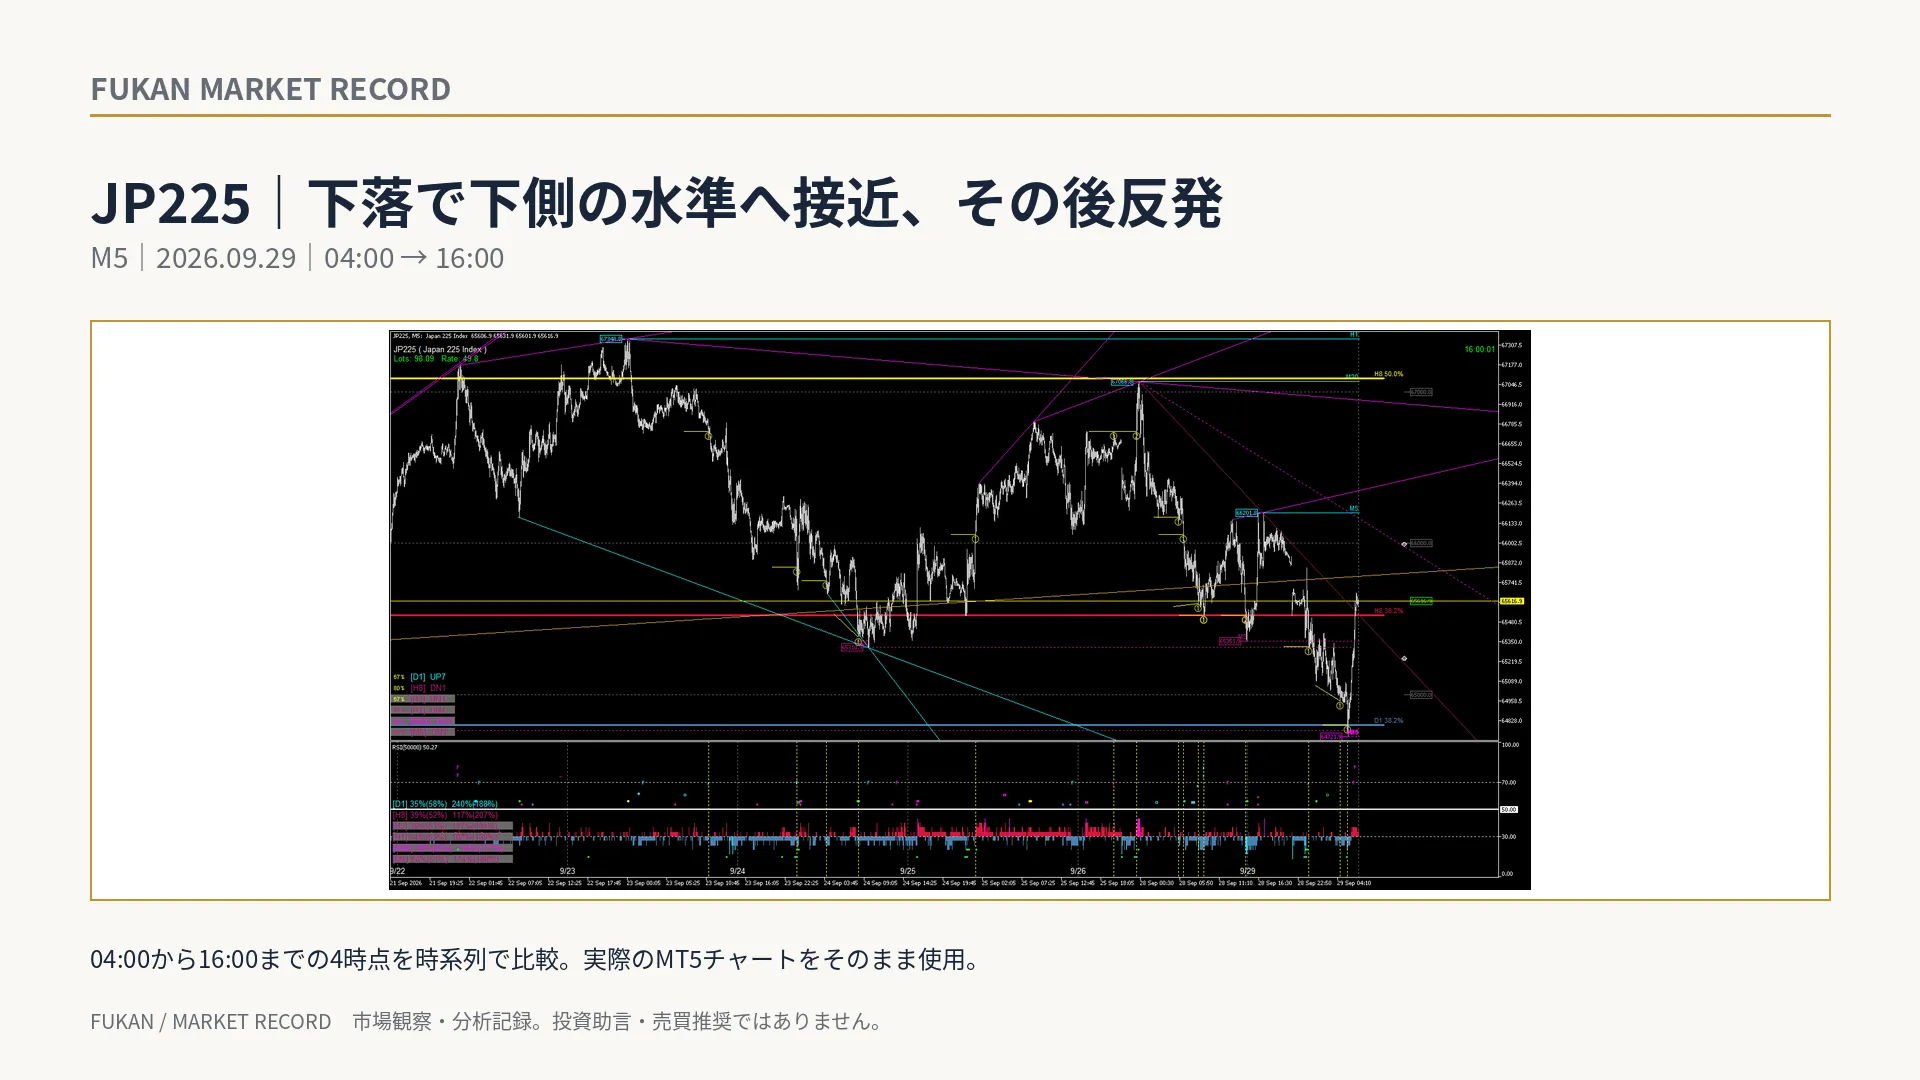
We compare the JP225 M5 FUKAN live screen saved on September 29, 2026 at four times: 04:00, 08:00, 12:00, and 16:00.
What we will look at this time is not only the fact that it “rebounded.” Starting from the 04:00 position, the price moves downward, approaches the lower display level by 12:00, and then a rebound to the upside is confirmed by 16:00 as part of one sequence of events.
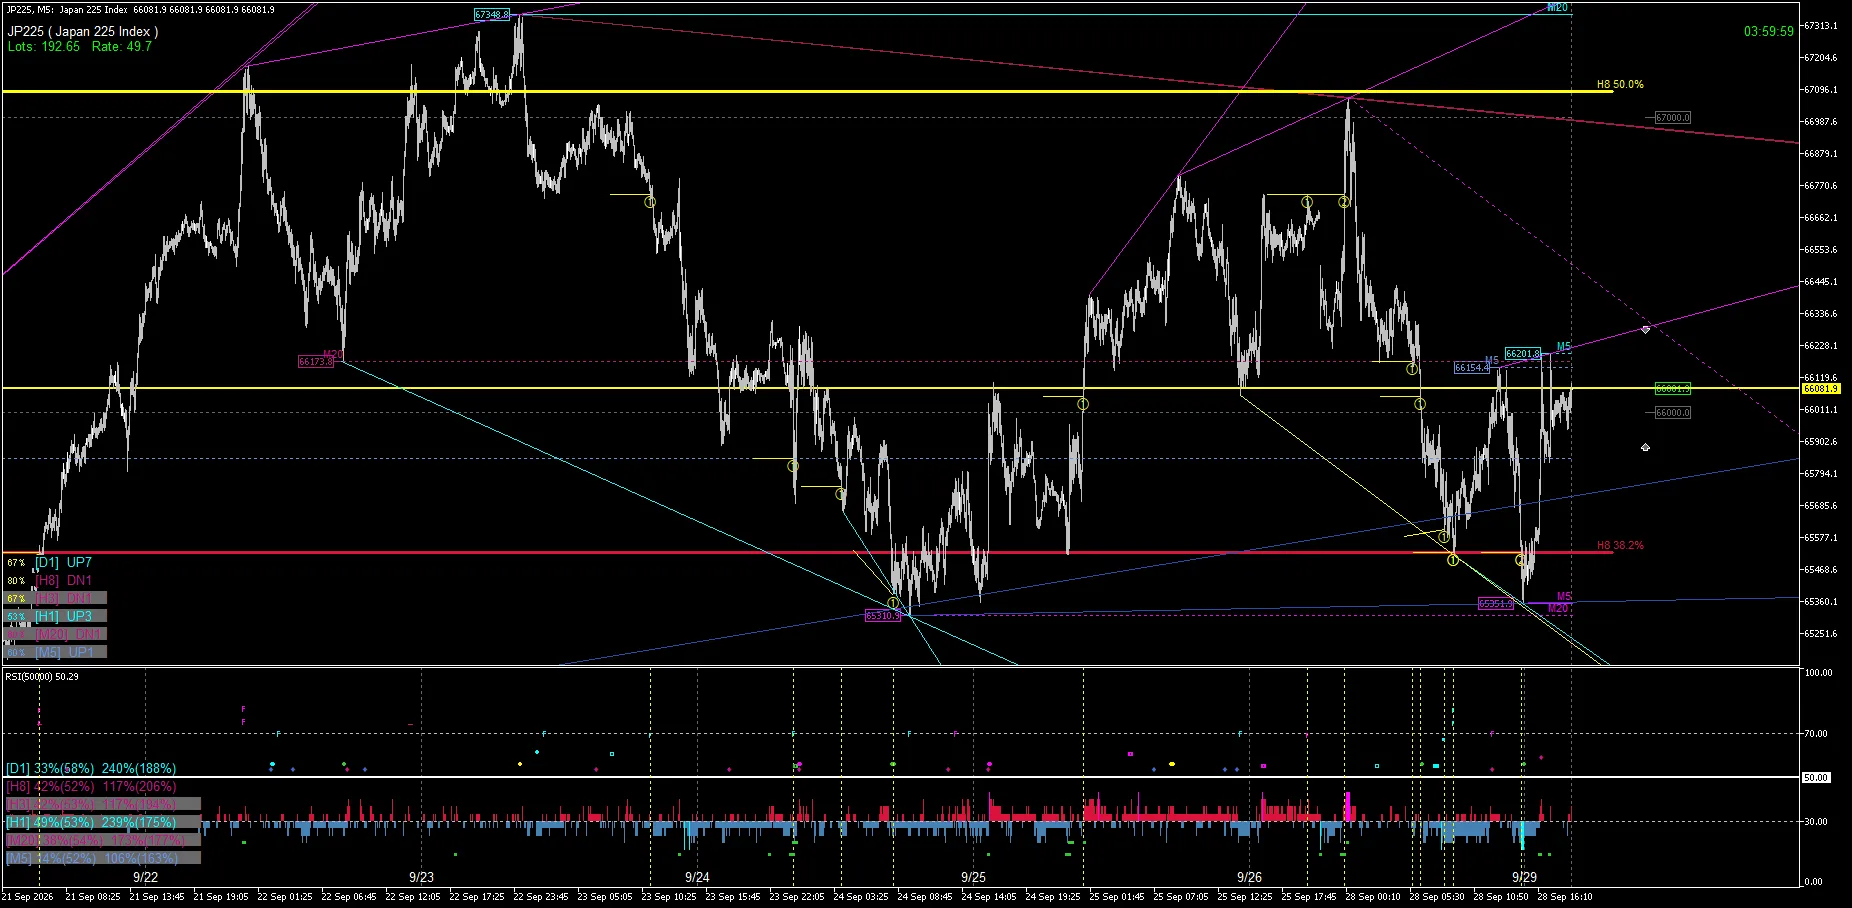
1|04:00 — Starting point of comparison
In the 04:00 saved image, the rightmost price is around 66,081. With lines derived from multiple timeframes displayed, this position is set as the starting point for subsequent comparisons.
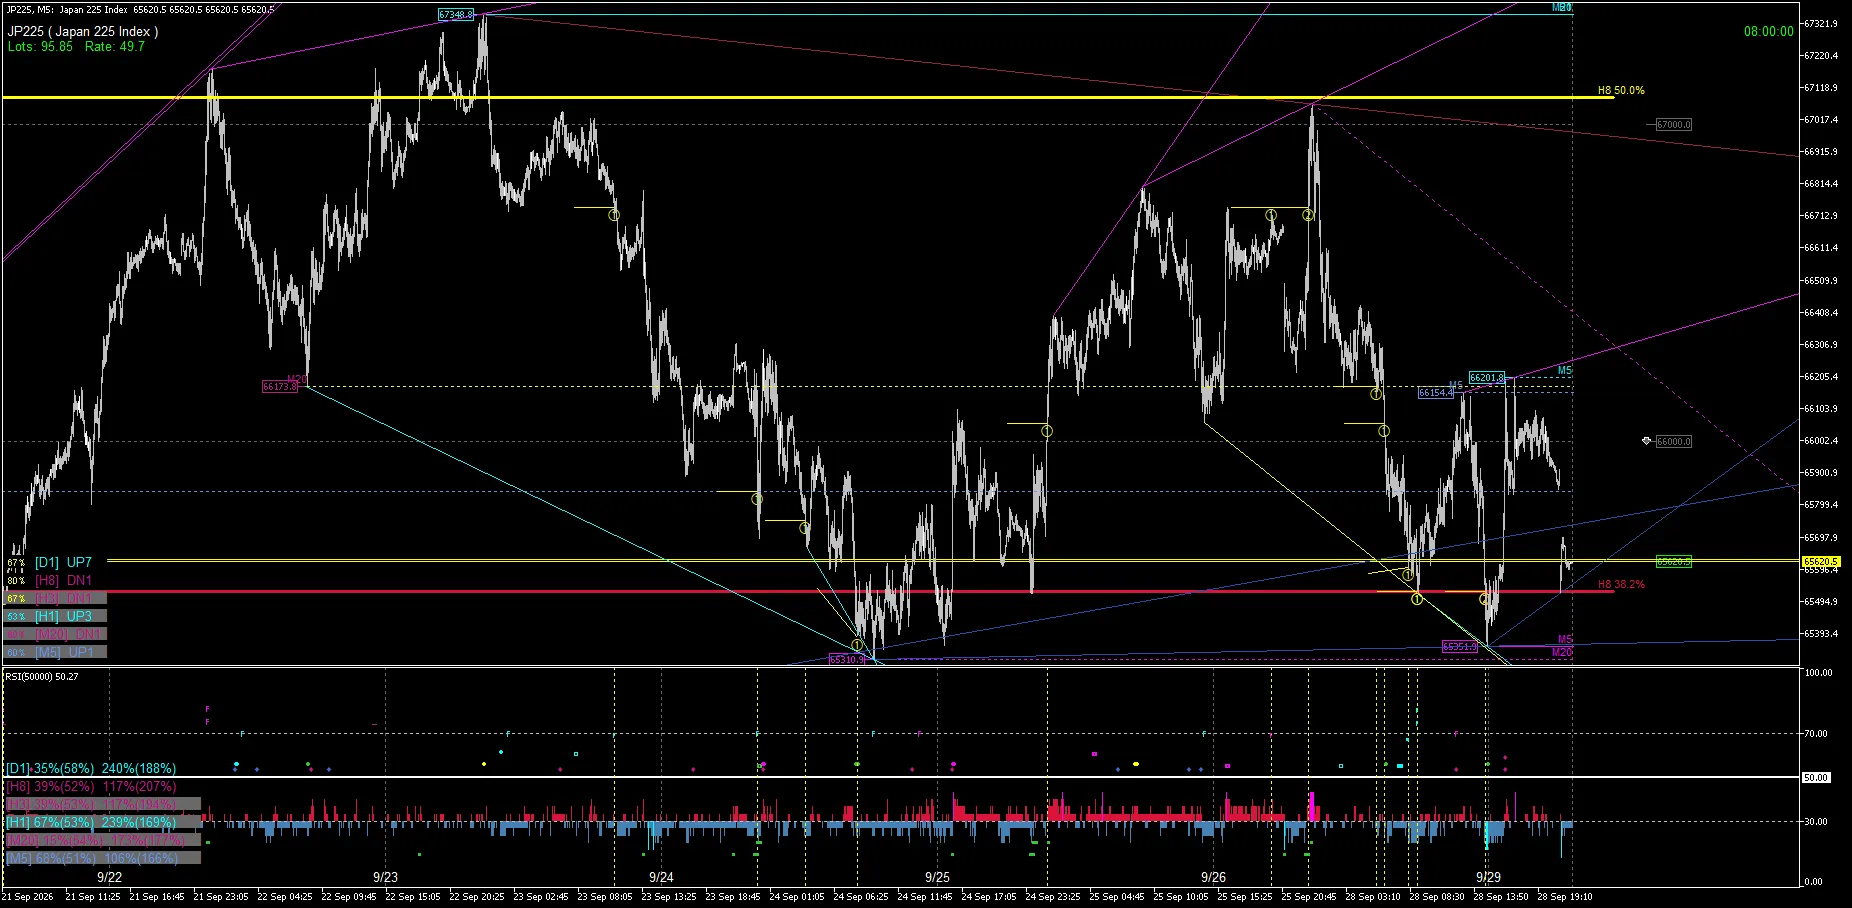
2|08:00 — Moving downward
By 08:00, the rightmost price has fallen to around 65,620. Comparing the same M5 screen as 04:00 shows that the price is approaching the lower display level.
3|12:00 — Toward the lower display level
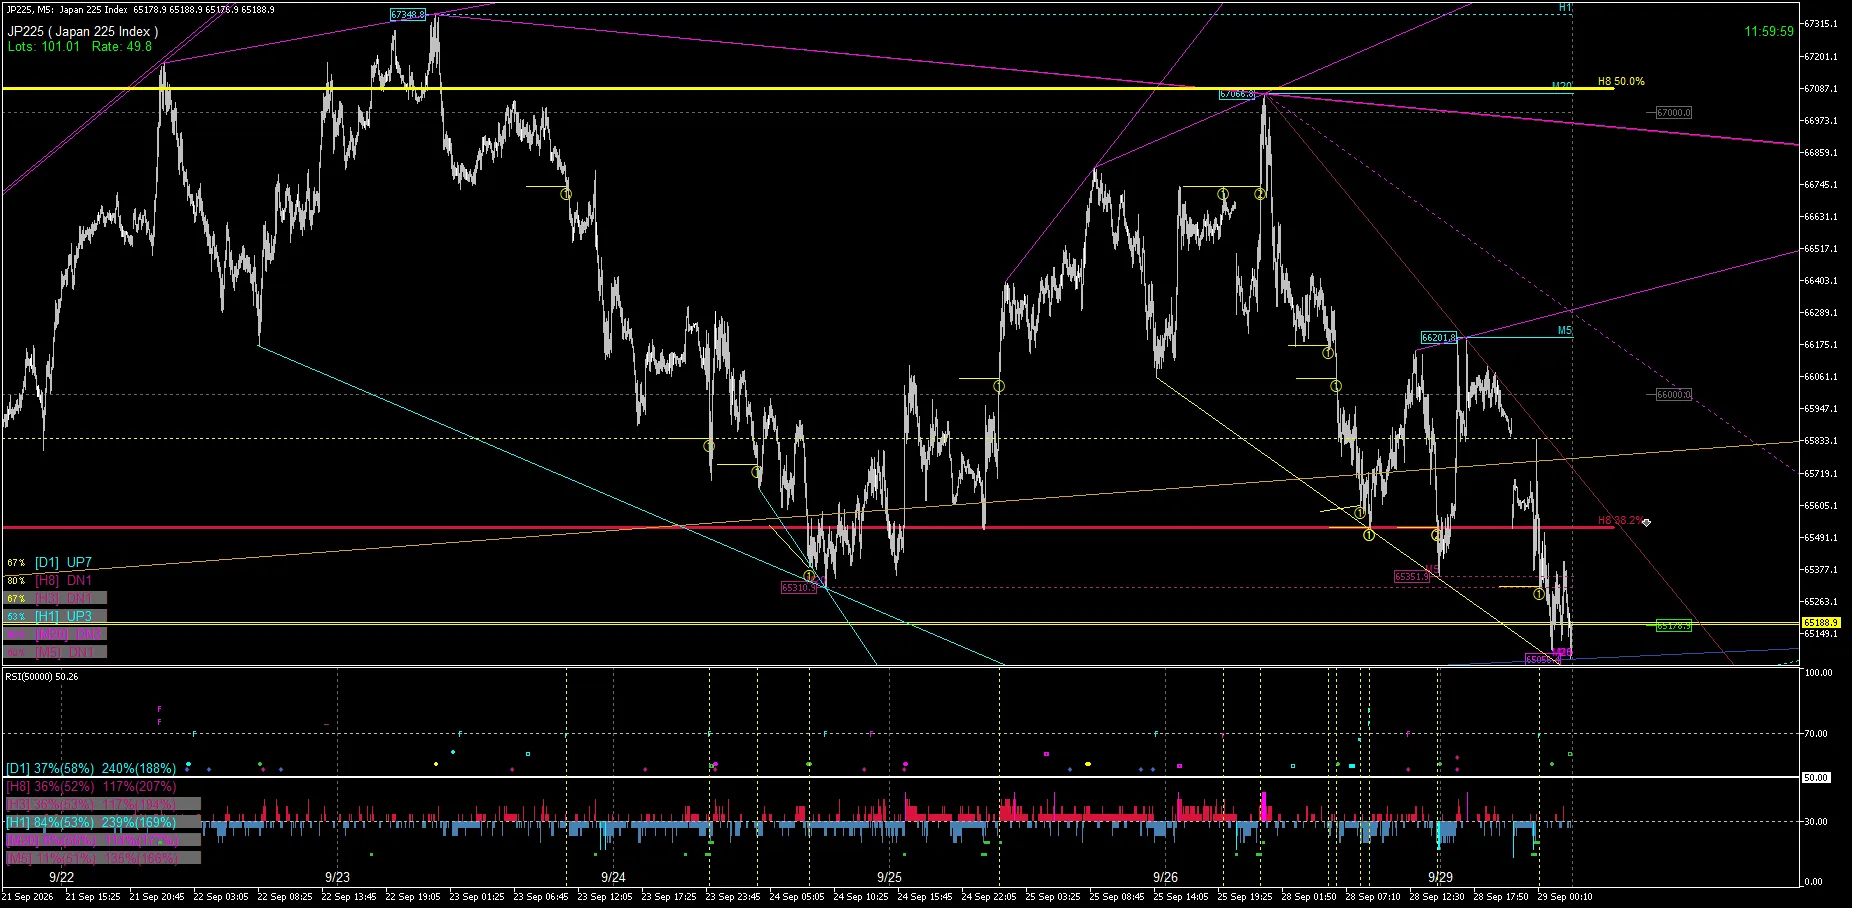
At 12:00, the rightmost price is around 65,189. The price has moved into the region below the D1 38.2% display.
What is important here is not deciding “because it reached the level, it will rebound.” In FUKAN’s Market Record, we preserve the positional relationships visible at that moment and confirm the progression afterward.
4|16:00 — Confirming the rebound after the decline
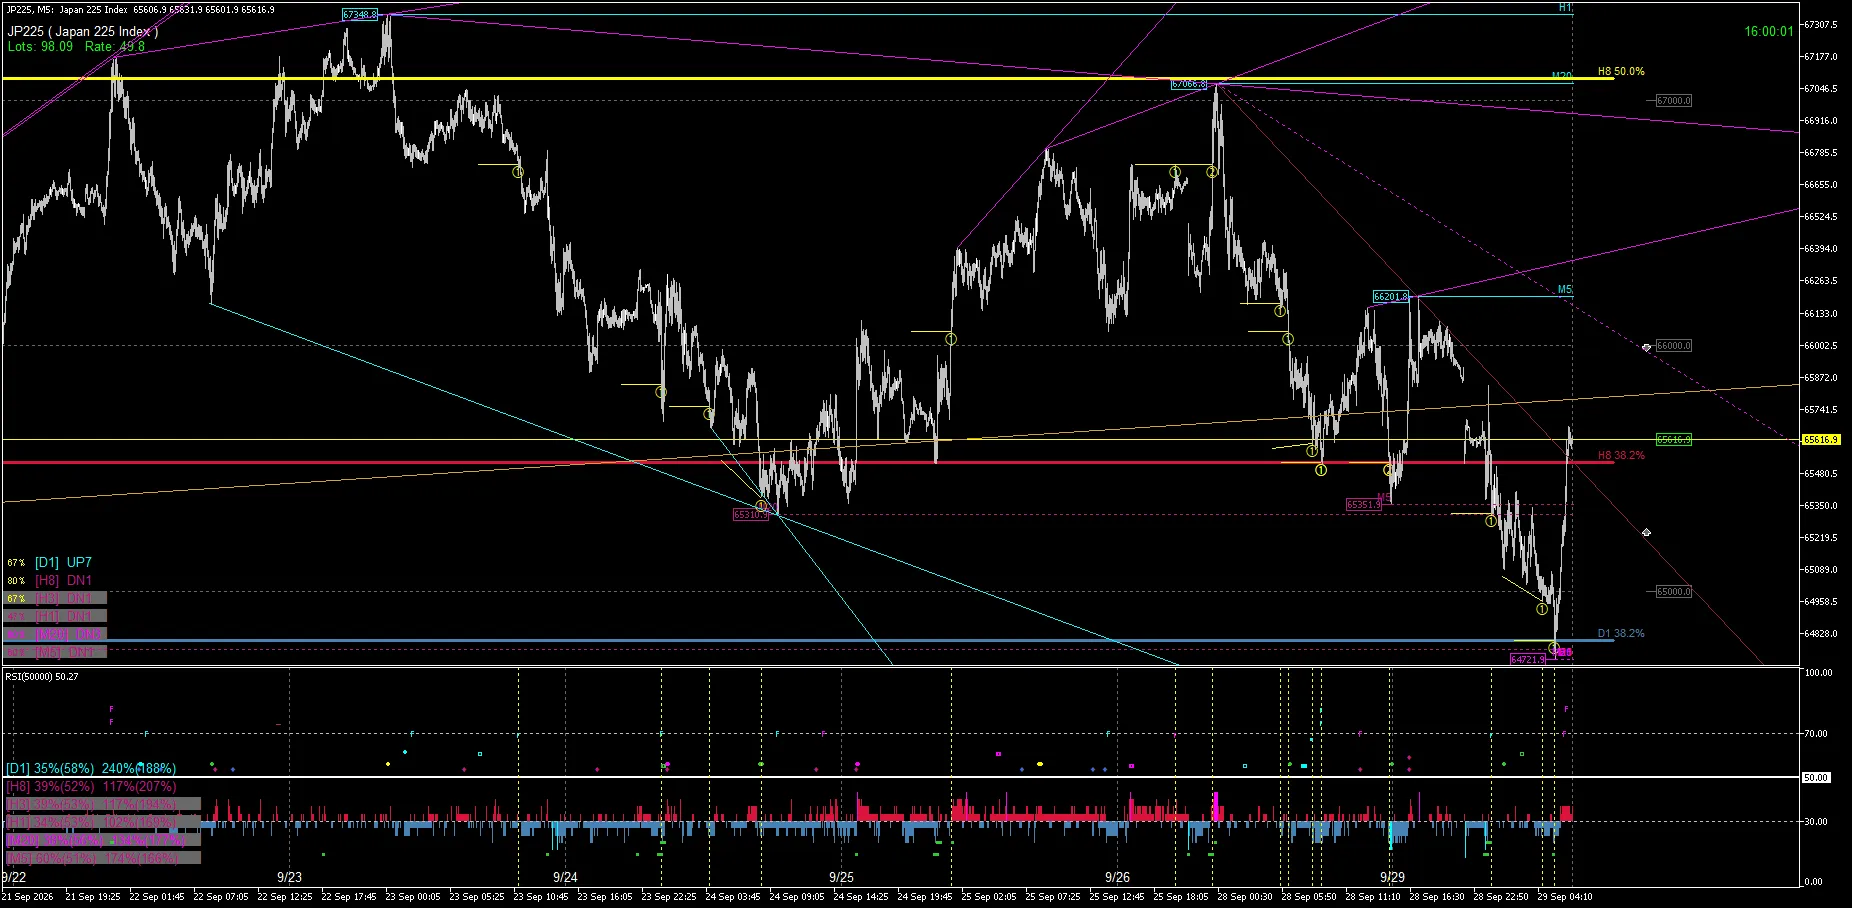
In the 16:00 saved image, the rightmost price has risen back to around 65,617. The decline up to 12:00 and the subsequent upside rebound can be compared under the same display conditions.
What we are watching in FUKAN
FUKAN is not a screen for viewing a single signal. It is used to organize market structure across multiple timeframes on one chart, to confirm where the current price sits, and how its position relative to other levels has changed over time.
In these four frames, the sequence of 04:00 position, 08:00 downward movement, 12:00 approach to the lower level, and 16:00 rebound is preserved. Rather than extracting only the rebound scenario after knowing the result, the purpose of Market Record is to preserve the surrounding context as well.
Summary
On September 29 for JP225, the price moved downward from 04:00 to 12:00 and approached the lower display level. Subsequently, in the 16:00 saved image, a rebound to the upside is confirmed.
From these four points alone, it is not possible to determine the statistical superiority of a particular line or future price movement. We will continue to record not only reactions but also breakouts and non-responses using the same method.
FUKAN offers a 7-day trial. After checking actual MT5 environment displays, operations, and calculation times, you can decide whether to continue using it.
This article is a market observation and analysis record and not investment advice or a buy/sell recommendation. It does not guarantee future price movements, profits, or win rates. The times used are those recorded in the original image.