
The USD/JPY is already in a "reversal game"
Latest version in 2026!!
Here you can watch the interview VTR with GoGoJyan President Hayakawa and me
Announcement of a new product!!
↓↓↓

As a side note, knowing this method
New Billionaire Trader's Scalping with Volume Plus
FX trading unlike ordinary pairing
If you undertake this, the mind will be cleared about the reversal moments I write about daily in Investment Navigator, and you can trade with focus.
Good evening, everyone.
Today's USD/JPY price range up to now is about 50 pips from the recent drop, which is the day’s largest range.
If you keep in mind the high and low during Tokyo time as I always article, you can react more easily when it moves.
If there is a Billionaire Trader chart there, you can almost surely catch the initial move perfectly and trade winningly.
The market moves as it wants to move, and in the end, the market is always right.
Regardless of our forecasts or predictions, the market's result is everything.
That means you need chart-reading aligned with market moves and methods that fit them.
This applies not only to trend-following trades with a pure breakout, but also to trades from reversal points I always discuss.
How you face the chart changes the quality and results of your trades.
And there is a product that makes this incredibly easy to understand and implement
.
More than 1000 users have purchased it, but if you haven't made it yours yet, it's a good opportunity to start from the beginning and put it into practice.
There are many Billionaire Trader technique articles in this Investment Navigator as well, so please use them as a reference and aim to upgrade your own skills.
Today’s USD/JPY seems to have moved up to a certain extent.
Since it’s Monday and the range is about 50 pips, I think it will range within this 50-pip width from now on.
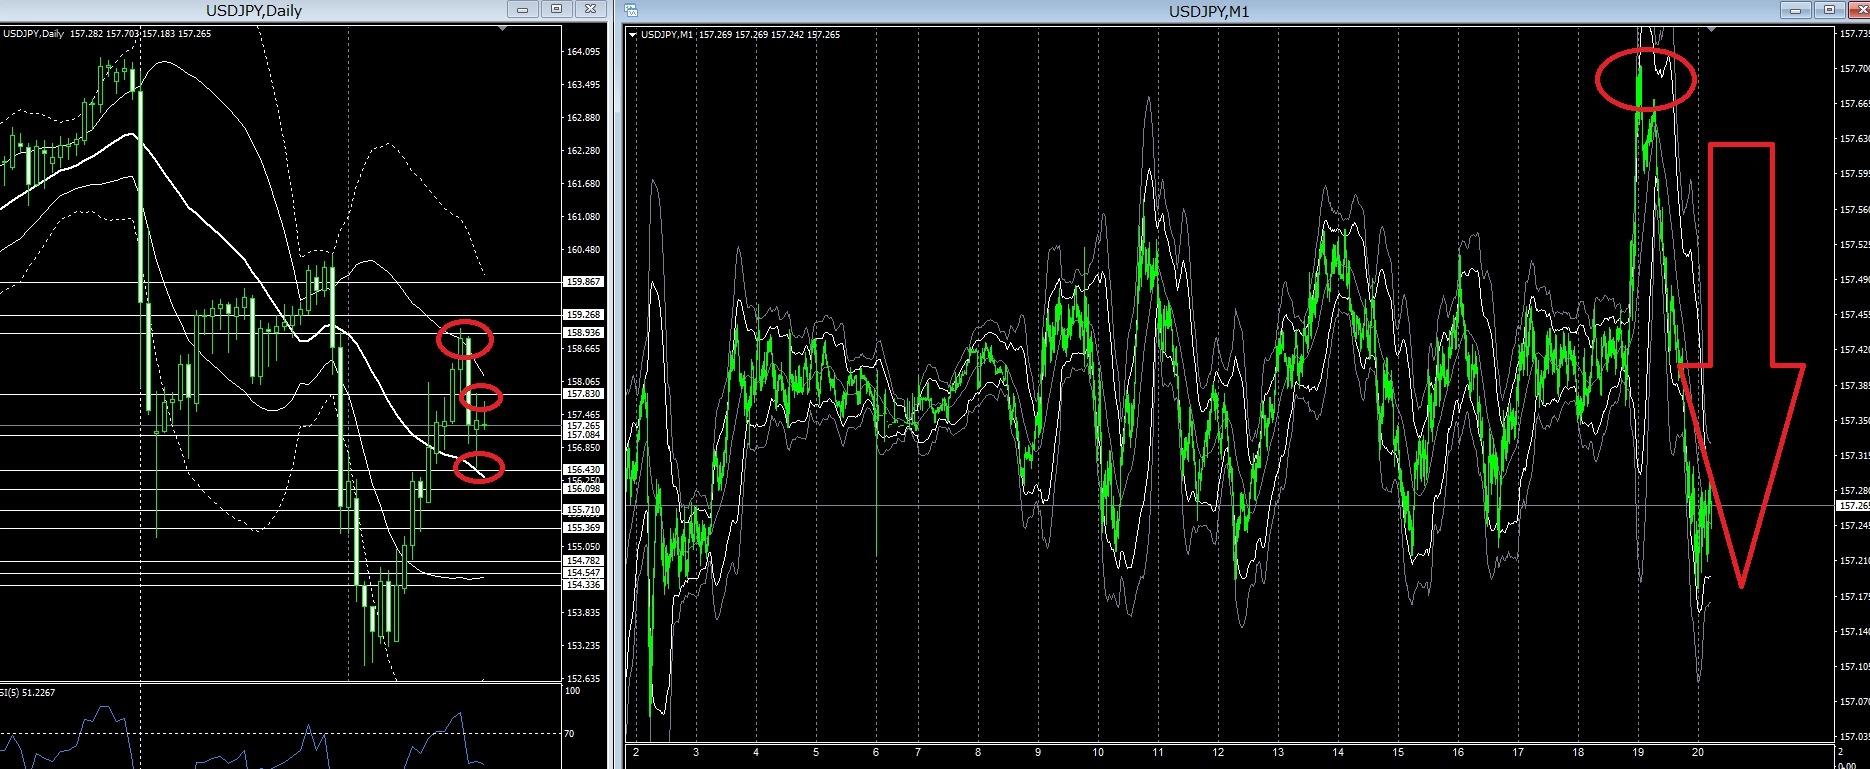
USD/JPY MT4 Daily chart & 1-minute chart
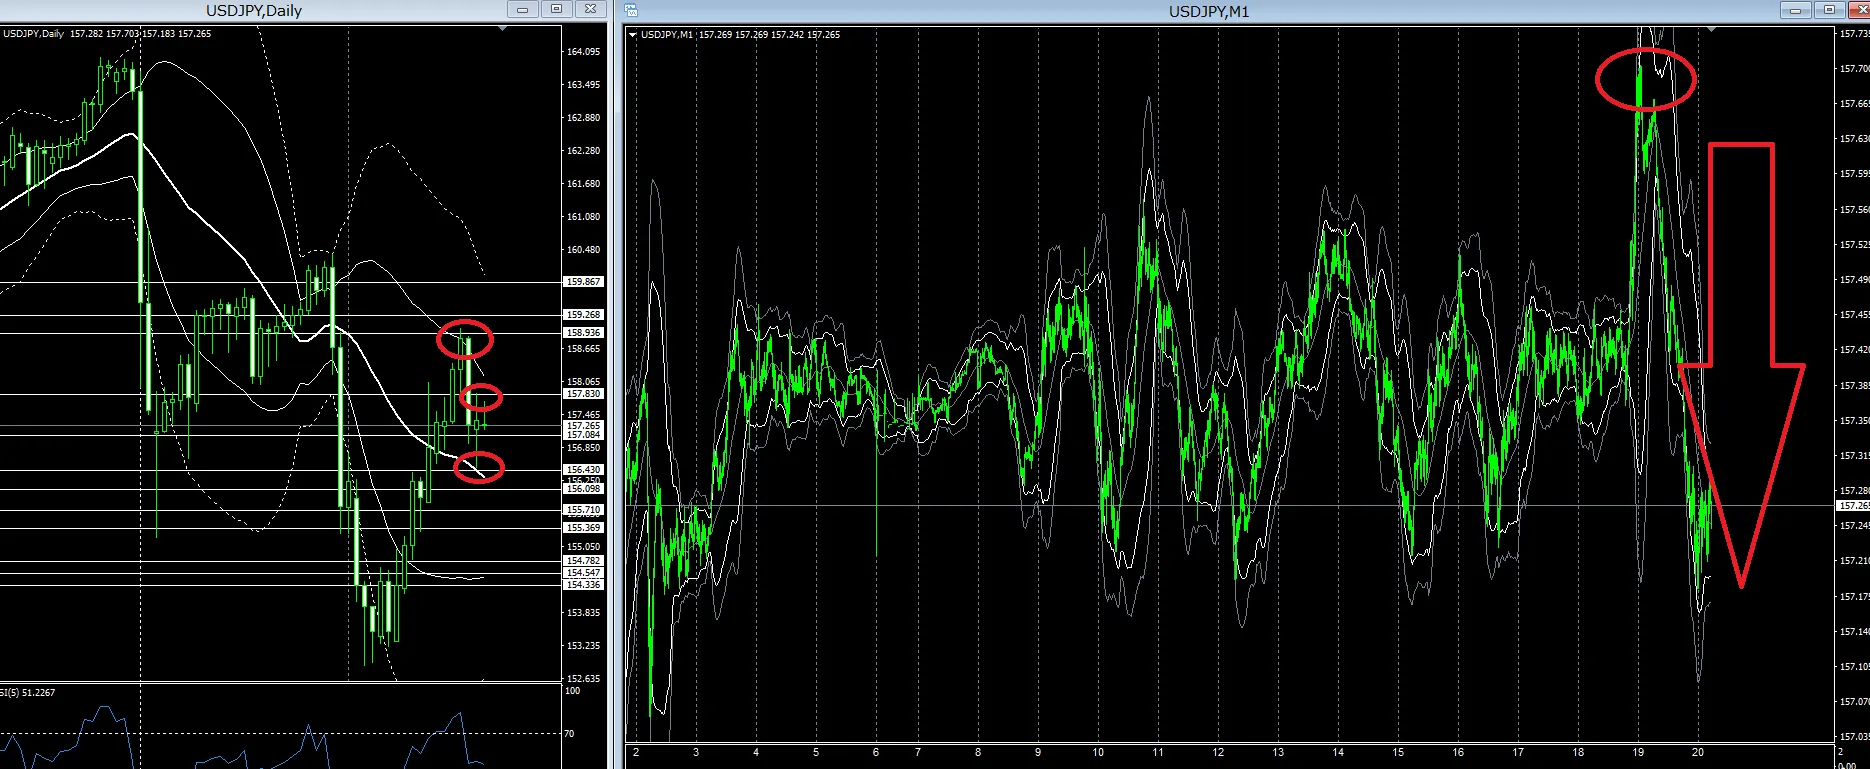
The red circles on the daily chart mark the reversal points of the last four days.
Because it’s a daily chart, moves are slow, but after returning home, if the price reaches the red circle, you should take inner positions without hesitation.
The white multiple horizontal lines are Billionaire Trader lines on the daily chart.
They generally touch precisely and then reverse, so it’s a signal.
This Billionaire Trader line wasn’t drawn just now; it was drawn several days ago.
It’s a price line derived from past statistics, so it’s a highly accurate line.
This is how you look for “reversal points” with such tools.
To the right is the 1-minute chart.
From the morning, there was about a 30-pip range, but just now it broke up and subsequently fell about 50 pips.
On the daily chart it’s a red circle, but on the 1-minute chart the Billionaire Trader chart shows signals to buy turning to sell.
Anyway, if today or in the next few hours the Tokyo high/low is reached, wait for the Billionaire Trader chart on the 1-minute to indicate reversal, and once it reverses, take positions in the direction of the reversal.
The rules are simple.
Simplicity prevents confusion, and when patterns are standardized, traders understand easily—this is the hallmark of Billionaire Trader.
How quickly you build your own trading will determine your future, but traders who have not yet reached that level, please try Billionaire Trader and make it yours.
Now this week there is an employment statistics release.
U.S. indicators have become less impactful.
If it moves, just trade it.
More than anything, current USD/JPY volatility is tasty.
It’s a favorable environment to profit with Billionaire Trader or with unconventional hedging.
Don’t miss the wave, but don’t panic.
Wait calmly.
Wait, wait, and finally take a big position.
I believe this is exactly the kind of market we’re in now.
Thank you for your continued support today as well.
For traders who absolutely want to succeed in trading and earn a living from trading, this is the recommended product—also learnable on your own—these trading techniques are below:
FX methods discovered by verifying the trading histories of super traders