

【GOL MARKET NAVIGATOR】GOLDだけじゃない!6銘柄・8チャートで見る「迷わずENTRY」の実践
GOL MARKET NAVIGATOR|Practitioner Record on September 28
Not only GOLD.
6 instruments and 8 charts
ENTRY and subsequent price movements
One chart per currency: USD/JPY 1 chart, EUR/USD 1 chart, GBP/USD 2 charts, AUD/JPY 1 chart, GOLD 2 charts, GBP/JPY 1 chart. We publish the September 28 charts ordered by currency.
After the signal, how did the price move?
GOL MARKET NAVIGATOR displays ENTRY candidates for S・A・H・B, ENTRY・SL・TP lines, and NO skip indications all on one screen. Please review on yesterday’s chart where you would have entered and where you would have skipped chasing.
① USD/JPY|Dollar/Yen
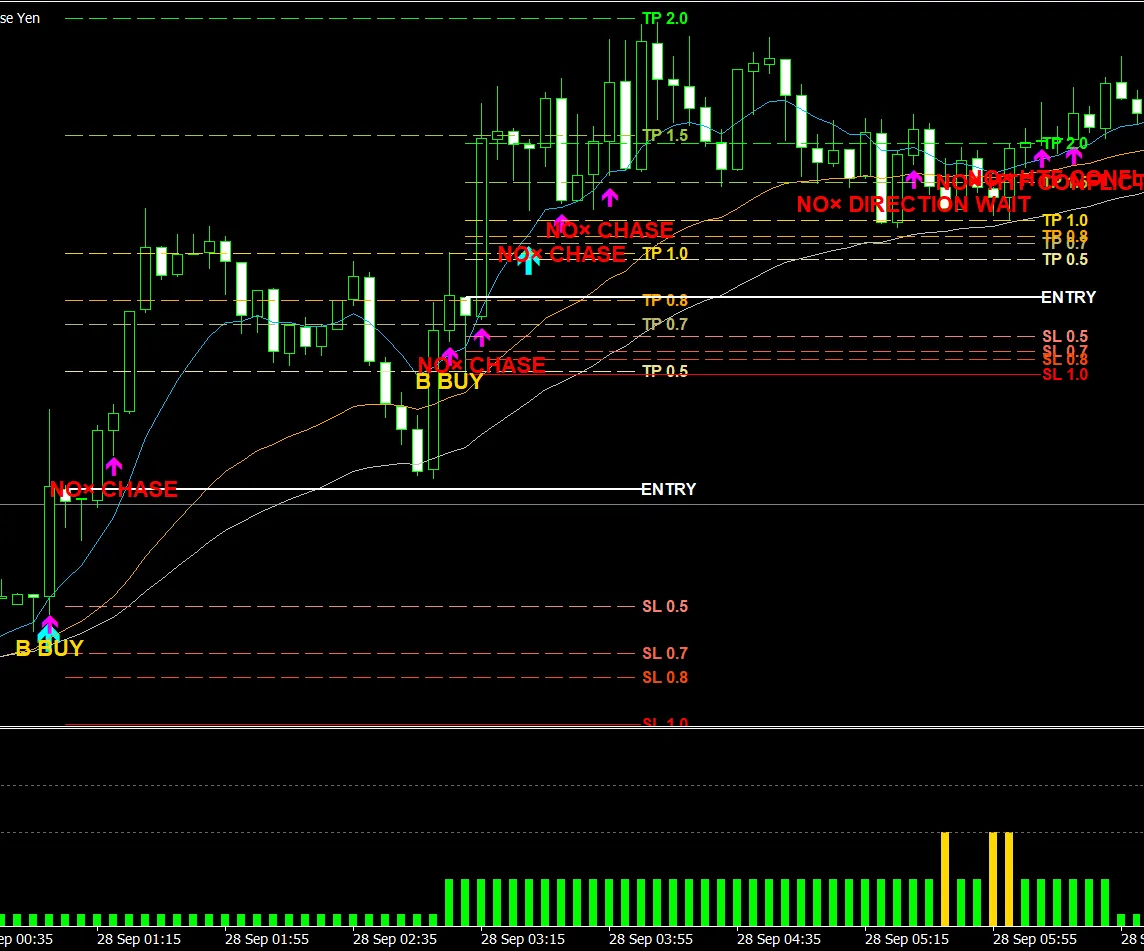
B BUY to TP2.0 line
It rose after the B BUY and reached the TP2.0 line on the chart. On the way up, NO×CHASE is also displayed. This is a moment where you can see the entry position and the position where you should not jump on later in one chart.
② EUR/USD|Euro/Dollar
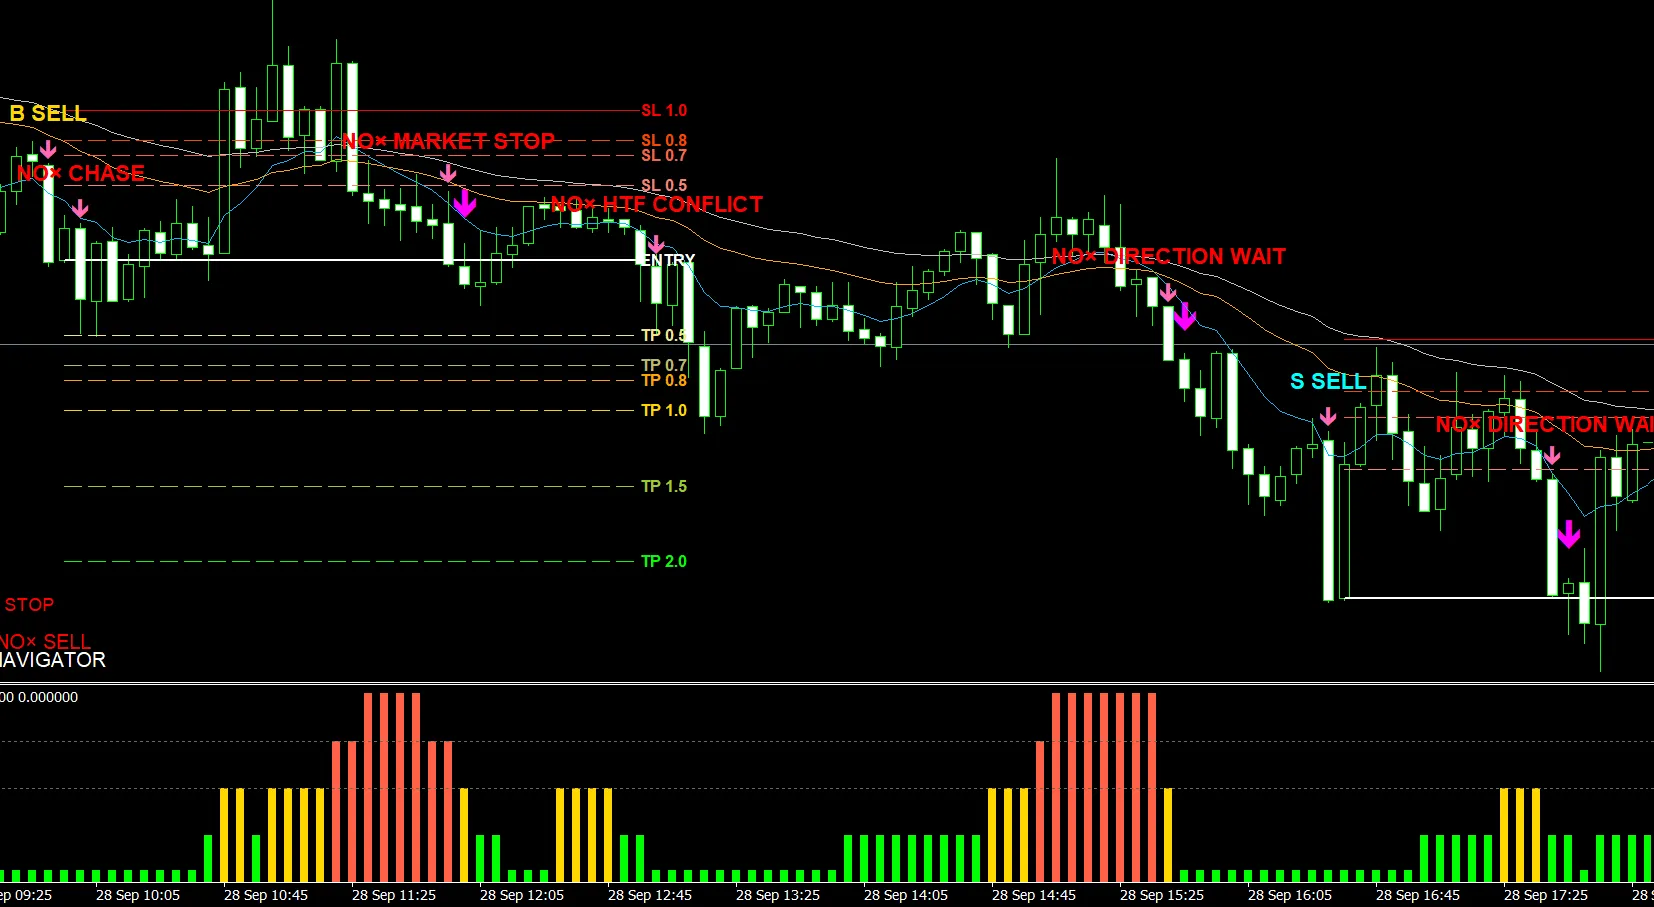
SELL candidates and NO judgment
Display of B SELL・S SELL and the subsequent downward price movement. Market STOP and HTF CONFLICT also appear along the way. This is a chart where you can not only look at the SELL direction but also confirm the conditions to skip.
GBP/USD|Pound Dollar・2 charts
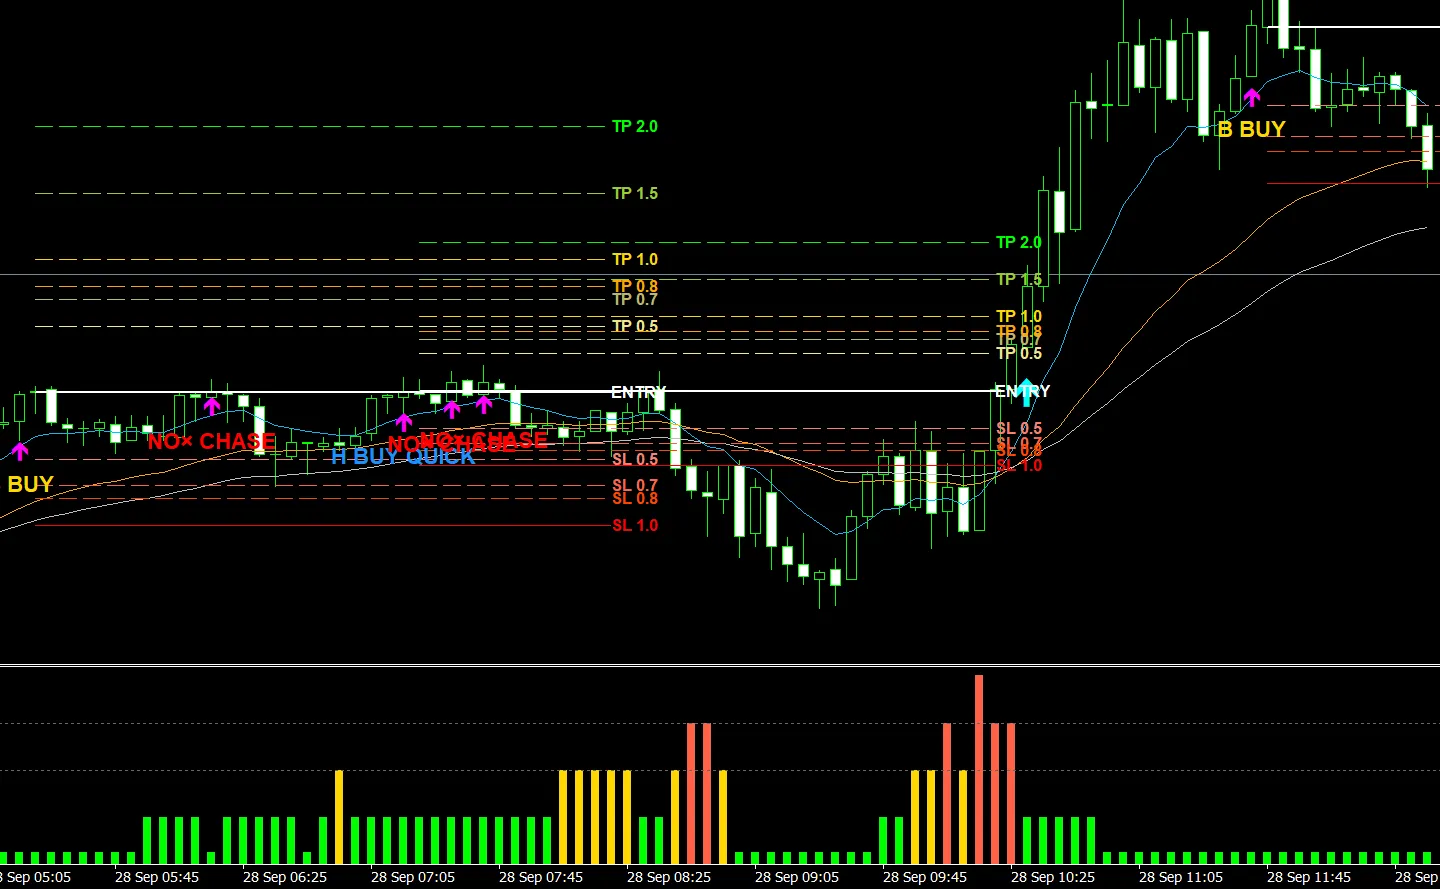
③ Large rise on the BUY side
Chart with H BUY QUICK and B BUY indications. In the latter part, the price rises sharply and crosses the TP2.0 line.
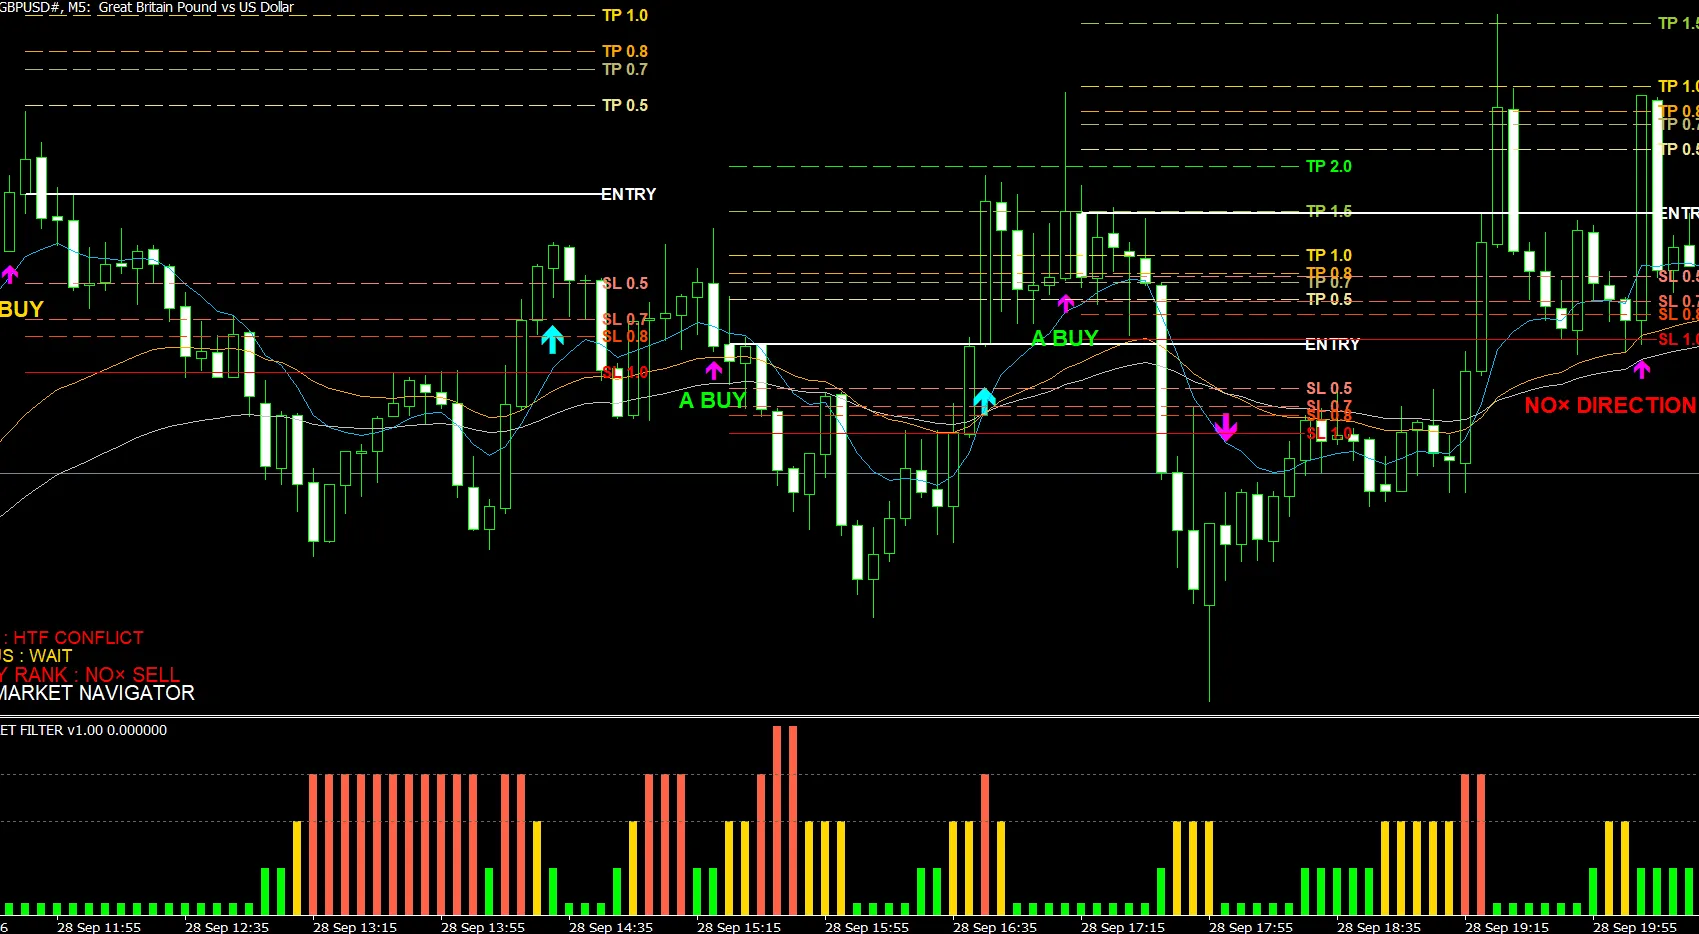
④ A BUY and ENTRY・SL・TP
This is also GBPUSD. It shows A BUY candidates along with ENTRY, SL, and staged TP. Includes the wobbling movements and is published as is.
⑤ AUD/JPY|Australian Dollar/Yen
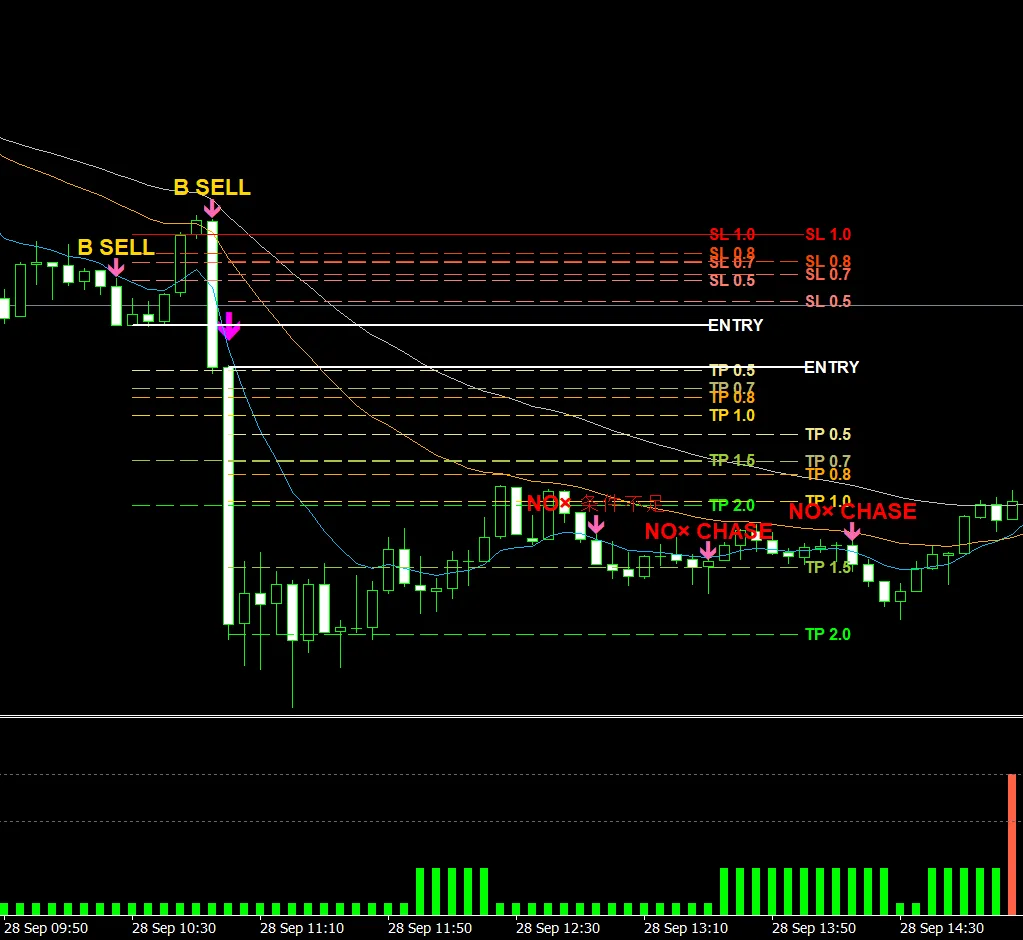
Sharp drop after B SELL
After B SELL, a large drop. The price crosses the chart’s TP2.0 line. Please regard the NO×CHASE afterward as a decision to refrain from chasing.
GOLD|2 charts
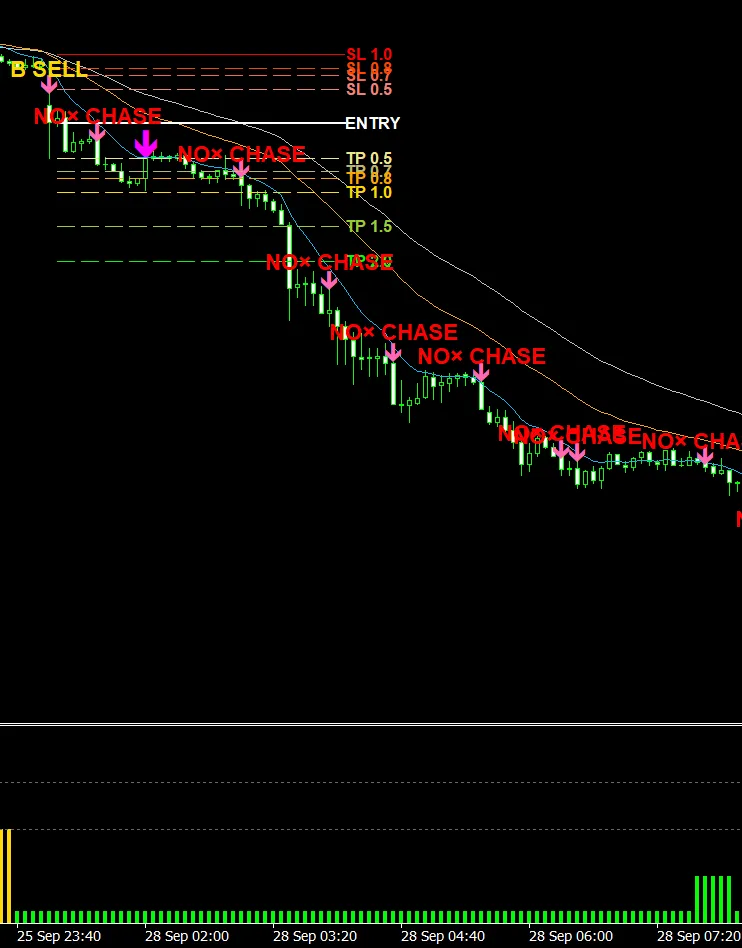
⑥ Decline following B SELL
After GOLD’s B SELL, the decline continues and passes the TP2.0 line. After movement, NO×CHASE repeatedly appears, illustrating the difference from chasing.
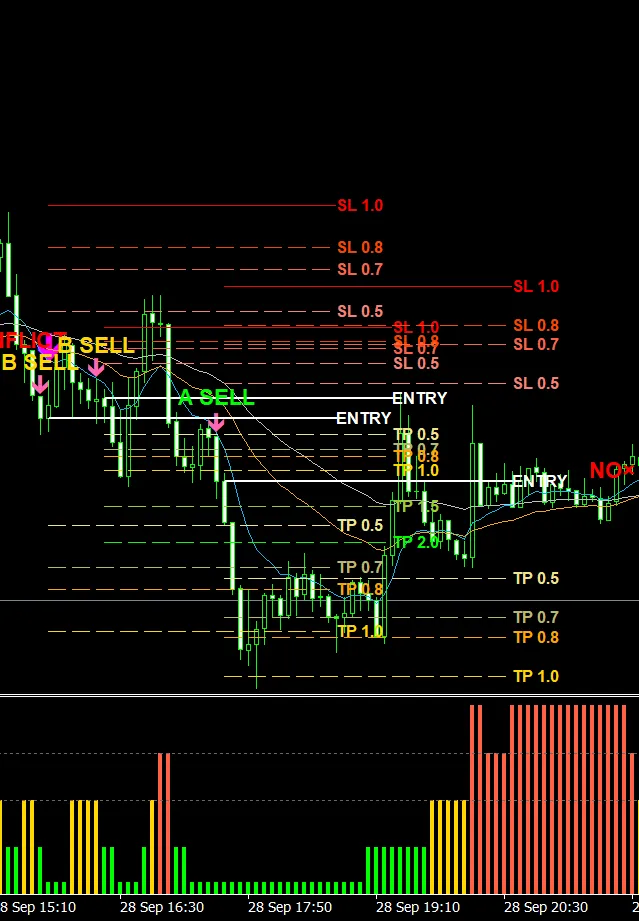
⑦ B SELL・A SELL and subsequent rebound
Displays multiple SELL candidates, ENTRY, SL, and TP positions. Fits the rebound after a decline into one chart, allowing observation of price movement changes.
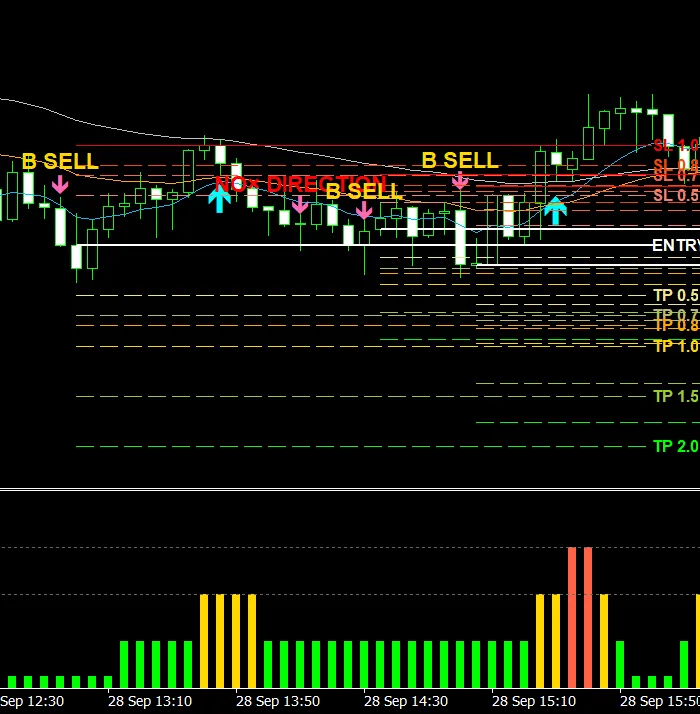
⑧ GBP/JPY|Pound/Yen
Changes after SELL candidates are also published
After the B SELL candidate, price movement shifted upward. We publish not only the extended charts but also moments where judgment becomes difficult under the same criteria.
If it’s S・A・H・B, then ENTRY candidate. If NO, skip.
Where to enter, where not to chase from, where to place SL and TP. GOL MARKET NAVIGATOR displays these decision factors on the chart.
※The published images are records of signals and subsequent price movements. Passing the TP line on the chart does not indicate actual execution or realized profit in a live account. Trading results vary depending on settings and execution environment.