
Release/AI WAVE MT5 【Visualize Growing Waves】
Why GOLD trading ends with “Chicken Take-Profit”? AI WAVE reveals the secret of “100% breadth capture”
1. The moment profits appear, you want to “flee”
The entry is perfectly hit, and unrealized profit begins to soar smoothly…
But do you not feel a tightening anxiety the moment you see one candlestick close as a bearish candle?
“What if it returns to breakeven?”
“Before profits fade, I should lock in now.”
Thinking that, you press the take-profit button after a few dozen pips, and the chart then charges in the direction you aimed for, exploding to 100 pips, 200 pips…
Conversely, in a loss scenario, you cling, thinking “it will come back someday,” and a single loss wipes out several trades’ profits in one go.
This is the so-called“small profit, big loss (dollar-cost averaging catastrophe)”loop. Even with a decent win rate, monthly net results are often negative. Many people struggle to escape this dark tunnel.
2. The true nature of Chicken Take-Profit is not “mentality” but “absence of destination”
Many traders retreat into the mental-talk trap, saying, “my mentality is weak, so I can’t extend the take-profit.” But that is a big mistake.
The real reason you bail out halfway is not a lack of guts, but
that you cannot see objectively where the market is aiming (the destination).
3. Case study: Entry rationale and the destination with justification in a “simultaneous set”
So, how can we overcome Chicken Take-Profit and extend profits to the end of the wave?
Please look at an actual GOLD (M15) trade example.
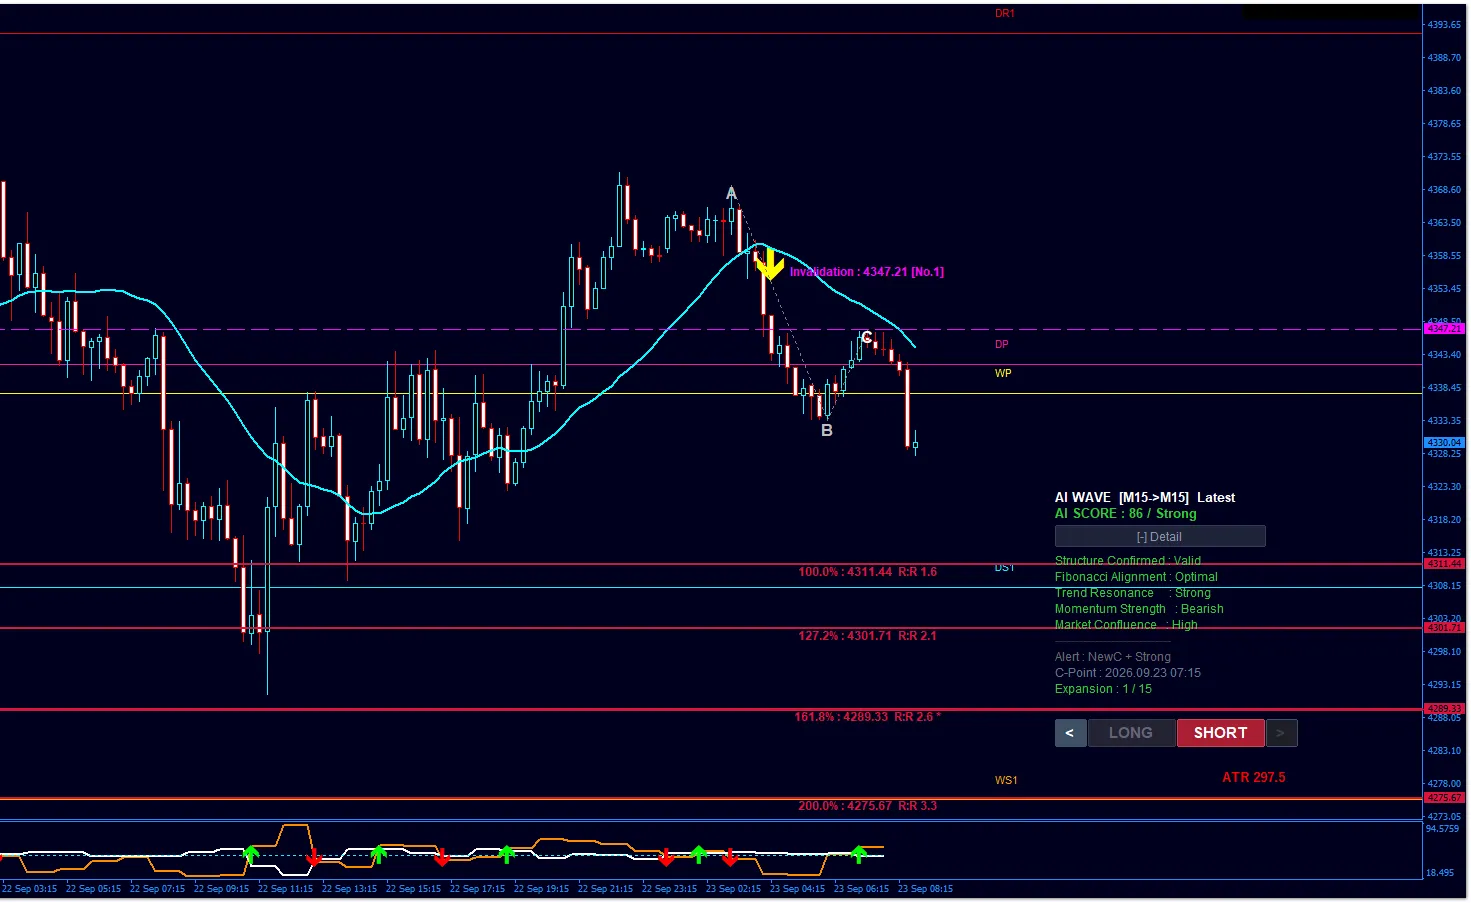
【Image ①】2026-09-23 AM 10:45
GOLD STREAM yellow arrow signal illuminated
+ Wave detection by AI WAVE (AI SCORE: 86)
First, the yellow downward arrow at the top of the screen isthe way to sell signal for “GOLD STREAM.”It captures the moment market momentum shifts toward the downside precisely.
And at the same time as that entry, please also look at the panel at the bottom right.
“AI WAVE”immediately detects waves where A (origin), B (push/pull), C (start of propulsion) become momentum, and calculates a high-confidence score“AI SCORE : 86 / Strong”showing a very high reliability score.
The moment you enter, the chart automatically draws out each target breadth (target lines) of 100%, 127.2%, 161.8%, and the final destination target“200.0% (4275.67)”with a clear risk-reward ratio.
4. Result: Cut noise, reach the 200% target (risk-reward 1:3.3)
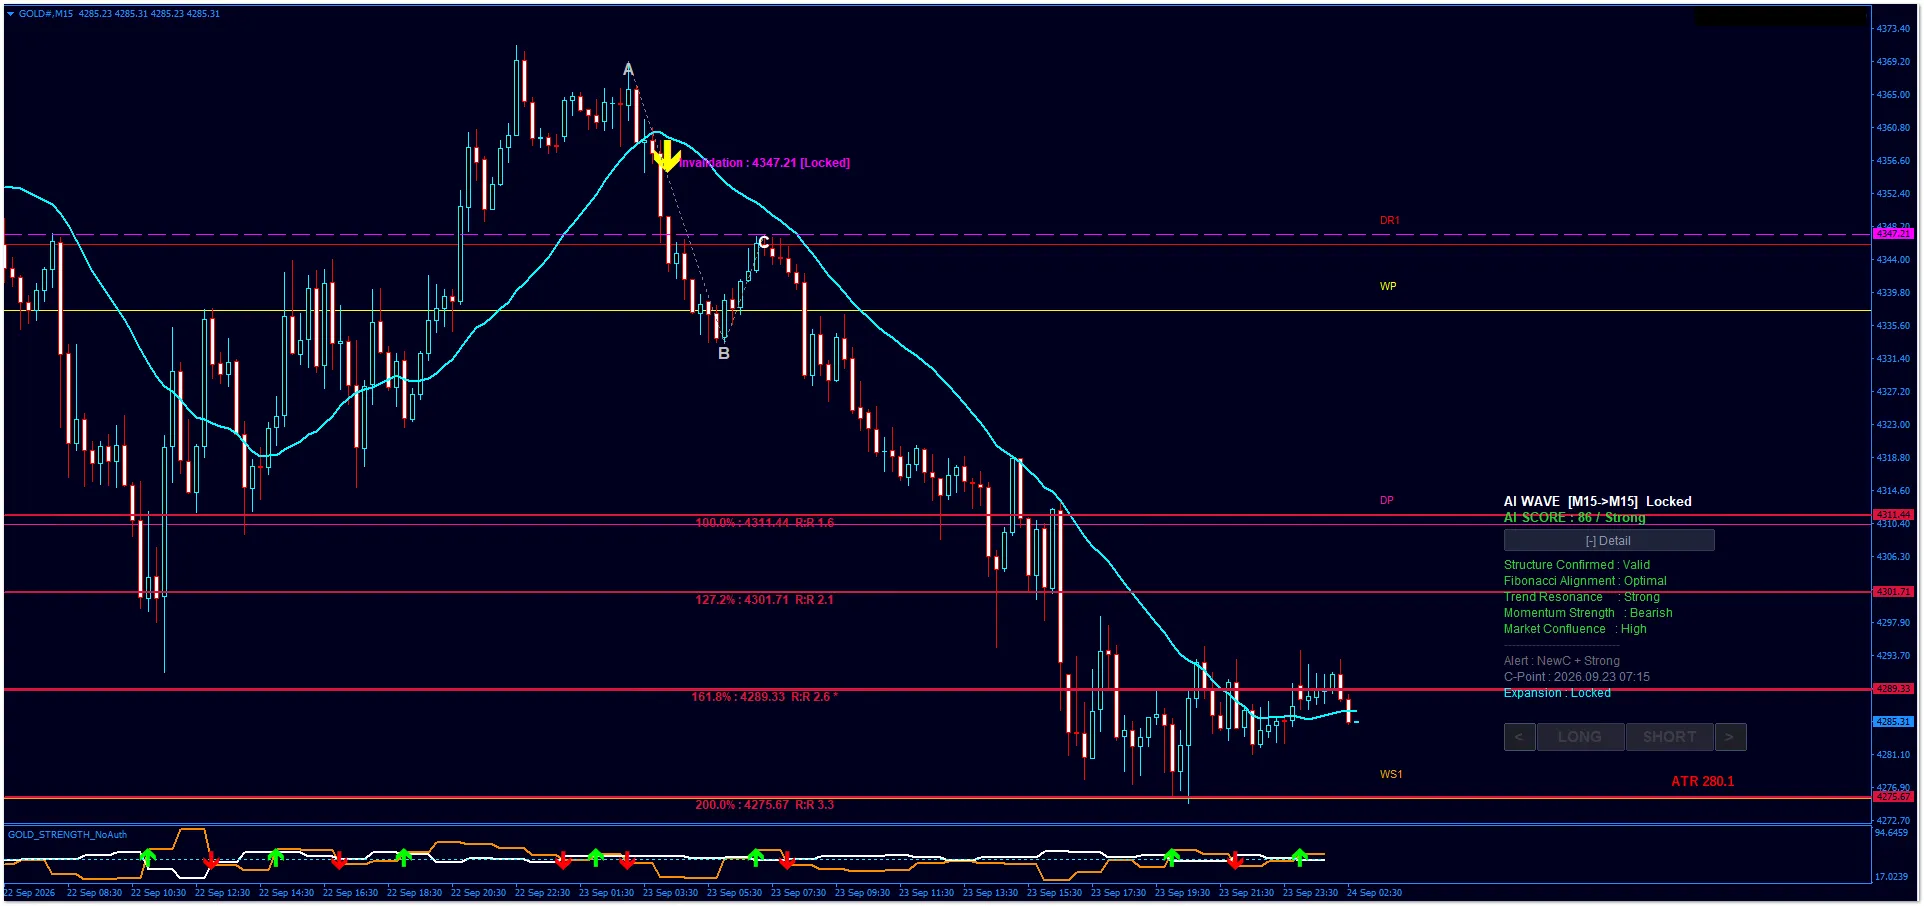
As shown in image ②, price breaks through the lines at 100%, 127.2%, 161.8% one after another, and firmly reaches the final red line where heavy orders lie【200.0% : 4275.67】 precisely reached.
Because of the AI SCORE “86” backing and the visualized 200% line as a clear goal, we could hold the position with confidence and capture the substantial breadth of 1:3.3 without wavering.
5. Why do prices gravitate toward the “target value”? – The essence of the market –
Why does price reach this target breadth (target line) shown by AI as if drawn by a magnet?
The answer lies in the market’s essential nature.
It is the fact that“price seeks thick liquidity (strong orders)”.
The massive funds behind market movement—large-cap investors and institutions—need areas where their huge settlement orders can be matched, i.e., locations with大量の注文が溜まっている場所
That is where many retail traders place their stops and new limit orders—the technically conscious milestones.
Lines such as 161.8% or 200.0% calculated and drawn automatically by AI WAVE are not just numerical values; they visualize
“zones where global orders tend to cluster, where large players target for settlements.”AI visualizes these destinations (liquidity clusters). Because the destination is known in advance, you can hold positions with confidence and not be swayed by interim noise (temporary reversals).
Anticipated Next-Generation Environment: AI WAVE MT5 version finally released
While retaining the robust logic of the MT4 version,the MT5 (MQL5) version, which maximizes “visualization of entry rationale” and “ease of operation,” has finally been unleashed.
“Not knowing when the next wave detection will come”
“Open multiple charts and they get cut off”
All those small frictions and concerns in prior trading are fully resolved by MT5’s advanced, proprietary features.
Exclusive features only in MT5
MT4 version logic and settings are preserved.
In MT5 (MQL5) version, added “visualization of entry rationale” and “flexibility of panel layout.”
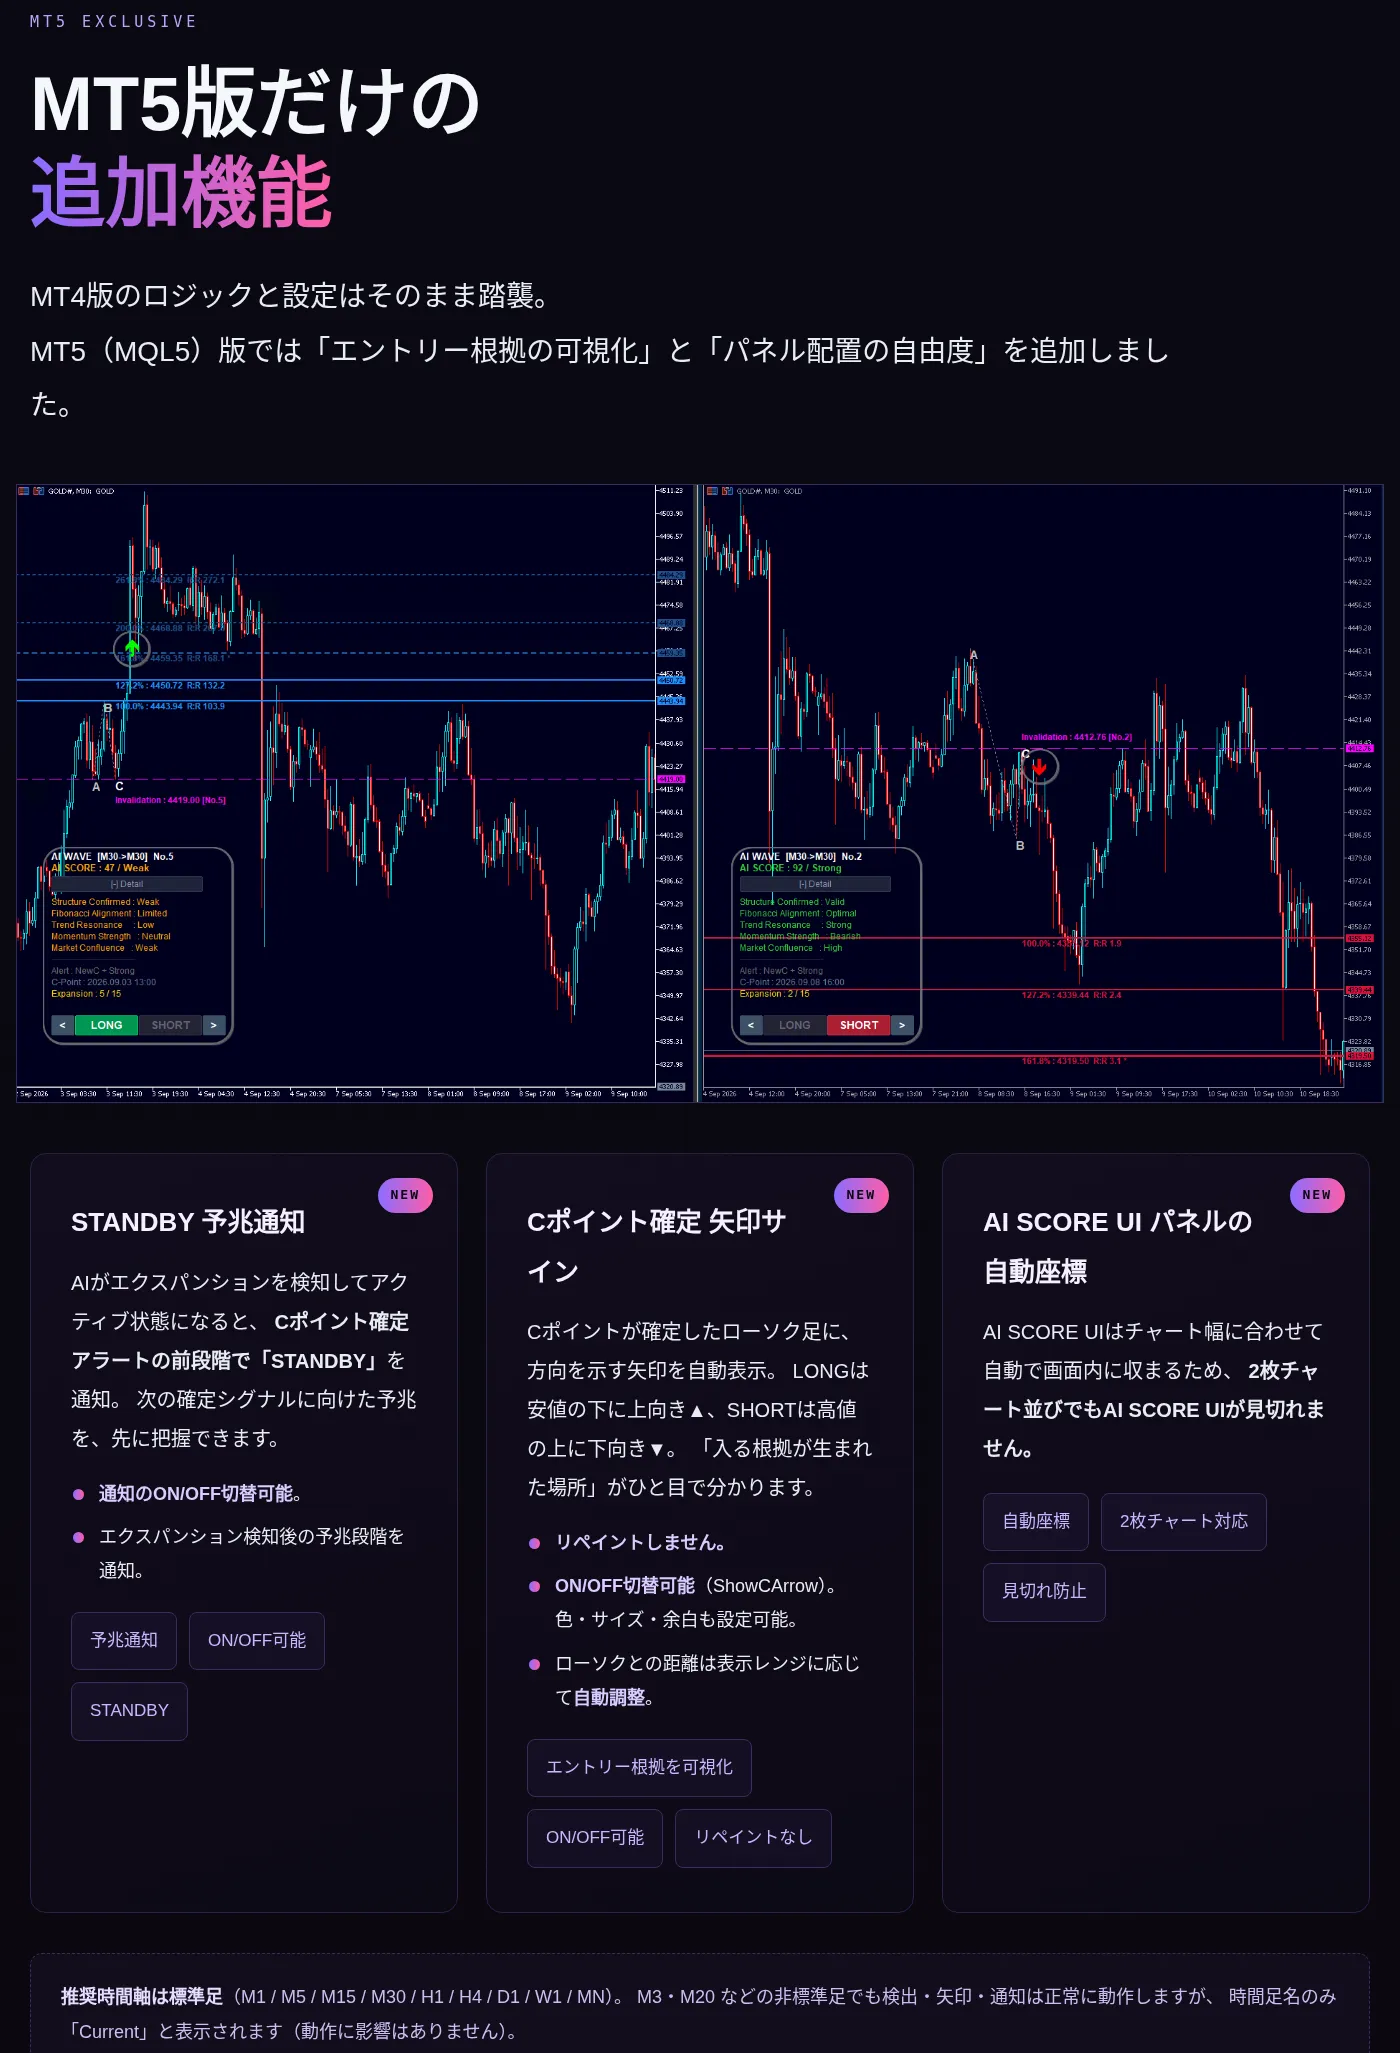
STANDBY Signaled for Anticipation
When AI detects expansion and becomes active, it notifies “STANDBY” before the confirmed anchor point, enabling early awareness of the next confirmation signal.
・Notification ON/OFF can be toggled.
・Signals the anticipation stage after expansion detection.
C-Point Confirmation Arrow Signals
When C-point is confirmed by a candlestick, an arrow indicating direction is automatically displayed [LONG shows an upward ▲ below the swing low, SHORT shows a downward ▼ above the swing high. The location where the rationale to enter was formed is immediately visible.
・No repaint.
・ON/OFF toggle (ShowCArrow). Color, size, and padding adjustable.
・Distance to the candlestick adjusts automatically according to display range.
AI SCORE UI Panel Auto Coordinates
AI SCORE UI automatically fits within the screen according to chart width, so even with two charts side by side, the AI SCORE UI does not get cut off.
Recommended timeframes: standard bars (M1/M5/M15/M30/H1/H4/D1/W1/MN). For non-standard bars like M3 or M20, detection, arrows, and notifications work normally, though the timeframe label will display as “Current” (no impact on operation).
Please choose according to your trading environment
AI WAVE MT5
A full-featured latest model with anticipation notifications, arrow signals, and UI auto-coordinates unique to MT5.
MT5 version details and purchase hereAI WAVE MT4
The basic, proven model with its own AI wave detection and expansion-visualization logic.
MT4 version details and purchase hereDisclaimer
The verification results and figures published in this article are reference information based on historical market data and do not guarantee future profits or similar results.
The pips figures and profit/loss data shown are reference values calculated based on the maximum range achieved after entry signals occurred, using a fixed stop loss (SL). These are the maximum values assuming full holding of price movement after signals, and do not indicate actual realized profits or trading results.
Actual profit and loss depend on entry/exit timing, spreads, slippage, trading fees, execution environment, position size, profit-taking/stop-loss decisions, and market conditions. In addition, stop-loss judgments are based on the 4-hour chart, and results may vary under actual operating conditions.
Furthermore, due to differences in trading conditions and price feeds, actual prices, pips, profit/loss, and execution results may differ depending on the broker, brokerage, and trading platform used. Therefore, there may be discrepancies between published data and actual operating results.
This data is for reference to verify the market analysis accuracy of AI WAVE. Final investment and trading judgments should be made at your own risk, considering your financial situation, risk tolerance, and trading environment.