
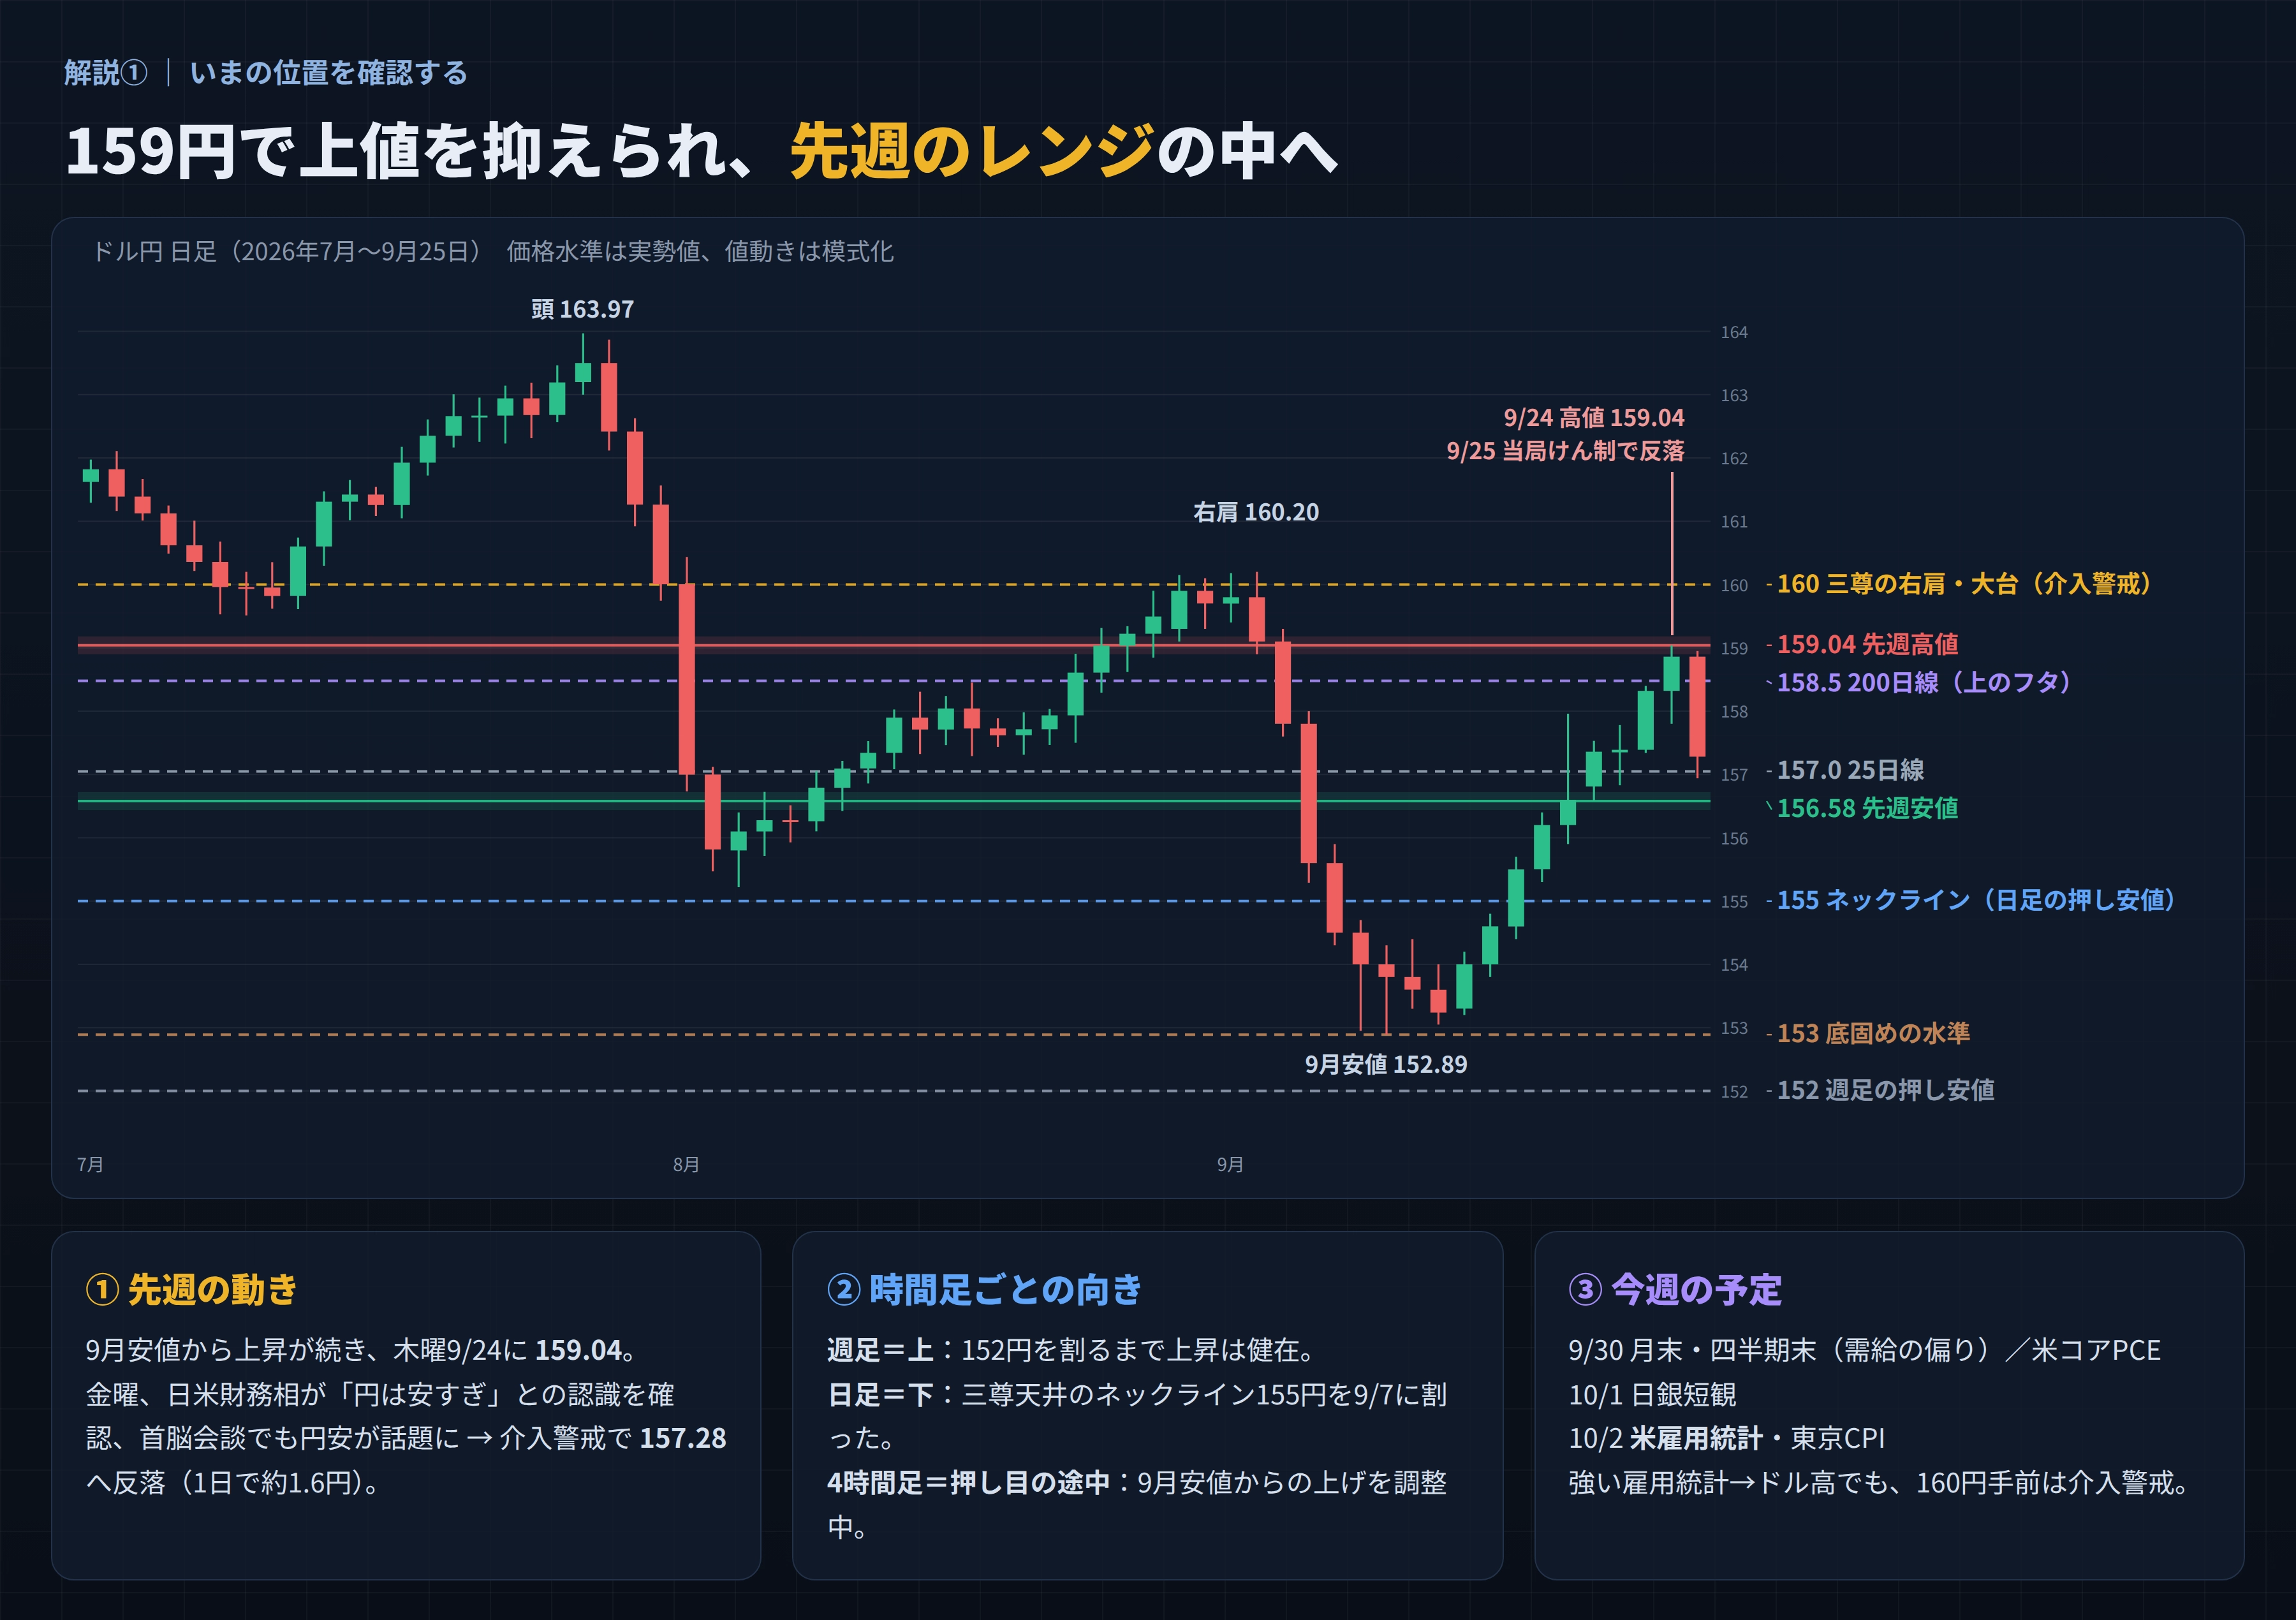
Rebounded at 159 yen and returned to last week's range (156.58–159.04).
Rejected at 159 yen and returned to the range from last week (156.58–159.04).
This week, determine direction by which breaks first: the last week's high or low.
■What happened (Sept 21–25, 2026)
────────────────────────────────────────
Mon 9/21: opened at 156.81 and moved to 157.36. Low 156.58 (last week's low)
Tue 9/22: 157.39. Range around the 157 yen level
Wed 9/23: 158.32. Rises to the 158 yen level
Thu 9/24: High 159.04. Dollar buying due to rising U.S. long-term yields (last week's high)
Fri 9/25: retreat to 157.28 (low 156.94). Six days of decline
• Japanese and U.S. finance ministers confirmed the view that the yen is too weak
• Yen weakness discussed at the summit as well
→ Buying yen spread as a warning of intervention
■Intraday directions
────────────────────────────────────────
Weekly chart = Upward trend remains as long as not breaking below 152 yen
Daily chart = Downward; neckline of the triple top broke at 155 on 9/7
4-hour chart = In the middle of a pullback, correcting the rise from September low
When directions diverge, wait for one to "break" by chart pattern.
■How to think this week: use last week's high/low as your measuring stick
────────────────────────────────────────
159.04 ━━━━━━━━━━━━━━━━ Last week's high (just below is the 200-day moving average at 158.5)
↑A: Break above → toward 160
157.8 ---------- Center line (can go either way = wait)
↓B: Break below → toward 155 (neckline)
156.58 ━━━━━━━━━━━━━━━━ Last week's low
① The measuring stick is "last week's high and low"
It is a line many participants watch, so buy and sell pressures collide easily.
② Whether the high is making lower highs or the low is making higher lows
If the price keeps bouncing off the high, selling dominates; if the bottom rises, buying dominates.
The winner is determined by which pattern appears first.
③ Merely touching the line is not enough to enter
Confirm with a higher low on the 1-hour chart or a stall at a high
It's like waiting for signals to turn green before crossing
④ Do not trade in the middle of the range
Hard to set stop-loss and take-profit; wait until the edge is reached.
■Scenario
────────────────────────────────────────
Up (A) stop decline near 156.6–157, with higher lows on the 1-hour chart
→ Break above 159.04 to 160
However, do not chase deeply near 160 due to intervention risk
Down (B) around 159 (last week's high and 200-day line) with 1-hour stall
→ Break below 156.58 to 155 (neckline)
Same direction as the daily chart's downtrend
Note: End of Sept, quarter-end; Oct 2 U.S. jobs report
A day can move 1–2 yen on official remarks alone. Wait after releases or statements
■This week's schedule
────────────────────────────────────────
9/30 (Wed): End of month/quarter; U.S. Core PCE price index
10/1 (Thu): Bank of Japan Short-Term Outlook (Tankan)
10/2 (Fri): U.S. jobs report
■Price level list
────────────────────────────────────────
160.00 Right shoulder of a head-and-shoulders; major level (intervention risk)
159.60 100-day moving average
159.04 Last week's high
158.48 200-day moving average (upper cap)
157.05 25-day moving average
156.58 Last week's low
155.00 Neckline (daily chart pullback low)
153.00 Bottoming level (Sept low 152.89)
152.00 Weekly pullback low (last defense line)
■Notes
────────────────────────────────────────
This material is for learning and explanatory purposes and does not constitute trading recommendations.
Please make investment decisions at your own responsibility.