
[Signs of Technical Collapse] The fate held by dollar-yen at 156.5 yen — the trap set by the “pullback false breakout” of the daily trend line and the Japan-U.S. yen depreciation encirclement network
On September 27, 2026, USD/JPY ends the week near157.27 yenand faces the start of next week’s trading
Last week, it briefly surged to as high as 159.03 yen, but slid rapidly into the 156 yen zone toward the weekend
Thereafter it recovered to the low-157 yen area, but extremely volatile moves rocked the market
Toward the weekend there were reports that “President Trump rejected Iran’s ceasefire proposal and potential resumed strikes after the November election,”
and crude oil futures and U.S. long-term yields showed signs of rising again.
“If U.S. yields rise due to intensified Middle East tensions, will USD/JPY again target 160?”
“Or will the chart’s break-out failure signal a major shift to a decline?”
The brutal reality presented by weekly and daily charts, excluding the Middle East factors, the true balance of fundamentals
and the “real defense line: 156.50 yen” that will decide life or death at the start of the week—these will be analyzed in detail.
Chapter 1: Dangerous signals from the chart—the daily “breakout failure” and weekly upper shadow
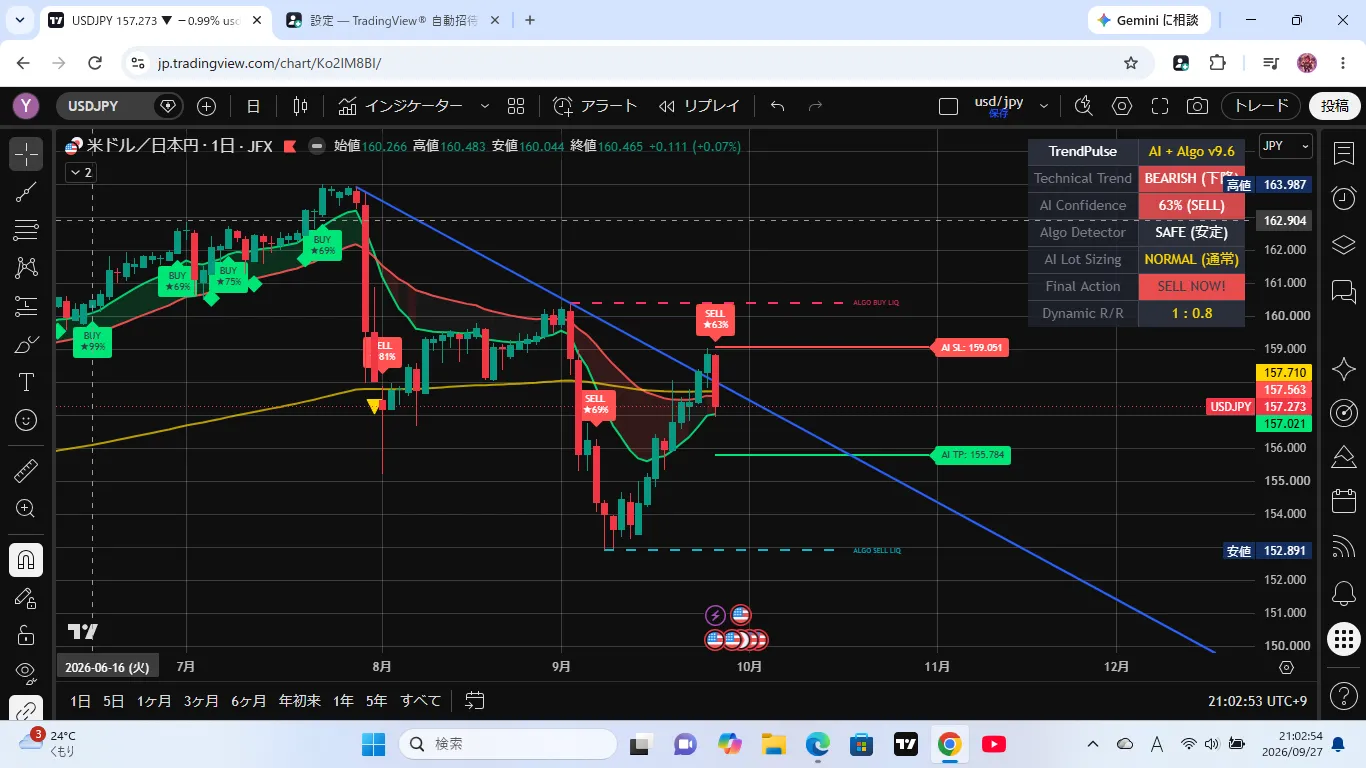
Checking TradingView’s latest charts (weekly and daily), from a technical perspective there are
veryominous signals lighting up
【Two Decisive Technical Warning Signs】

① Daily: “breakout failure (false breakout)” of the downtrend line
  A blue downtrend line drawn from the July highs briefly broke above, sending the pair to near 159 yen
。However, momentum was completely lost in just a few days and it was slammed back inside below the line。This shape is textbook “breakout failure = fuel for getting caught at a high”—a pattern。② Weekly: “a strong upper wick reaching about 1.8 yen” in the high price area
 It surged from 156.77 at the start of the week to 159.03, but closed at 157.27.
 While the body remained a modest positive candle, the moment it touched the 159 range a strong selling onslaught was waiting, proving the point
Following the basic technical principle,“breakout failure of the downtrend line + weekly upper wick”
is a strong sell signal aiming to test lower prices again.
Looking at chart shapes alone, the bias clearly shifts toward cautioning the downside
Chapter 2: Excluding Middle East risk, the “yen-strengthening” factors overwhelmingly dominate
Despite the chart pointing lower, the market does not drop vertically because the dynamics of U.S. interest rates supported by the Middle East situation are
oil higher ➔ U.S. inflation concerns ➔ U.S. 10-year yield around 5.2% supporting the downside
for the time being.
However, if you temporarily put aside the Middle East and oil factors and view the market, the currency’s fundamentals tilt entirely toward a stronger yen.
【Reality of market conditions excluding Middle East and oil】
① Forceful yen-weakness restraint by U.S.-Japan leaders:
 President Trump expressed concerns about yen weakness at the summit,
 and Prime Minister Kishida aligned with saying “it’s an issue if the yen is undervalued as a general rule.”
 Coupled with remarks that “the July U.S.-Japan coordinated intervention principle is still upheld,” 159–160 yen becomes a politically off-limits zone.

② Kishida administration’s declaration of脱リフレ (away from reflation):
 Finance Minister Katayama stated “Prime Minister Kishida is not a reflationist and respects the Bank of Japan’s independence,”
 and Economic Minister Shimomura said “the phase of Abenomics-style reflation has ended.”
 The premise that overseas investors held—“Kishida administration implies ongoing easing and yen depreciation”—has collapsed at the core.

③ Expectations of BoJ rate hikes and rising JGB yields:
 Japan’s 10-year JGB yield at high levels around 3.1%.
 Even among policy board members, there is growing groundwork for higher prices and additional rate hikes.
Chapter 3: Why is 156.50 yen the real crucial turning point, not 157.00?
Many individual investors fixate on the round number 157.00 yen. Yet when examining chart structure, the decisive watershed lies around
at about 156.50 yen
【The overall picture of USD/JPY attack-and-defense price zones】
159.00–159.50 yen: daily downtrend breakout-failure zone (resistance on rallies)
      ↓
157.27 yen around: current price (floating mid-zone)
      ↓
157.00 yen around: merely a psychological milestone and passage point
      ↓
★ 156.50 yen around: [most important turning point] structural support where past price action is dense
      ↓
155.00–155.50 yen: target after breaking below 156.50However,if 156.50 yen clearly breaks with a full-body candle and a retest shows 156.50 turning into resistance
(upward resistance) then six confirmations align:
the formation matches completely.
Chapter 4: Three major live scenarios to reveal the market at the start of the week
In early week trading, we determine which of three forces will dominate on the surface.
| Pattern | Correlation and signal | USD/JPY behavior | What the market means |
Pattern 1 【Fundamental support rally】 | Oil up + U.S. 10-year yield up Cross yen pairs up (EUR/JPY, etc.) | Keep 156.50 and recover to around 158 (dip-buying works) | Continued support from Middle East risk and rate differentials; a range-bound market persists. |
Pattern 2 【Technical-driven collapse】 | Clear break below 156.50 Cross yen collapse across the board | Break below 156.50 → slide to the 155s (longs sell-off in force) | “Parabolic top at 159” is confirmed and a full yen-strength trend emerges against the dollar |
Pattern 3 【Strongest selling signal】 | USD/JPY breaks below 156.50 | Vertical drop once below 156.50 (panic selling on suspected intervention) | Evidence that the U.S. rate-differential weapon is losing its effect; large players retreating fully due to Japanese policy risks. |
The scenario to watch most closely is Pattern 3. If you see “U.S. yields rising while USD/JPY breaks below 156.50,” that is a signal fundamentals have completely failed, and a powerful yen-strength wave will overwhelm the market.
Chapter 5: This week’s wave of U.S.-Japan data releases
This week features a chain of major economic events in the U.S. and Japan that will intensify technical battles.
【This Week’s Important Economic Schedule (Japan Time)】
- Sep 28 (Mon) 08:50 ?? BoJ Monetary Policy Meeting Minutes (July)
- Sep 29 (Tue) 23:00 ?? U.S. Aug JOLTS job openings / U.S. Consumer Confidence
- Sep 30 (Wed) 21:30 ?? U.S. Aug PCE Deflator (Fed’s preferred inflation gauge) ★
- Oct 1 (Thu) 08:50 ?? BoJ Short-term View / BoJ meeting “Main Opinions” (Sept) ★★
- Oct 1 (Thu) 23:00 ?? U.S. Oct ISM Manufacturing PMI ★
- Oct 2 (Fri) 08:30 ?? Tokyo Core CPI (seen rising to 2.4%) ★★
- Oct 2 (Fri) 21:30 ?? U.S. Sept Employment Situation (Nonfarm payrolls, unemployment rate) ★★★
In particular, Thursday’s “BoJ Main Opinions” and Friday’s “Tokyo metropolitan area CPI” will highlight a hawkish stance and inflation,
which would raise expectations for earlier BoJ rate hikes and further push USD/JPY lower.
Conclusion: At the start of the week, give priority watching the 156.50 yen level
The current market is in a highly distorted equilibrium where technicals point lower, governments in the U.S. and Japan suppress tops, and only Middle East oil and U.S. rate advantages support the downside.
After the market opens on Monday, there is no need to rejoice or worry about a slight move around 157.00 yen.
What matters is one thing: when selling approaches the 156.50 yen area, will it firmly hold as support and rebound, or break through to become resistance?
Disregard the market bias, follow objective price action and confirmation signals to limit losses with disciplined trading.
If you found this somewhat helpful, please hit follow — it encourages updates!
[GogoJungle listing page]