
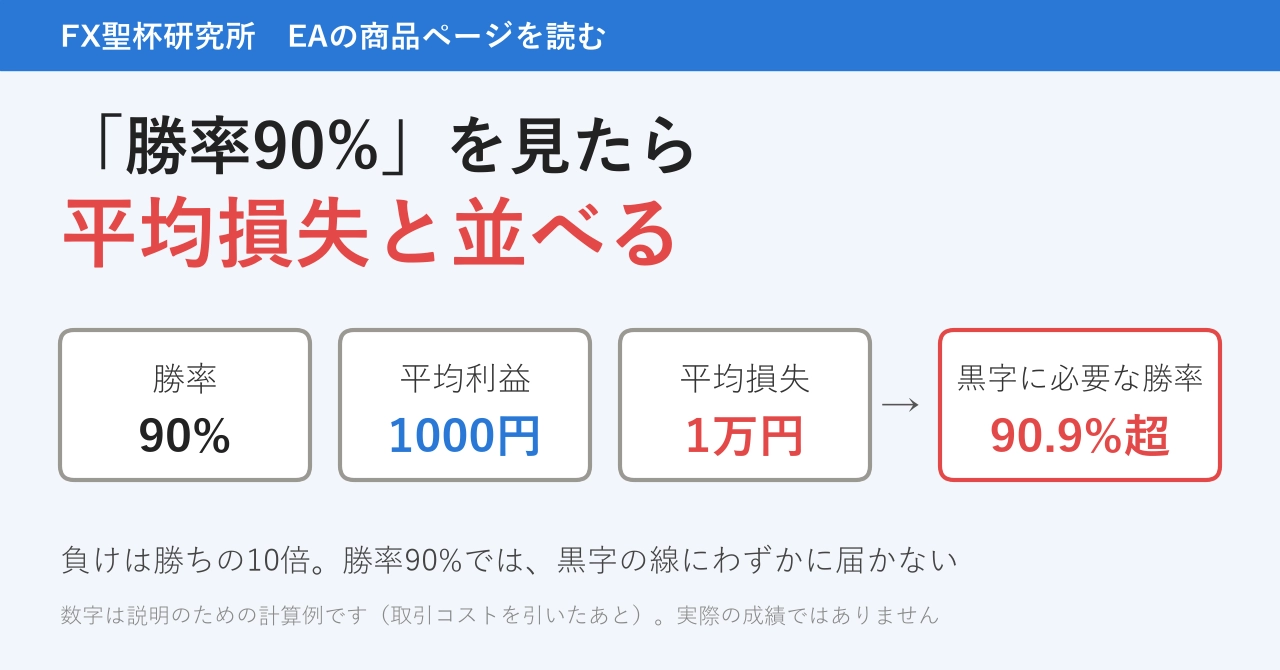
Why a winning rate of 90% EA can be dangerous. The calculation showing a loss despite 9 wins and 1 loss, and where to look on the product page
I am the director of FX Holy Grail Research Institute. I am a 50-year-old system engineer, keeping a record of testing automated trading methods that look like they might win, using past data to break them down.
When you browse product pages looking for EAs (programs that automatically execute FX trades), you often see high win rates like “90% win rate.” I’ll explain why choosing based on that number alone can be dangerous, with calculations. In the latter part, I’ll also note which parts of GogoJungle product pages you should look at.
All the numbers in this article are only illustrative calculations for explanatory purposes.They are not my own test results or performance.
Conclusion
Even if the win rate (the proportion of trades that were winning) is 90%,that does not guarantee an overall profit.Even if you win 9 times, if one loss is large, the winnings can be wiped out.
Therefore, when looking at win rate,you must also consider the size of one loss. There is only one way to view it.
One loss is how many times bigger than one win
If you know this multiplier, you can calculate the win rate needed to stay profitable.
What win rate is
Win rate is a number calculated as follows.
Wins ÷ Trades
If you trade 10 times and win 9 times, the win rate is 90%. In other words,you will lose once in 10 trades.
What win rate tells you is “how many times you won.”It does not tell you how much you gain on a win or how much you lose on a loss.This is the pitfall.
Calculation showing you can be in the red even with 9 wins and 1 loss
An example. A method that trades 10 times, with 9 wins and 1 loss.
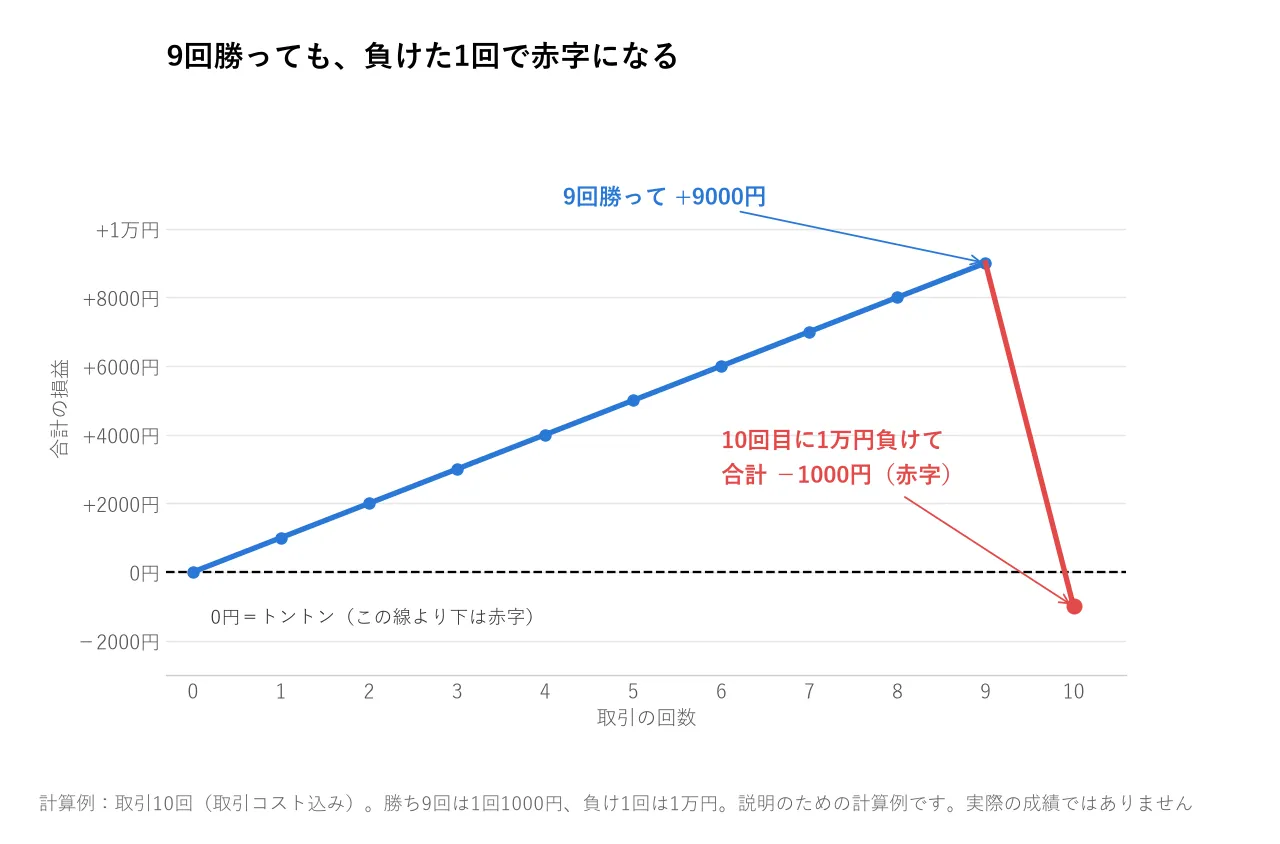
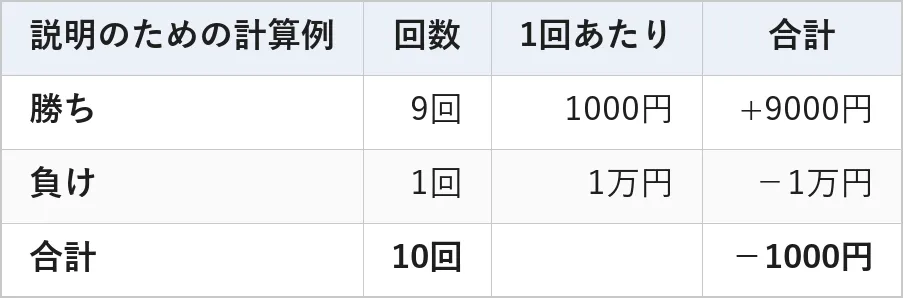
Condition: 10 trades, 90% win rate. The amount is after deducting trading costs (the difference between bid and ask and fees).
Nine wins increase by 9,000 yen. But the final one loss reduces by 10,000 yen, sothe total is a 1,000 yen loss.
No matter when the loss occurs, the total remains the same. Whether the first or the tenth loss occurs, the total after 10 trades is a 1,000 yen loss.
Look at “one loss is how many times bigger than one win”
In this example, one loss (10,000 yen) isten times bigger than one win (1,000 yen).
If you know how many times bigger a loss is than a win, you can calculate the win rate needed to stay profitable. The idea is simple: aim for the win total and the loss total to be exactly balanced, which is the break-even line.
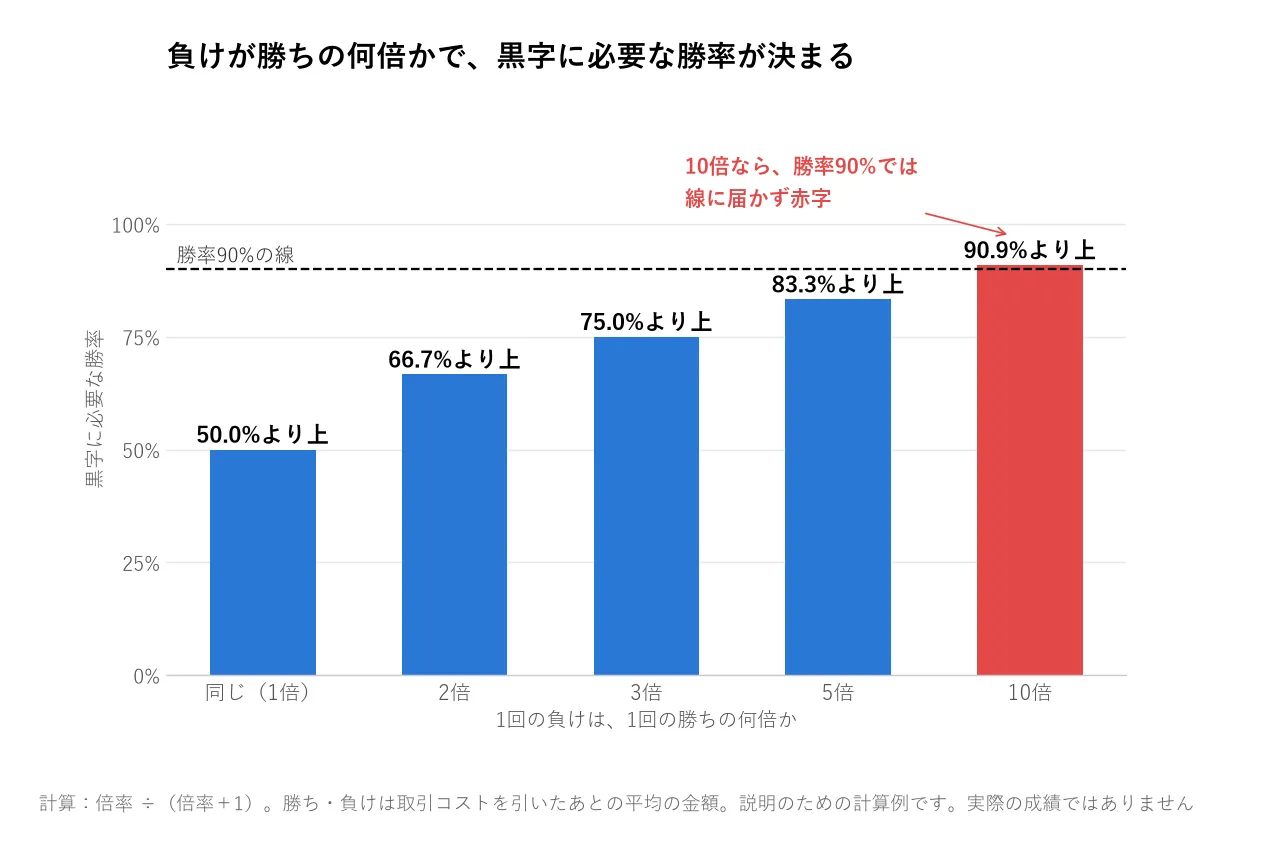
Calculation: multiplier ÷ (multiplier + 1). If the multiplier is 10 times, then 10 ÷ 11 = 90.9%. Compare both wins and losses using the average amounts after deducting trading costs.
If losses are 10 times the size of wins, you need a win rate higher than 90.9% to be profitable.A win rate of 90% falls just short of this line and results in a loss.
From the opposite viewpoint, an EA with a 90% win rate will be break-even if one loss is exactly 9 times a win, and will be in the red if it exceeds 9 times.
There are methods that stay profitable even with a low win rate
I’ll show a reverse calculation as well. In the same 10-trade setting, a method that wins only 4 times, a win rate of 40%.
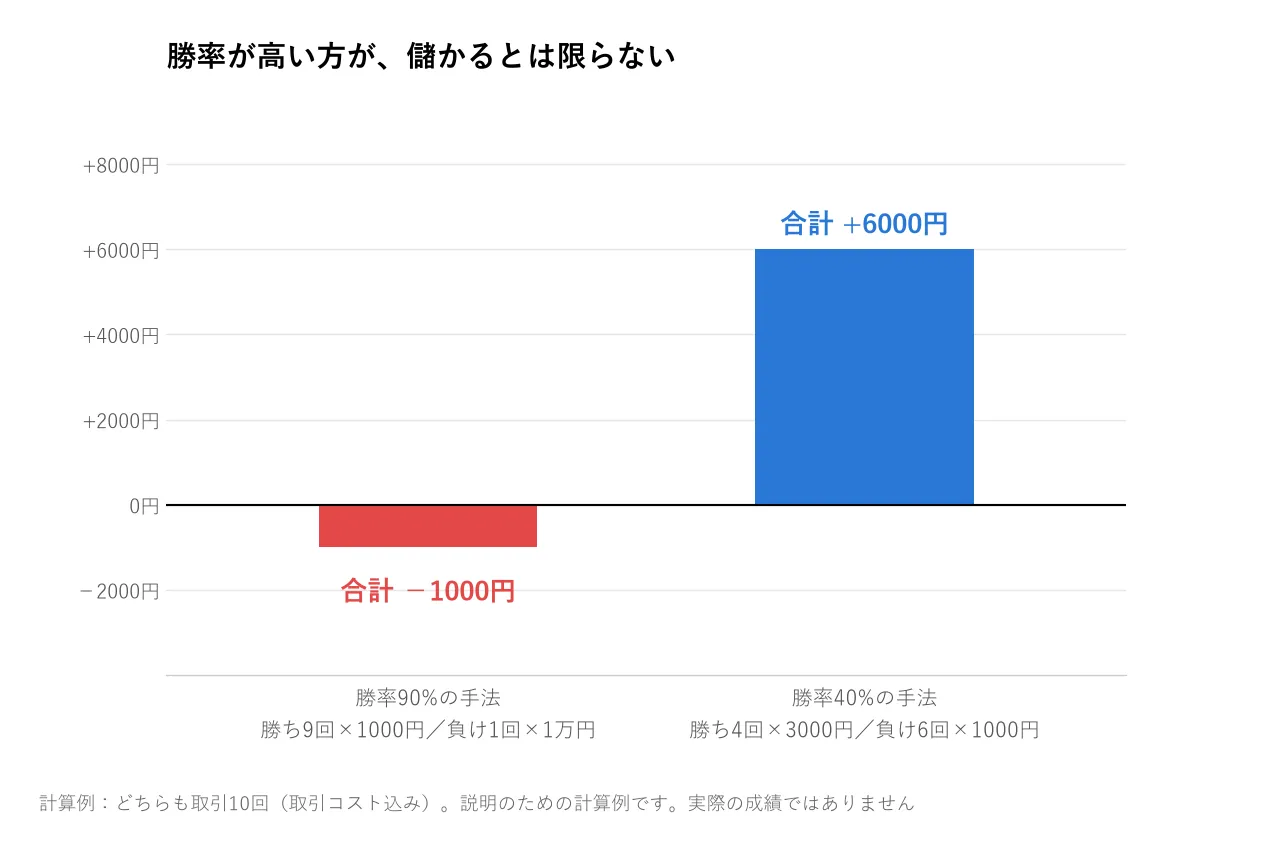
Condition: both methods have 10 trades. The 90% win-rate method earns 9 wins × 1,000 yen = +9,000 yen and 1 loss × 10,000 yen = −10,000 yen. The 40% win-rate method earns 4 wins × 3,000 yen = +12,000 yen and 6 losses × 1,000 yen = −6,000 yen. Amounts are after deducting trading costs.
The 40% win-rate method loses 6 times out of 10. Still, the one win (3,000 yen) is three times the one loss (1,000 yen), sothe total is a 6,000 yen profit.
The losses are one-third of the gains in this method. Calculating with the above logic, the win rate needed for profitability is above 25%. In fact, 40% already well exceeds this line.
The height of the win rate and whether you profit are separate issues.Win rate only makes sense when combined with the sizes of wins and losses.
Why high win-rate EAs tend to have larger losses
There are two common patterns that make win rate appear high.
The first isprofits are quickly locked in when small, while stop-losses are placed far away. Since small gains lock in quickly, you win often. But when you lose, you lose big.
For example, in USD/JPY, you lock in profit after a 0.1 yen rise, and you don’t stop out until it falls by 1 yen. Since 1 yen equals 100 sen, a move of 1,000 dollars (10,000 units) can translate to 100 yen losses for each 0.01 yen move.
If you trade 10,000 dollars worth (10,000 lots), a 1 sen move yields about 100 yen profit or loss. In this scenario, gains are about 1,000 yen and losses about 10,000 yen. It’s roughly the same shape as the calculation above.
The second pattern isnot cutting losses and averaging down (martingale) to lower the average price. If the price partially recovers, you can close all positions in profit, so win rate can look very high. However, when the price does not recover, one loss can wipe out many wins. As you add more positions, your exposure grows, and you can lose most of your funds at once.
Both approaches increase the size of one loss to raise win rate.Having a high win rate itself is not bad.But you must consider the size of losses together with it, or you may miss dangerous designs.
Large losses may occur outside the period shown on product pages
Another caution with high-win-rate EAs is this:Large losses occur only occasionally, so there are periods when they have not yet appeared on the performance page.
Consider the earlier calculation. Suppose the product page shows performance only up to the 9th trade.
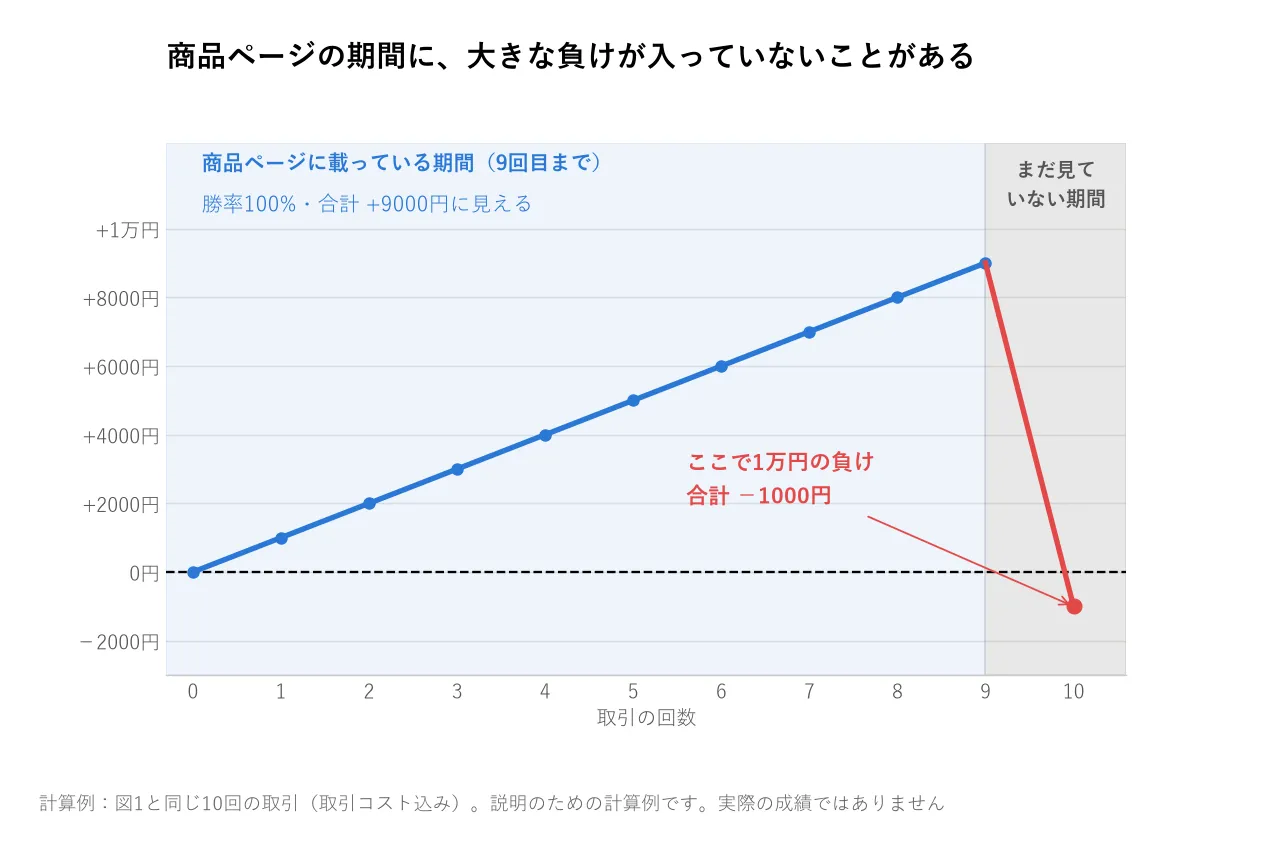
If you look only at that period,a 100% win rate and a 9,000 yen profit—the loss that would make the overall red on the 10th trade has not yet appeared.
This is the same idea as in the previous article (PF = total profit ÷ total loss) that small numbers of trades are heavily influenced by chance.
Previous article: https://www.gogojungle.co.jp/finance/navi/articles/126730
The higher the win rate, the rarer losses become, so with small counts it’s hard to see the true picture.
That is why I include “even in periods not yet observed” as a condition for the Holy Grail I am seeking.
Three things to check on the product page
When you see a high-win-rate EA, confirm the following three things.
- Average gain and average loss.How many times bigger is one loss than one win
- The win rate needed to stay profitable with that multiplier.Compare with the above diagram of “win rate needed for profitability” to see if the actual win rate is sufficiently higher
- Rules for stop-loss and the number of trades and the period.Is it a setup that does not stop loss and uses averaging down (martingale)? As losses get larger, are they tested over longer periods and more trades?
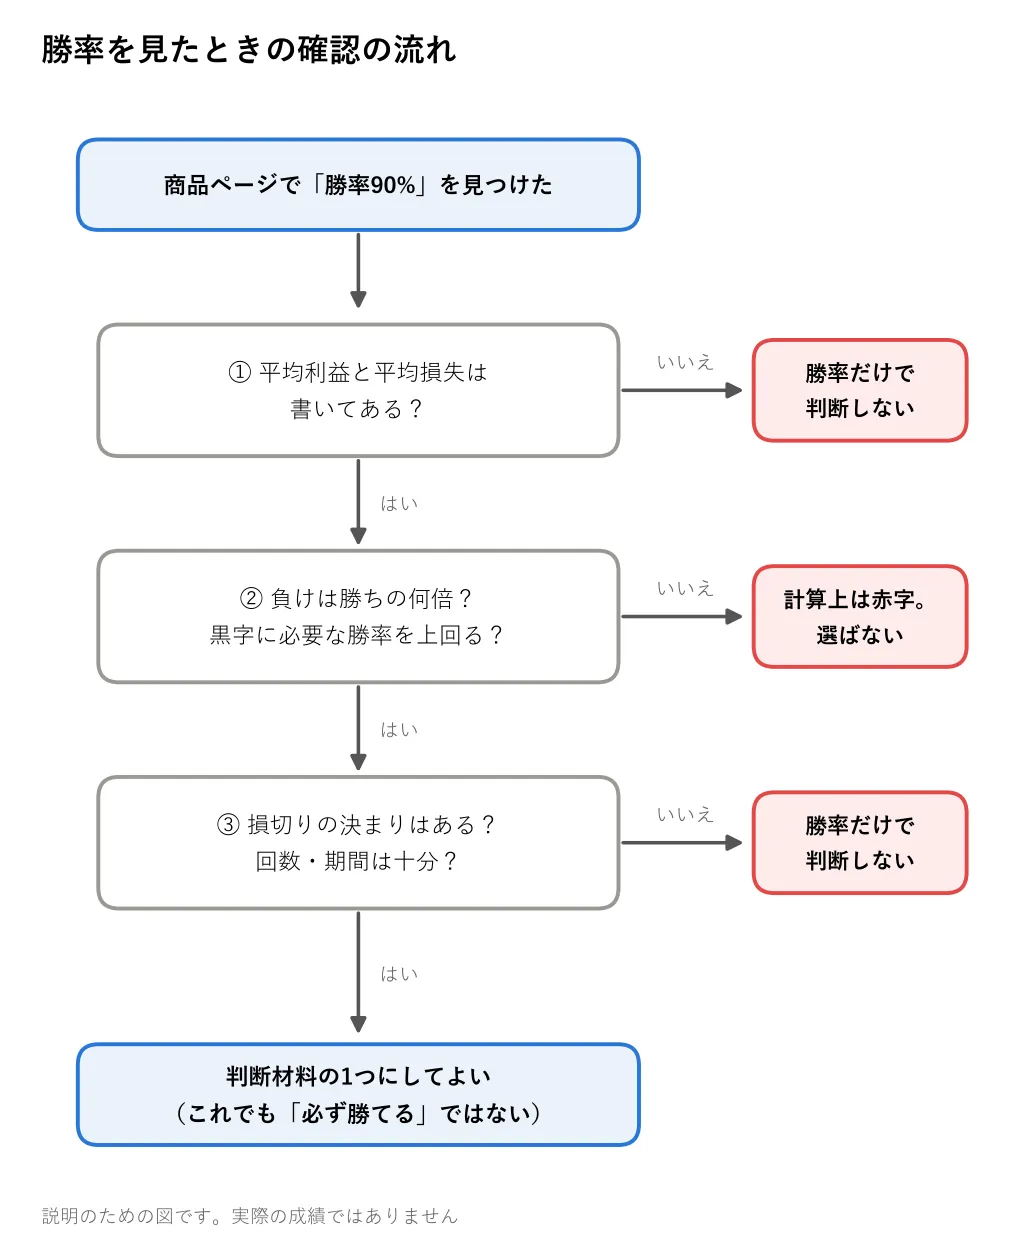
If you cannot determine average gain and average loss, avoid deciding based only on win rate.
What to look at on GogoJungle product pages
From here, I’ll discuss where on GogoJungle product pages these numbers appear. I checked two popular product pages as of September 26, 2026; layouts may differ by product and date.
In the performance section of product pages,alongside win rate, you will see “Average Gain” and “Average Loss.”These two correspond to “one win” and “one loss” in this article.
To use them, simply divide average loss by average gain. For example, if average gain is 1,000 yen and average loss is 10,000 yen, losses are ten times gains. As shown above, the win rate must be above 90.9% to be profitable (illustrative calculation).
In the lower part of the page, the section “System Trade Terminology” calls average gain ÷ average loss the “Risk-Reward Ratio.” This article’s figure is inverted relative to that; in the above example it would be 0.1. The performance section does not show this number directly, so you need to divide it yourself.
There is also a “Performance” item called “Risk-Return Ratio.” The name is similar but it is a different figure. The glossary defines it as total period net profit ÷ maximum drawdown (the largest asset decline). It is not the ratio of one win to one loss, so don’t confuse it.
Performance can be switched between “All Periods,” “2 Years,” “1 Year,” “6 Months,” “3 Months,” and “1 Month.”Please align the win rate, average gain, and average loss under the same “All Periods.”If you switch to a shorter period, you may see only numbers from the period before a large loss has occurred, as shown in the diagram above under “periods where large losses have not yet appeared.”
Another note: product pages include a “Forward Test” tab. Forward testing uses GogoJungle’s EA in a practice account that does not use real money. It’s separate from backtesting with historical data and represents the period after listing the product, so it’s closer to the “period not yet observed” in this article. However, new products often have short periods and few trades, so large losses may not have appeared yet, as in the above diagram.
In conclusion
At FX Holy Grail Research Institute, when we see a good figure, we first look for the conditions under which it can fail. For a 90% win rate, the failing condition was “one loss that exceeds nine times one win.”
The calculations and diagrams in this article were created with AI and all numbers were double-checked by programs.
We do not promise a method that always wins. But we believe the Holy Grail exists and are searching for it.
The Holy Grail I am seeking is a trading rule that remains robust even when including trading costs and even during periods not yet observed. A high win rate is a tempting ornament that fake Holy Grails wear.
Next, when you view win rate on GogoJungle’s product pages, place the nearby average gain and average loss side by side. That alone can exclude one more fake ornament. For each fake you remove, you move one step closer to the Grail.
Glossary
- EA: A program that automatically executes FX trades
- PF: Total profit from winning trades ÷ total loss from losing trades. Below 1.0 means red
- Win rate: Proportion of wins among trades
- Average gain / average loss: The average amount gained per win and the average amount lost per loss
- Risk-Reward Ratio: Average gain ÷ average loss (GogoJungle glossary term)
- Risk-Return Rate: Total profit and loss ÷ the decline of the largest asset (maximum drawdown) in the period (GogoJungle glossary term). Not the same as win/loss ratio
- Stop-loss: When lost to the set line, automatically close the position
- Nampin (averaging down): Not stopping losses and buying more to lower the average price
- Sen (sen): 0.01 yen. A move of 1 sen in a 10,000 unit trade moves 100 yen
- 10,000 units: The unit of trade volume. For USD/JPY, 10,000 dollars worth
- Trading costs: Money paid each time you trade. Spread and fees
- Forward Test: Performance results from running the EA in a post-listing period. On GogoJungle, it runs in a practice account without using real money
Note: This article is not investment advice. All numbers are for explanatory calculation purposes only.