
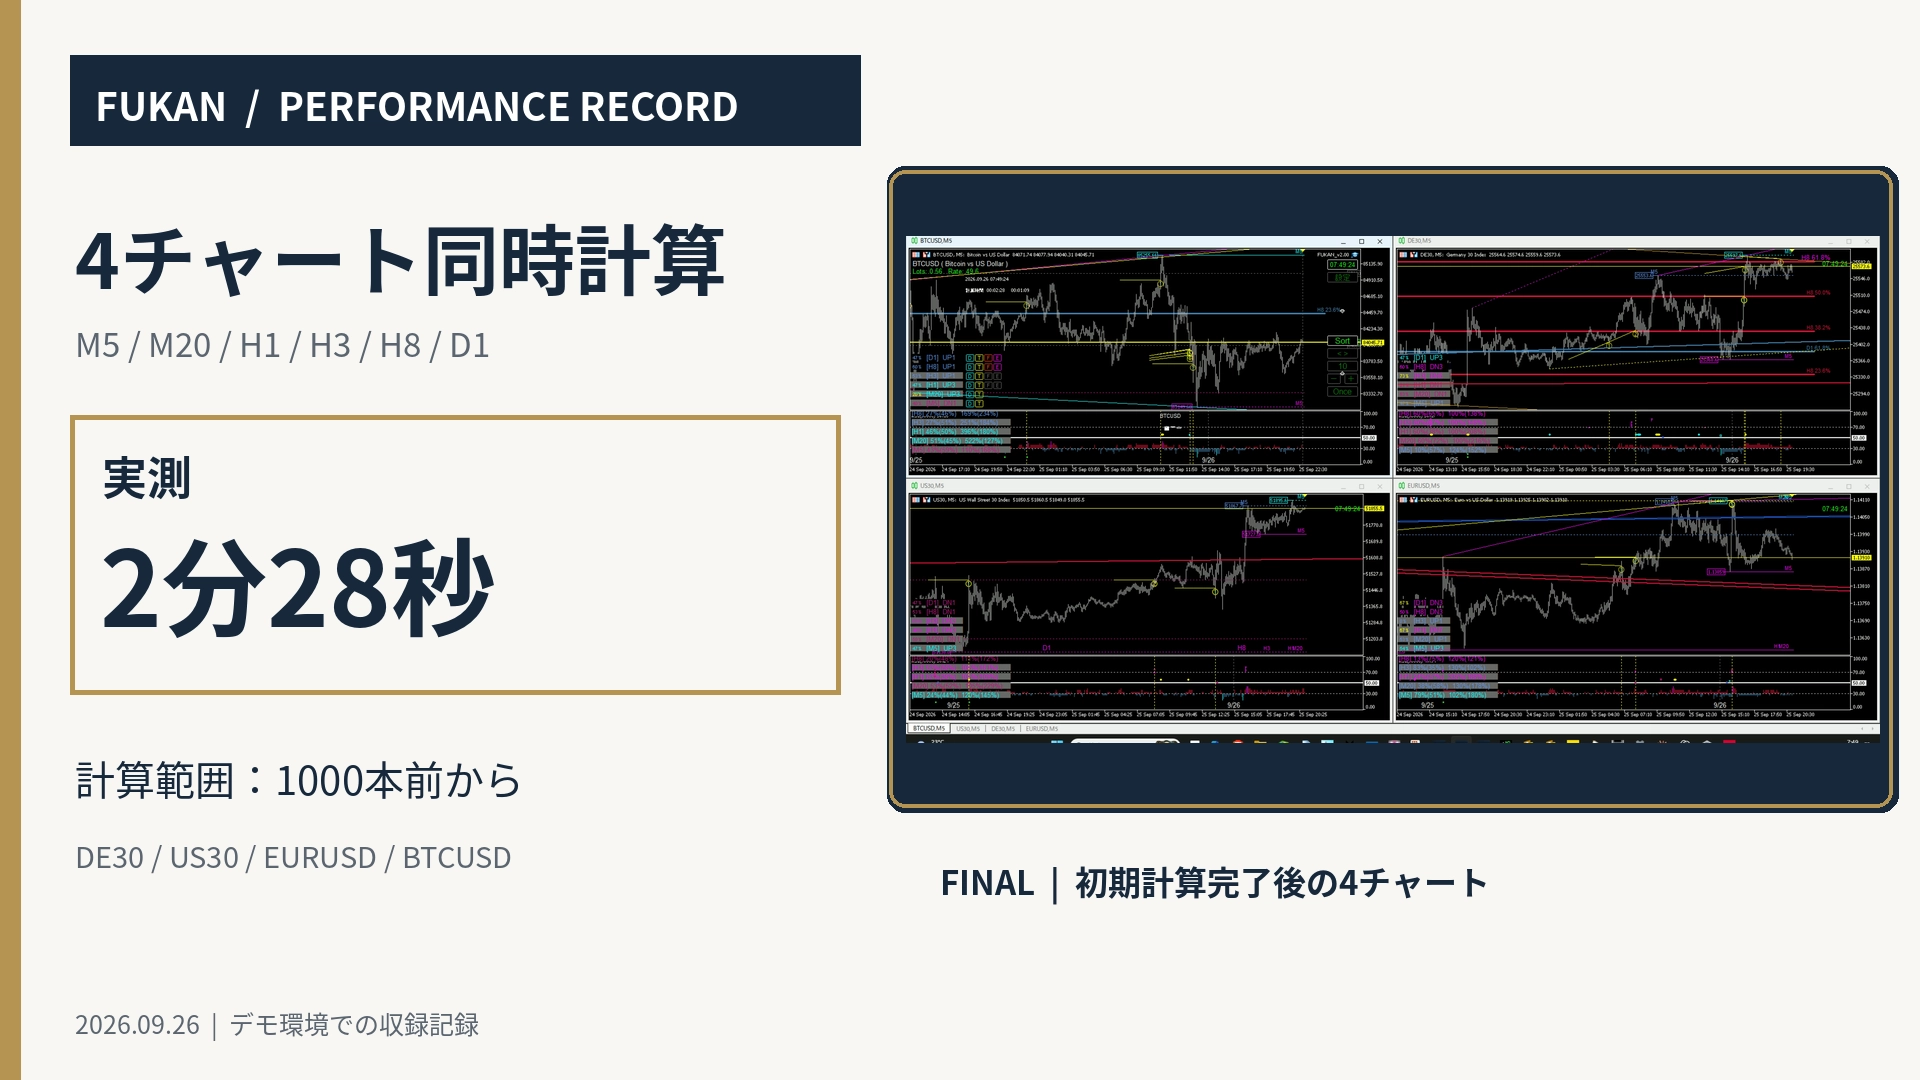
Initial calculation of FUKAN as measured
Initial Calculation of FUKAN Executed in Real Time | 4 Charts × 6 Timeframes, 2 minutes 28 seconds Recorded
FUKAN PRODUCT RECORD / September 26, 2026 / MT5 Demo Environment
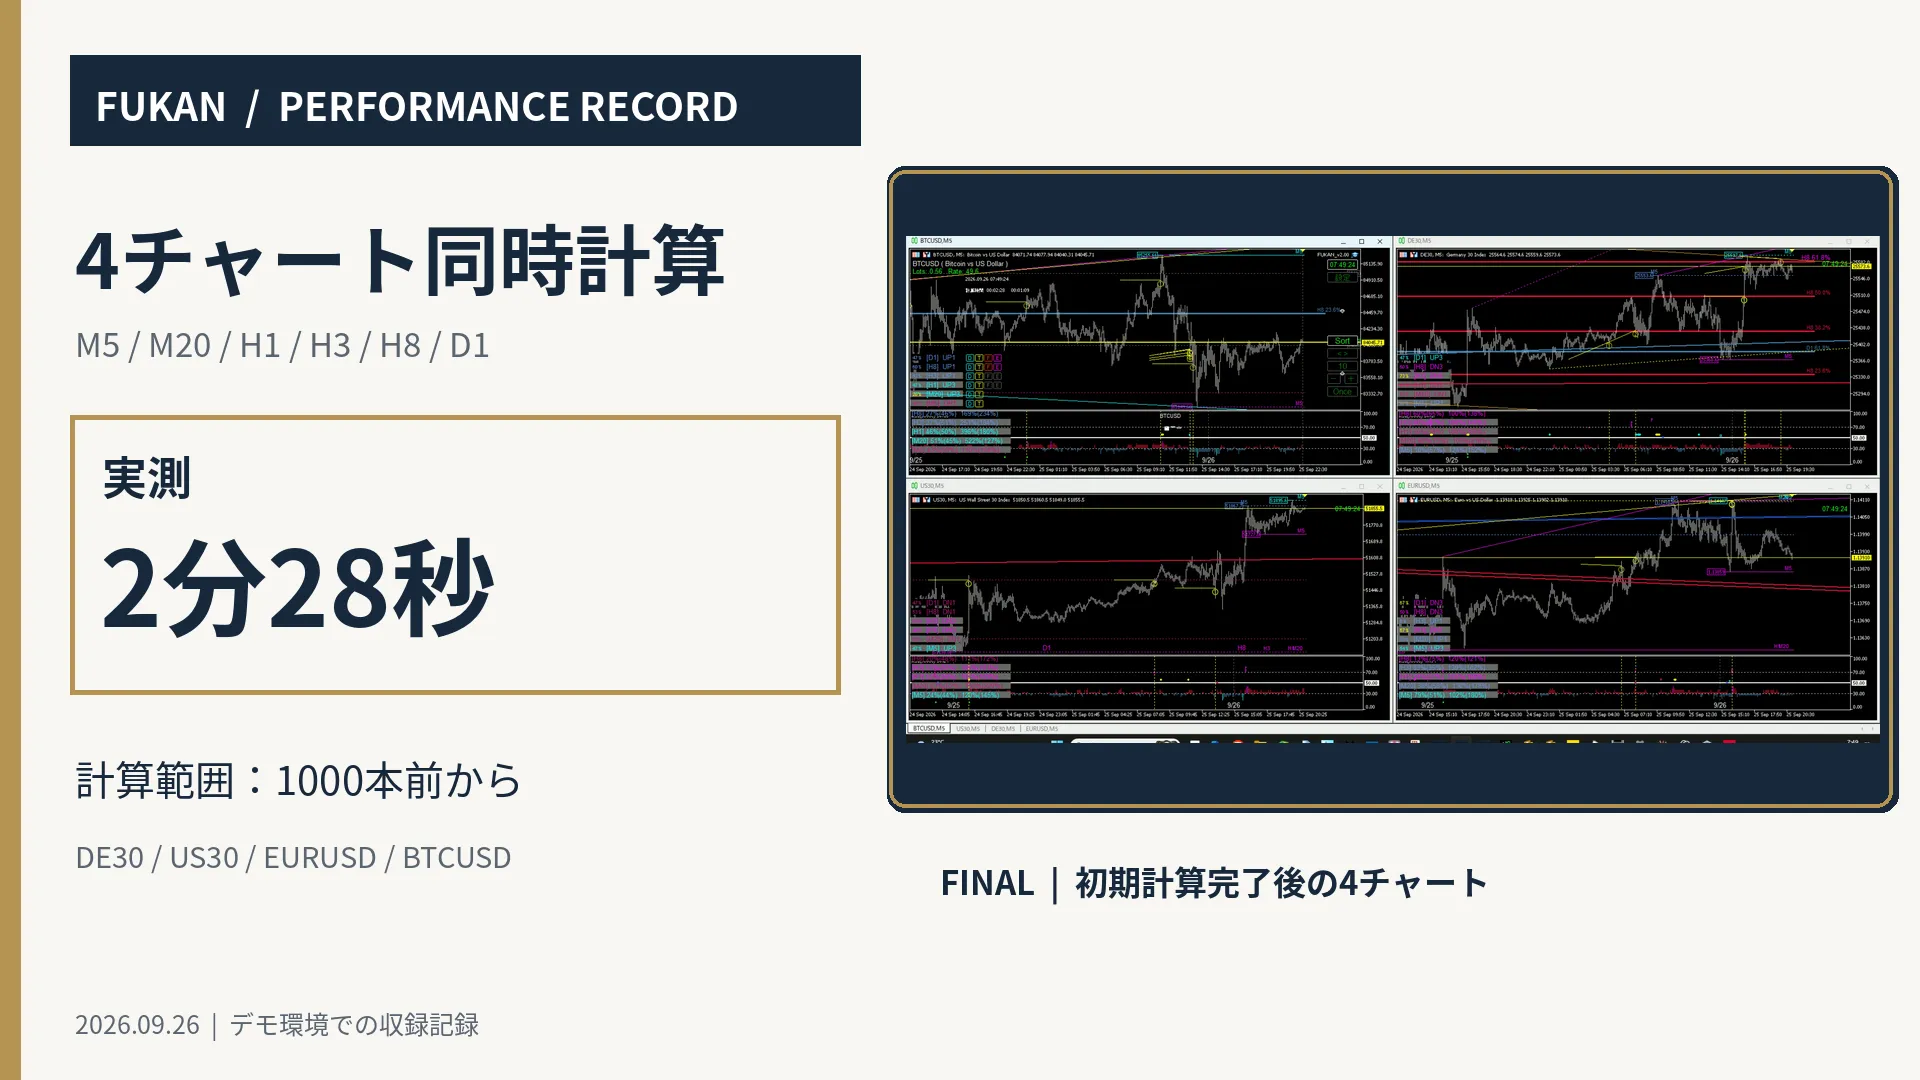
On September 26, 2026, we launched the FUKAN commercial version in a demo environment and recorded from applying the EA to the completion of the initial calculation for four charts: DE30, US30, EURUSD, and BTCUSD. Using a 6-timeframe setup, the calculation range starts from 1000 bars prior. Under these recording conditions, the real-time completion time was 2 minutes 28 seconds.
The times stated in this article are real measurements taken with the current PC, demo account, history, and settings. They do not guarantee the same calculation time in all environments.
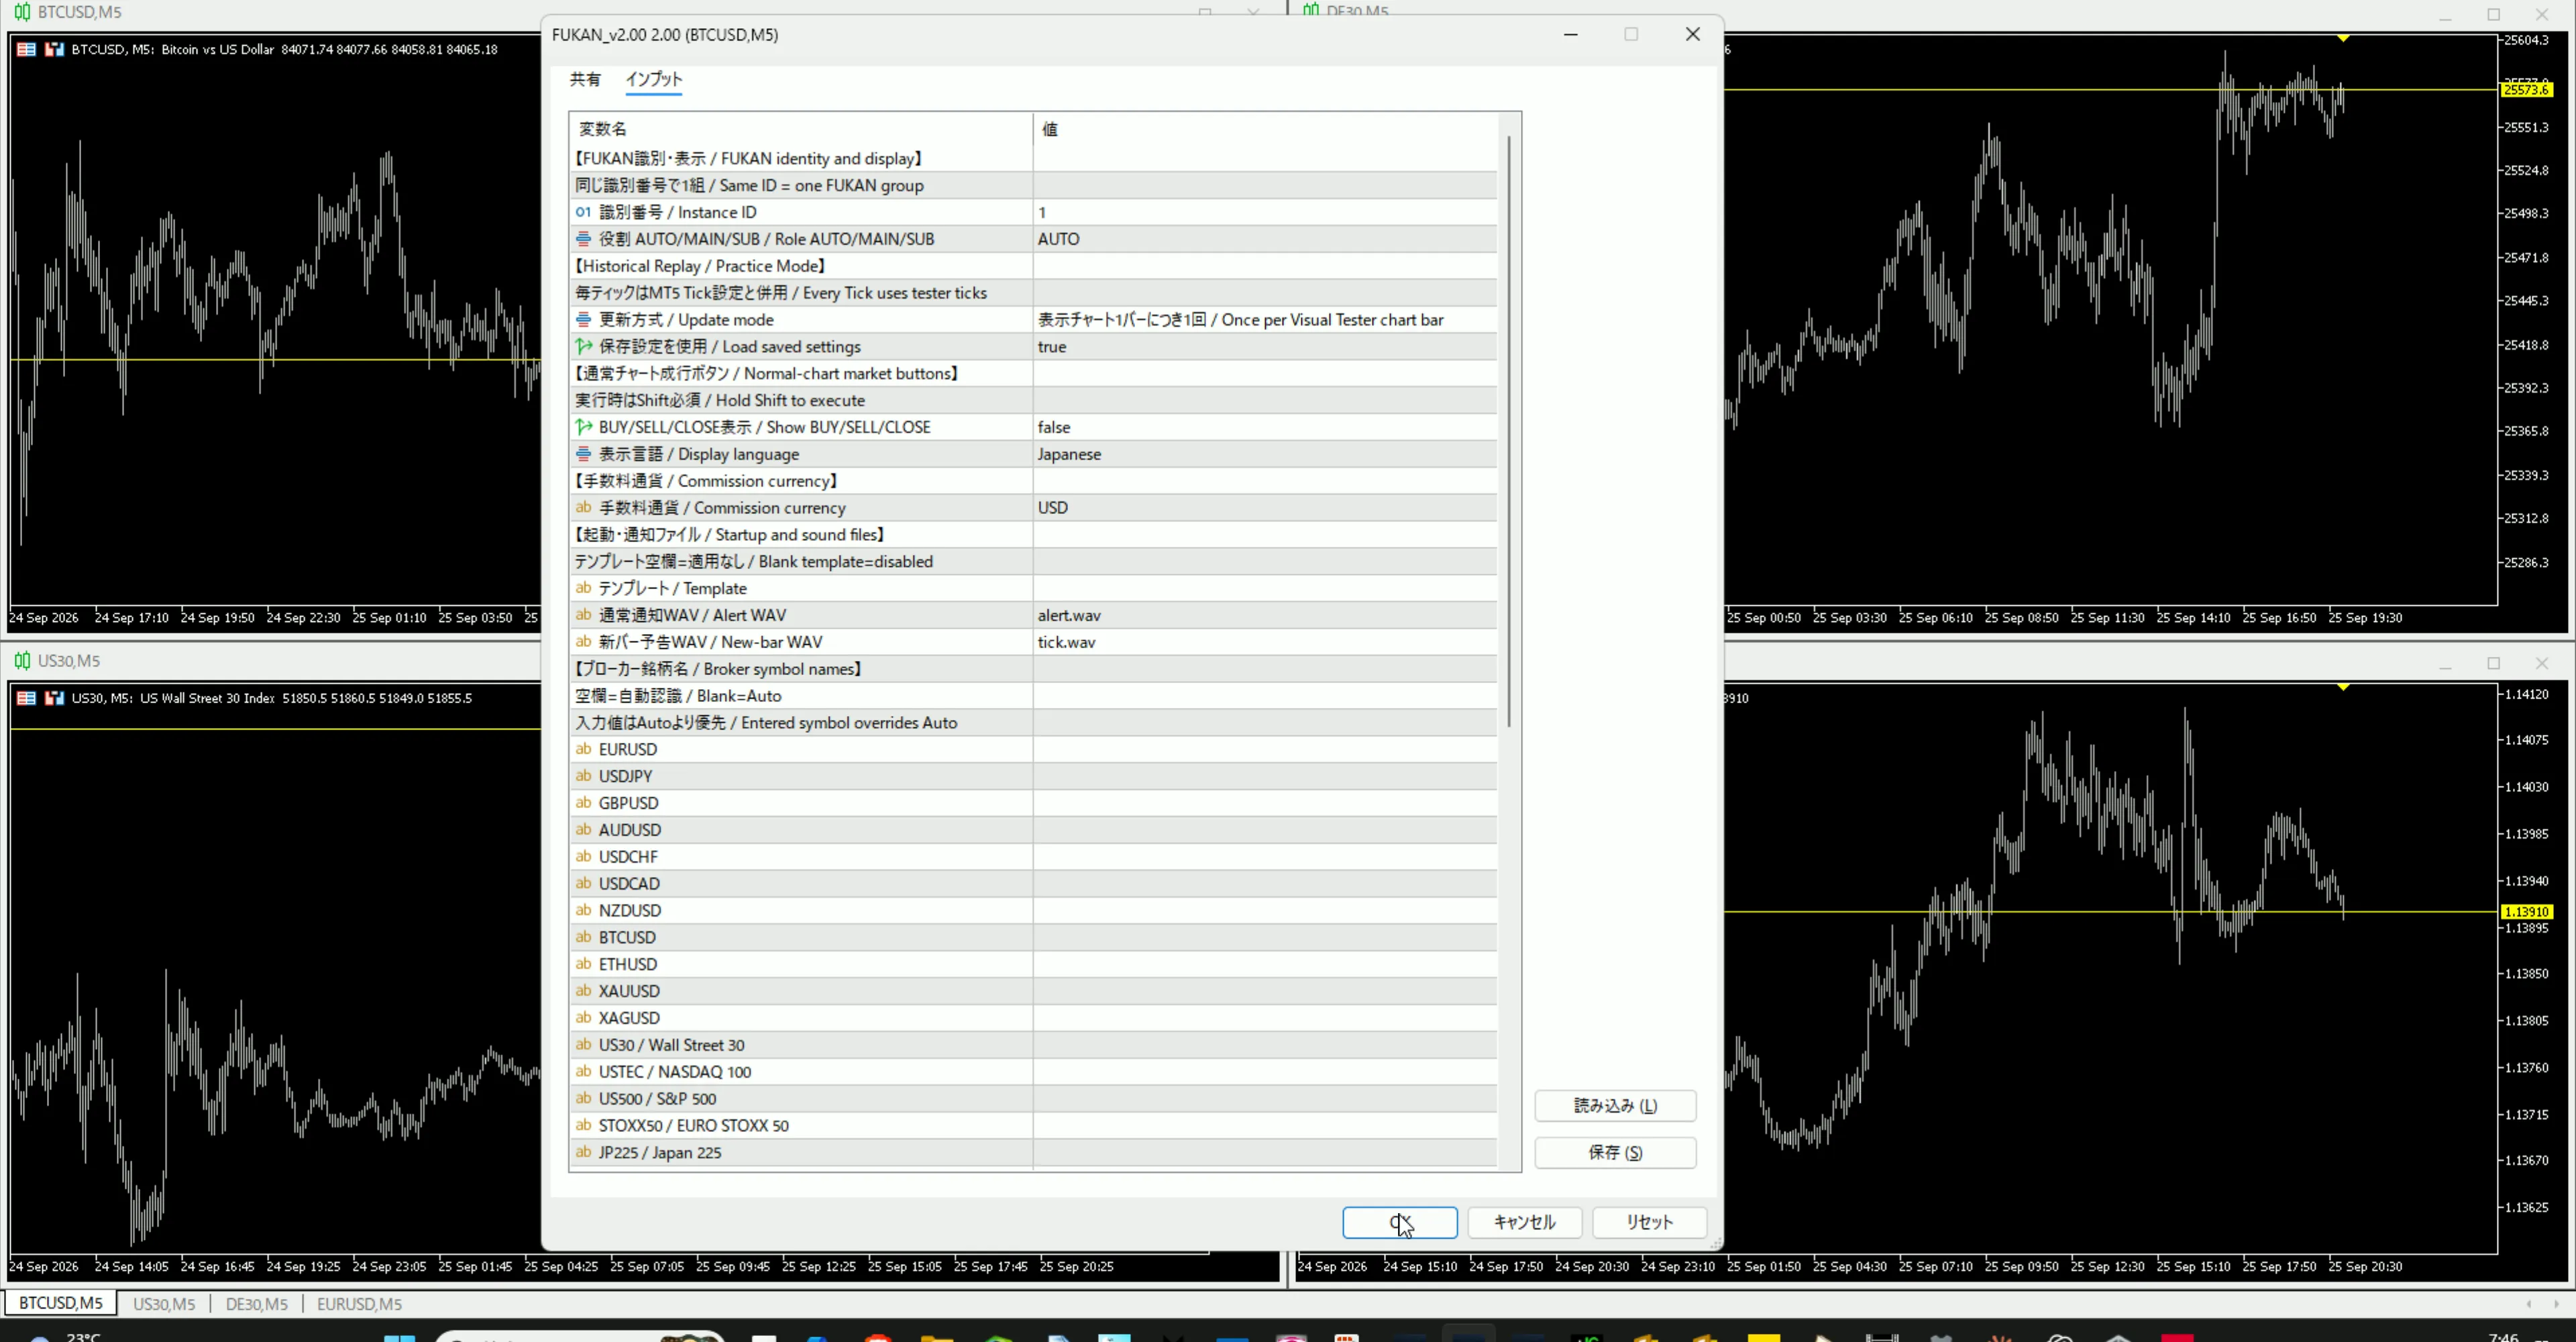
1|Conditions Measured in This Recording
The targets are the four charts: DE30, US30, EURUSD, and BTCUSD. The timeframes are M5, M20, H1, H3, H8, and D1. For each chart, the calculation range was set to 1000 bars prior, and the EA was applied to begin the initial calculation. The recording captures up to the completion of the initial calculation.
2|What Happens During the Initial Calculation
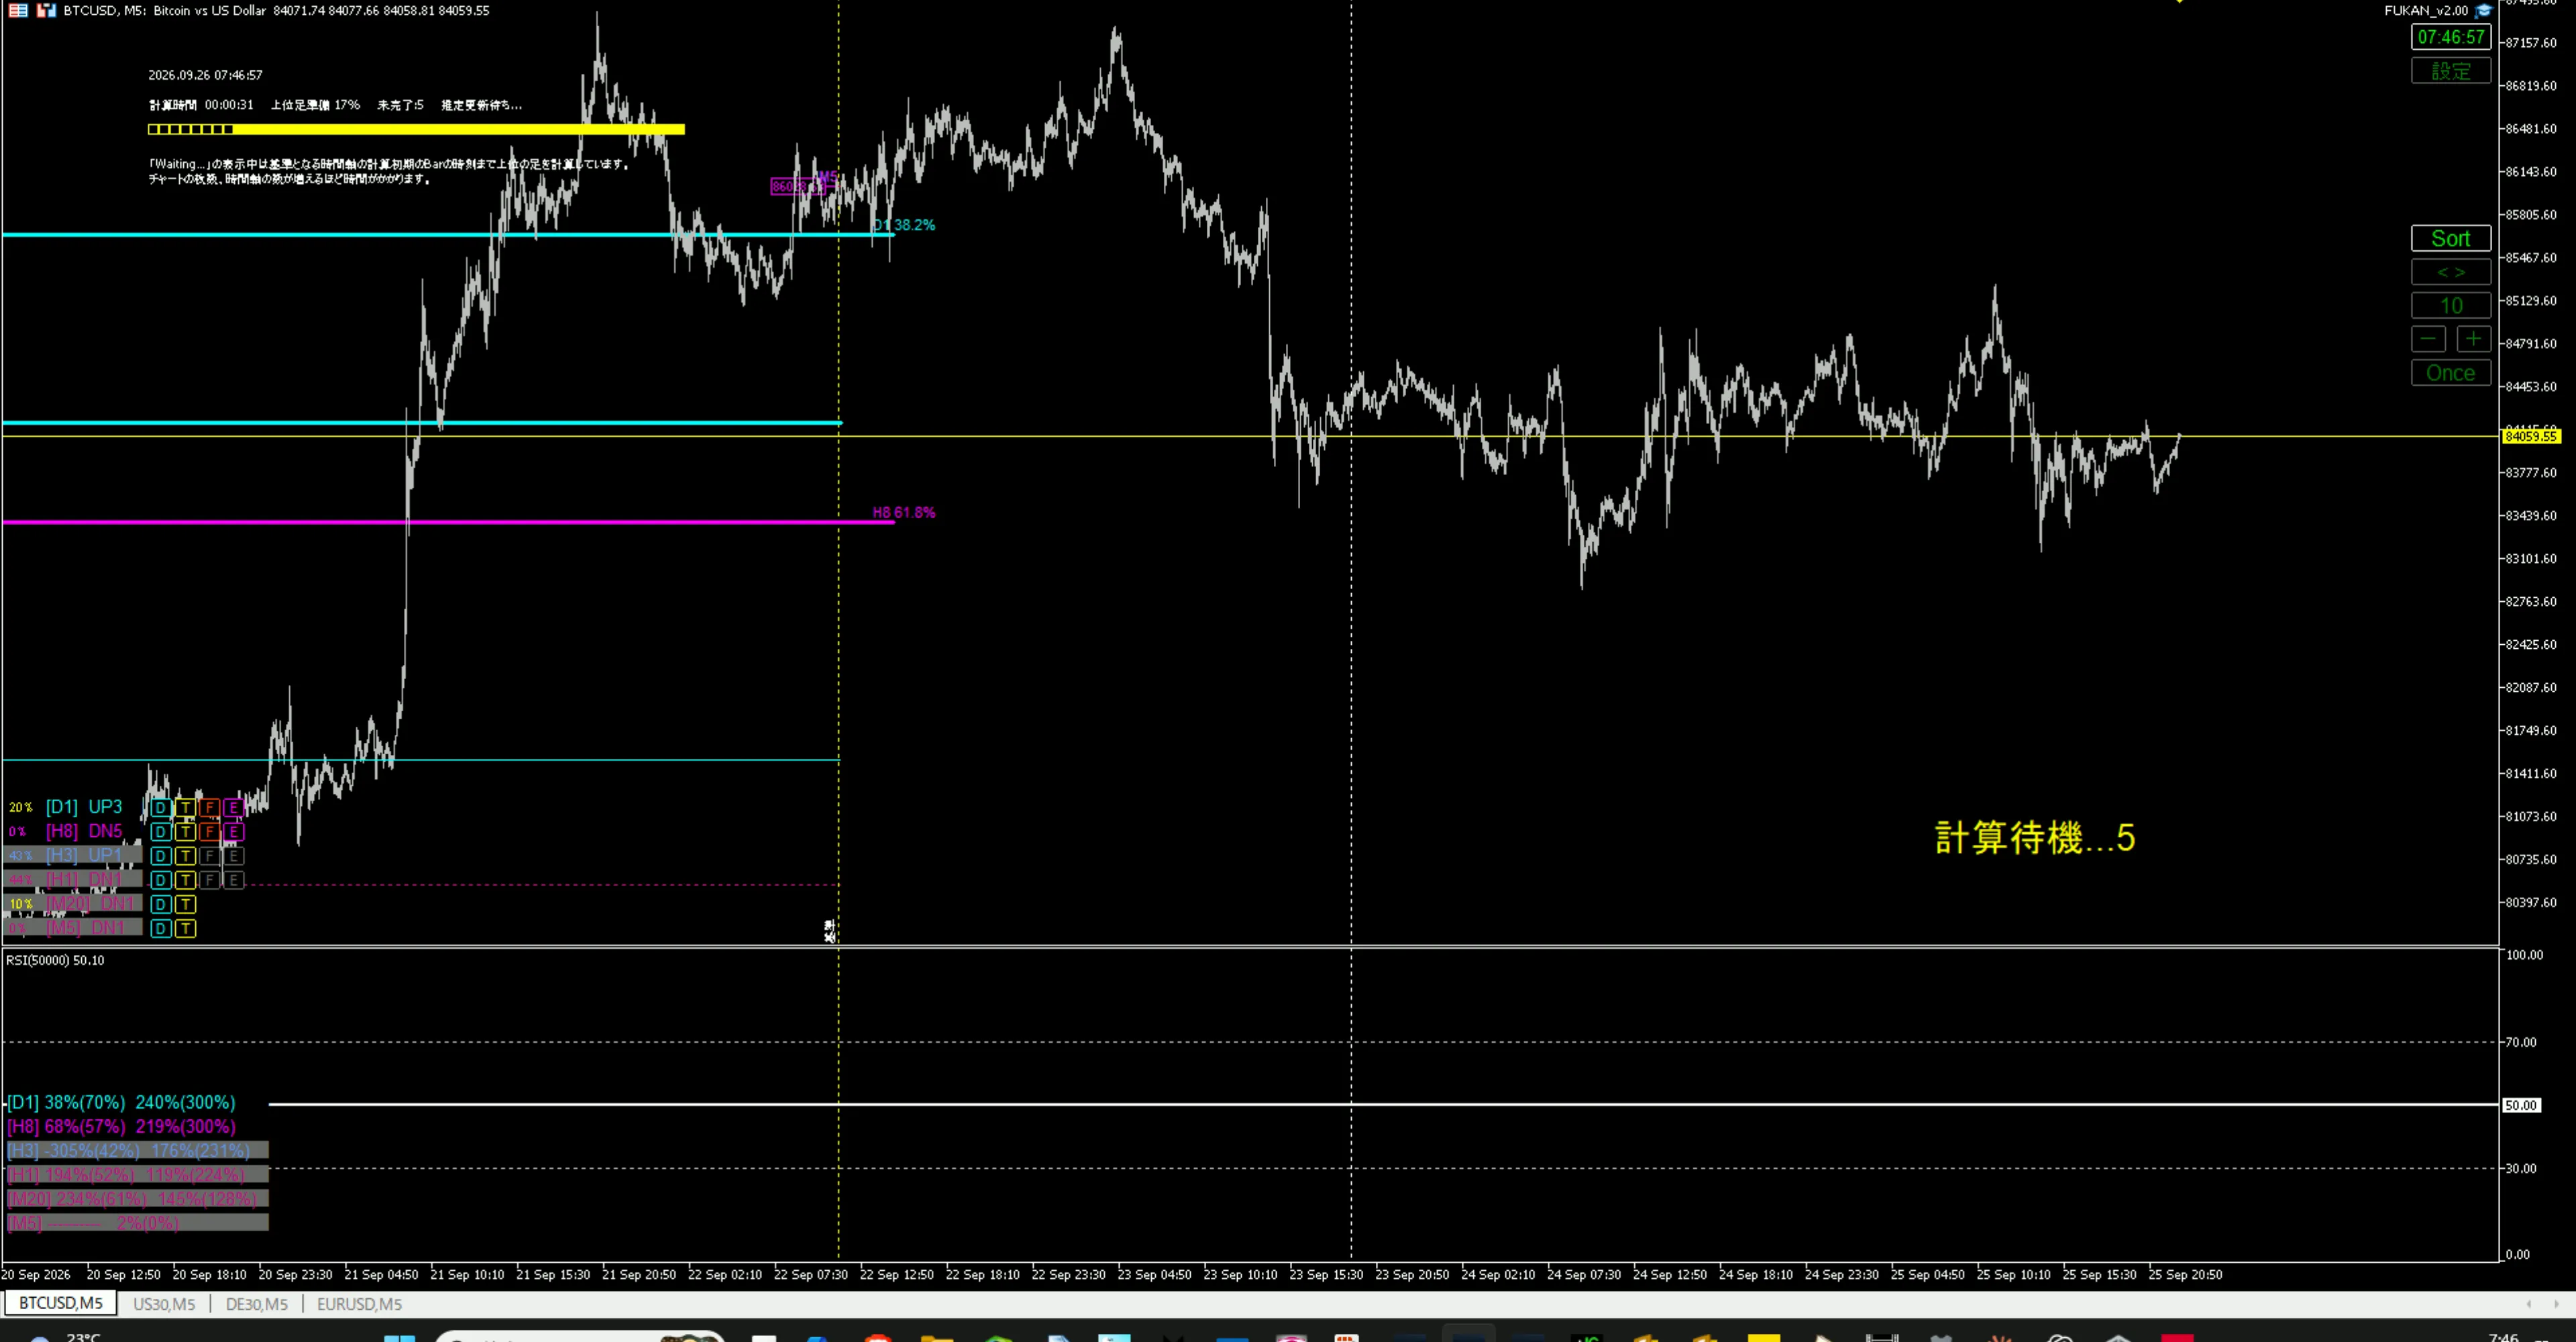
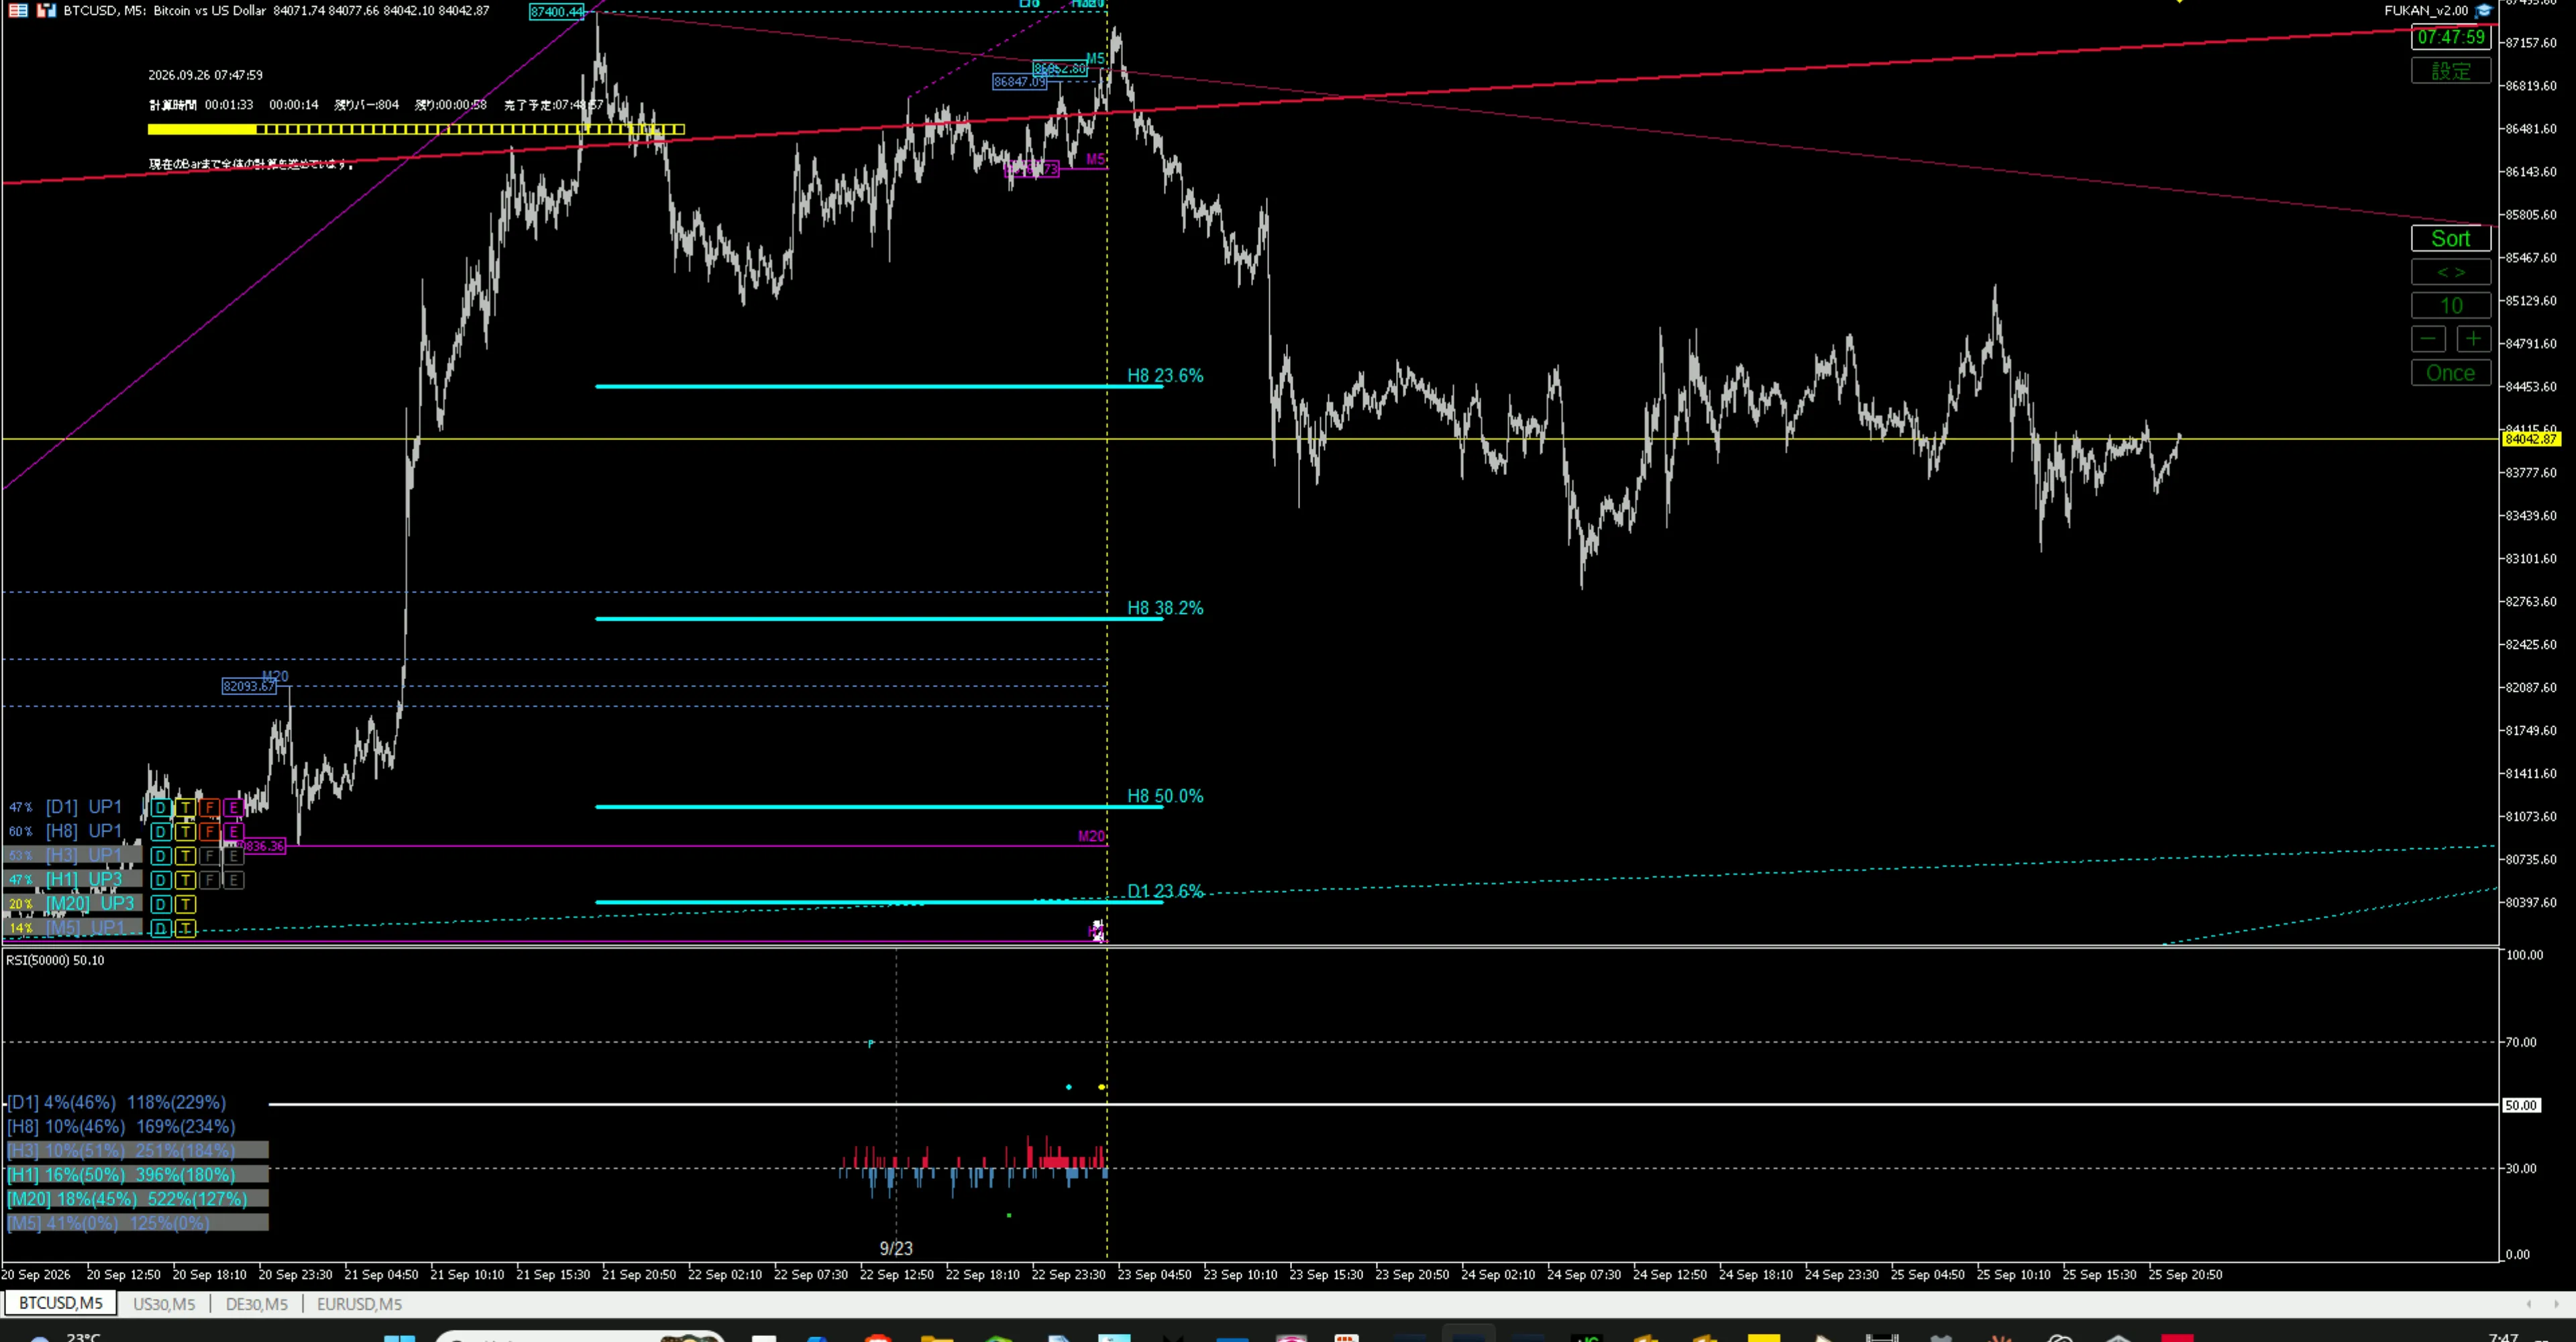
During the initial calculation, all lines do not appear on the chart from the start. The recording screen shows a calculation-wait display and lines being added progressively. This video documents these steps in chronological order, not just a final screenshot after completion.
3|Process of Displaying Multiple Timeframes
As drawing progresses, horizontal lines, diagonal lines, and labels are added to the screen. With FUKAN, you can reference multiple timeframes on the same chart. The real-time measurements here depend on the features displayed and the history conditions, so finishing at the same time in another environment is not guaranteed.
4|Viewing All 4 Charts, Not Just One Instrument
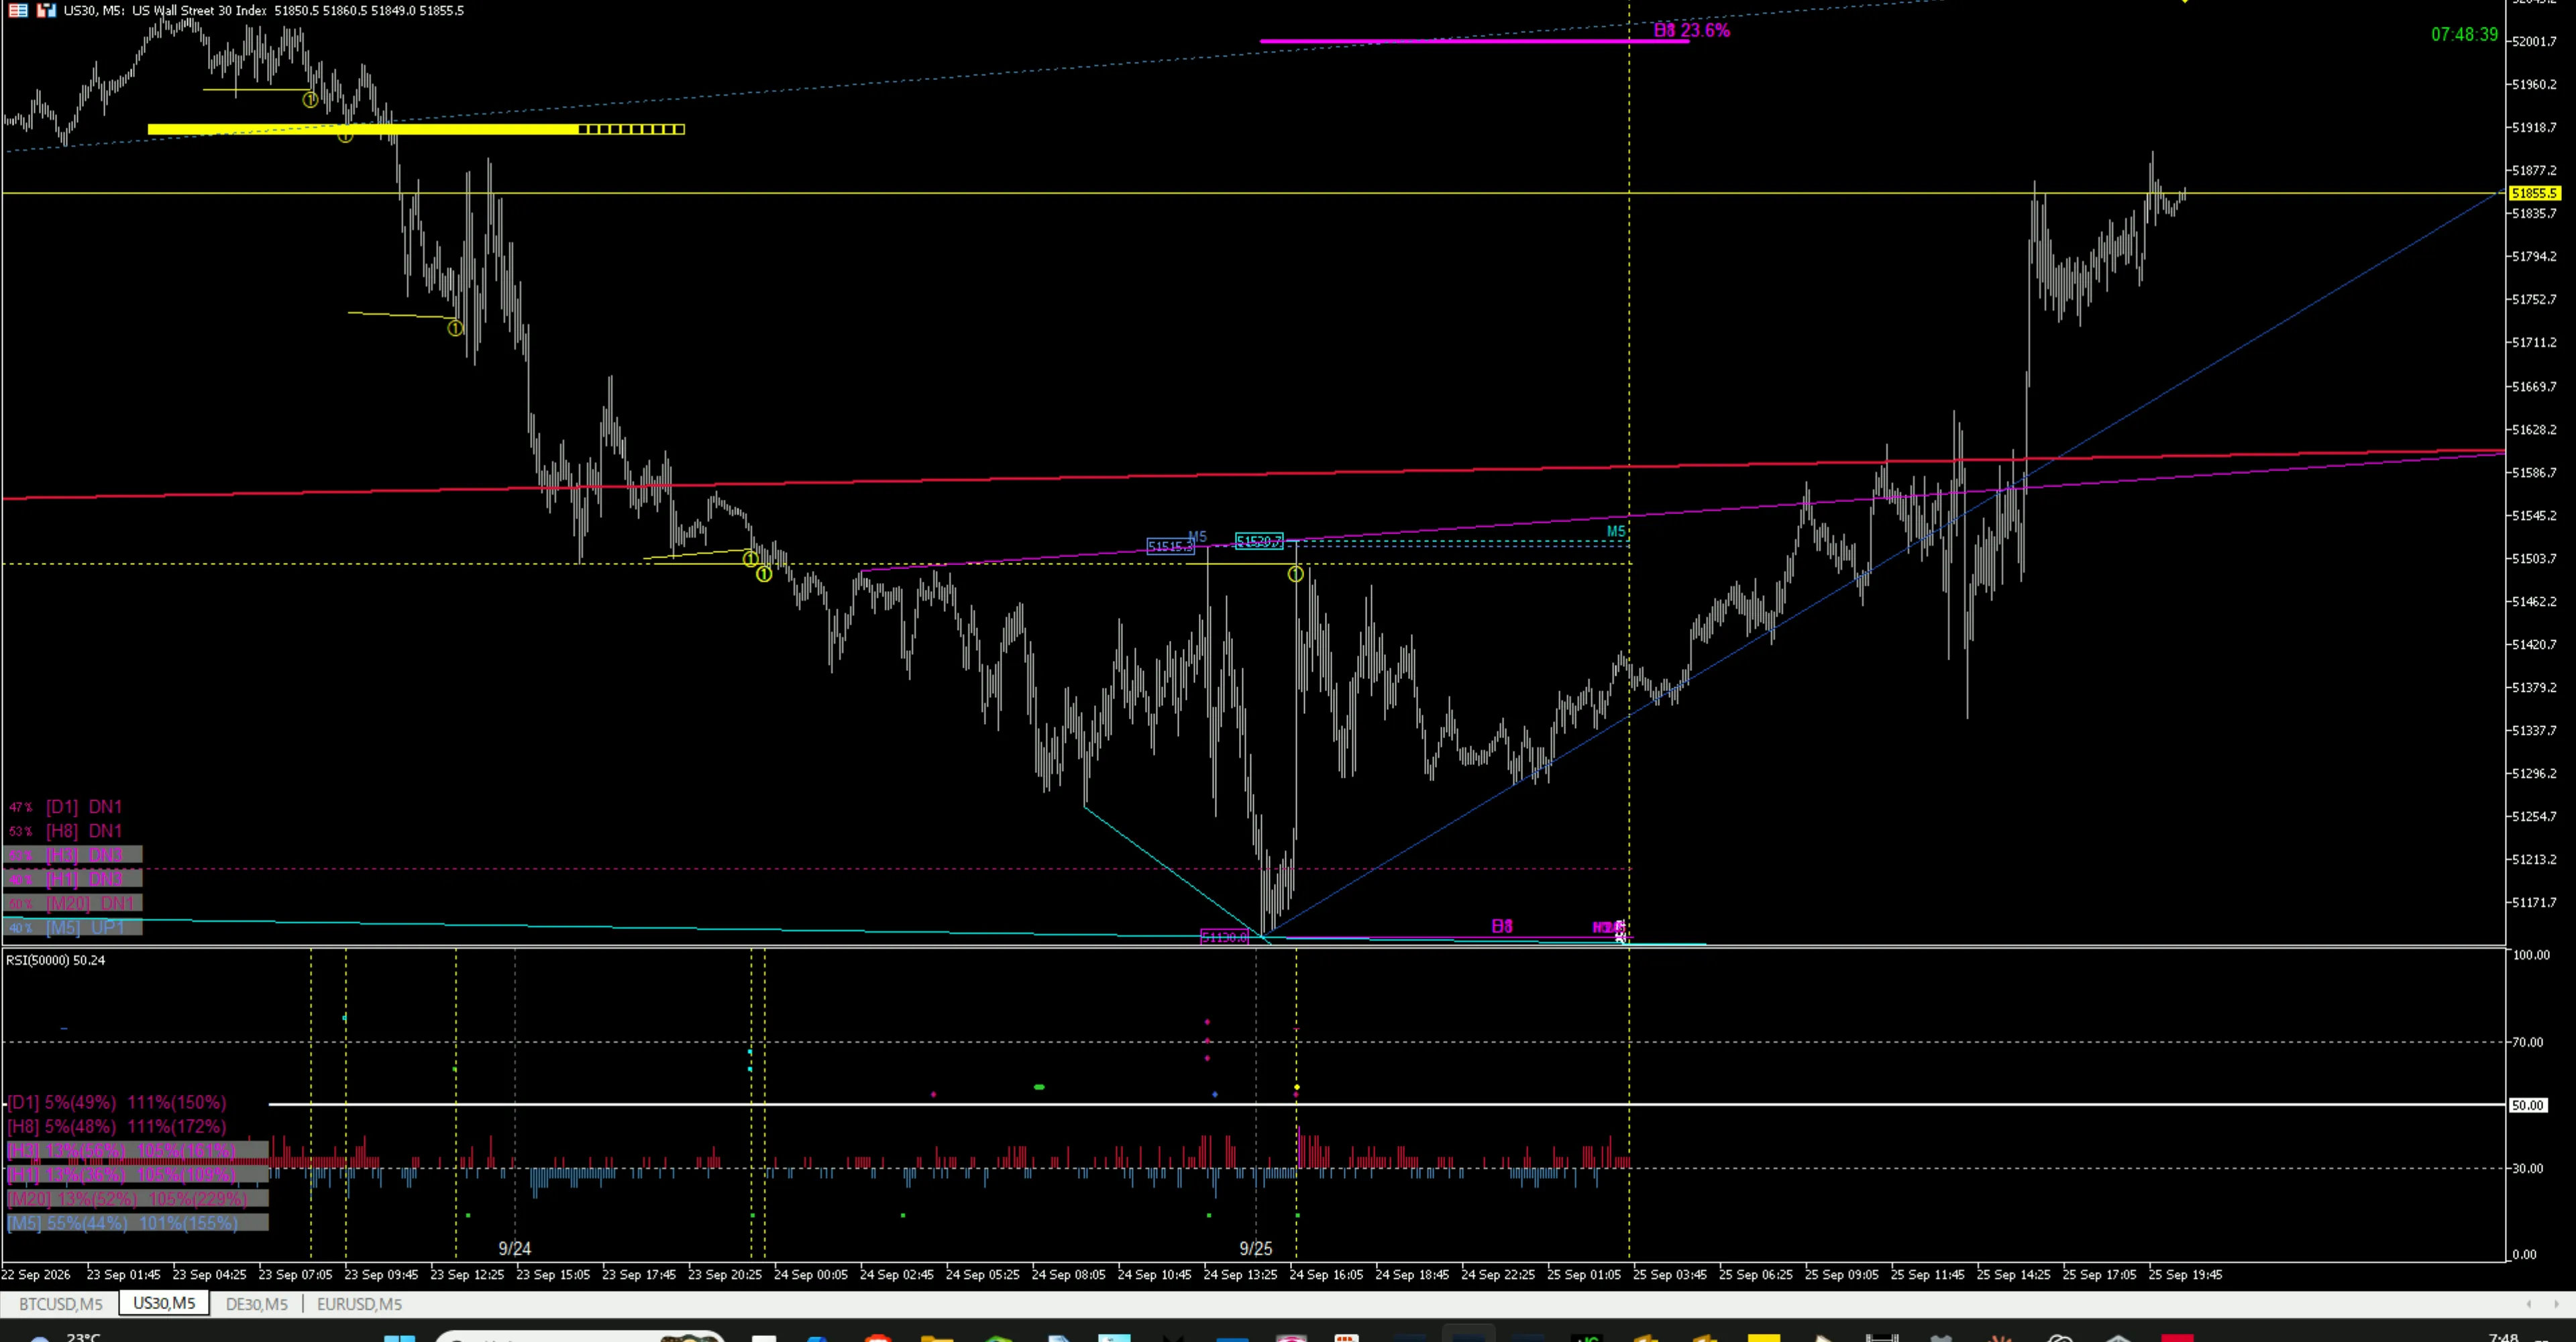
In this recording, we started and completed the calculation while four instruments were open simultaneously, not just a single chart. After confirming the rendering status of each chart, all four charts are displayed together at the end.
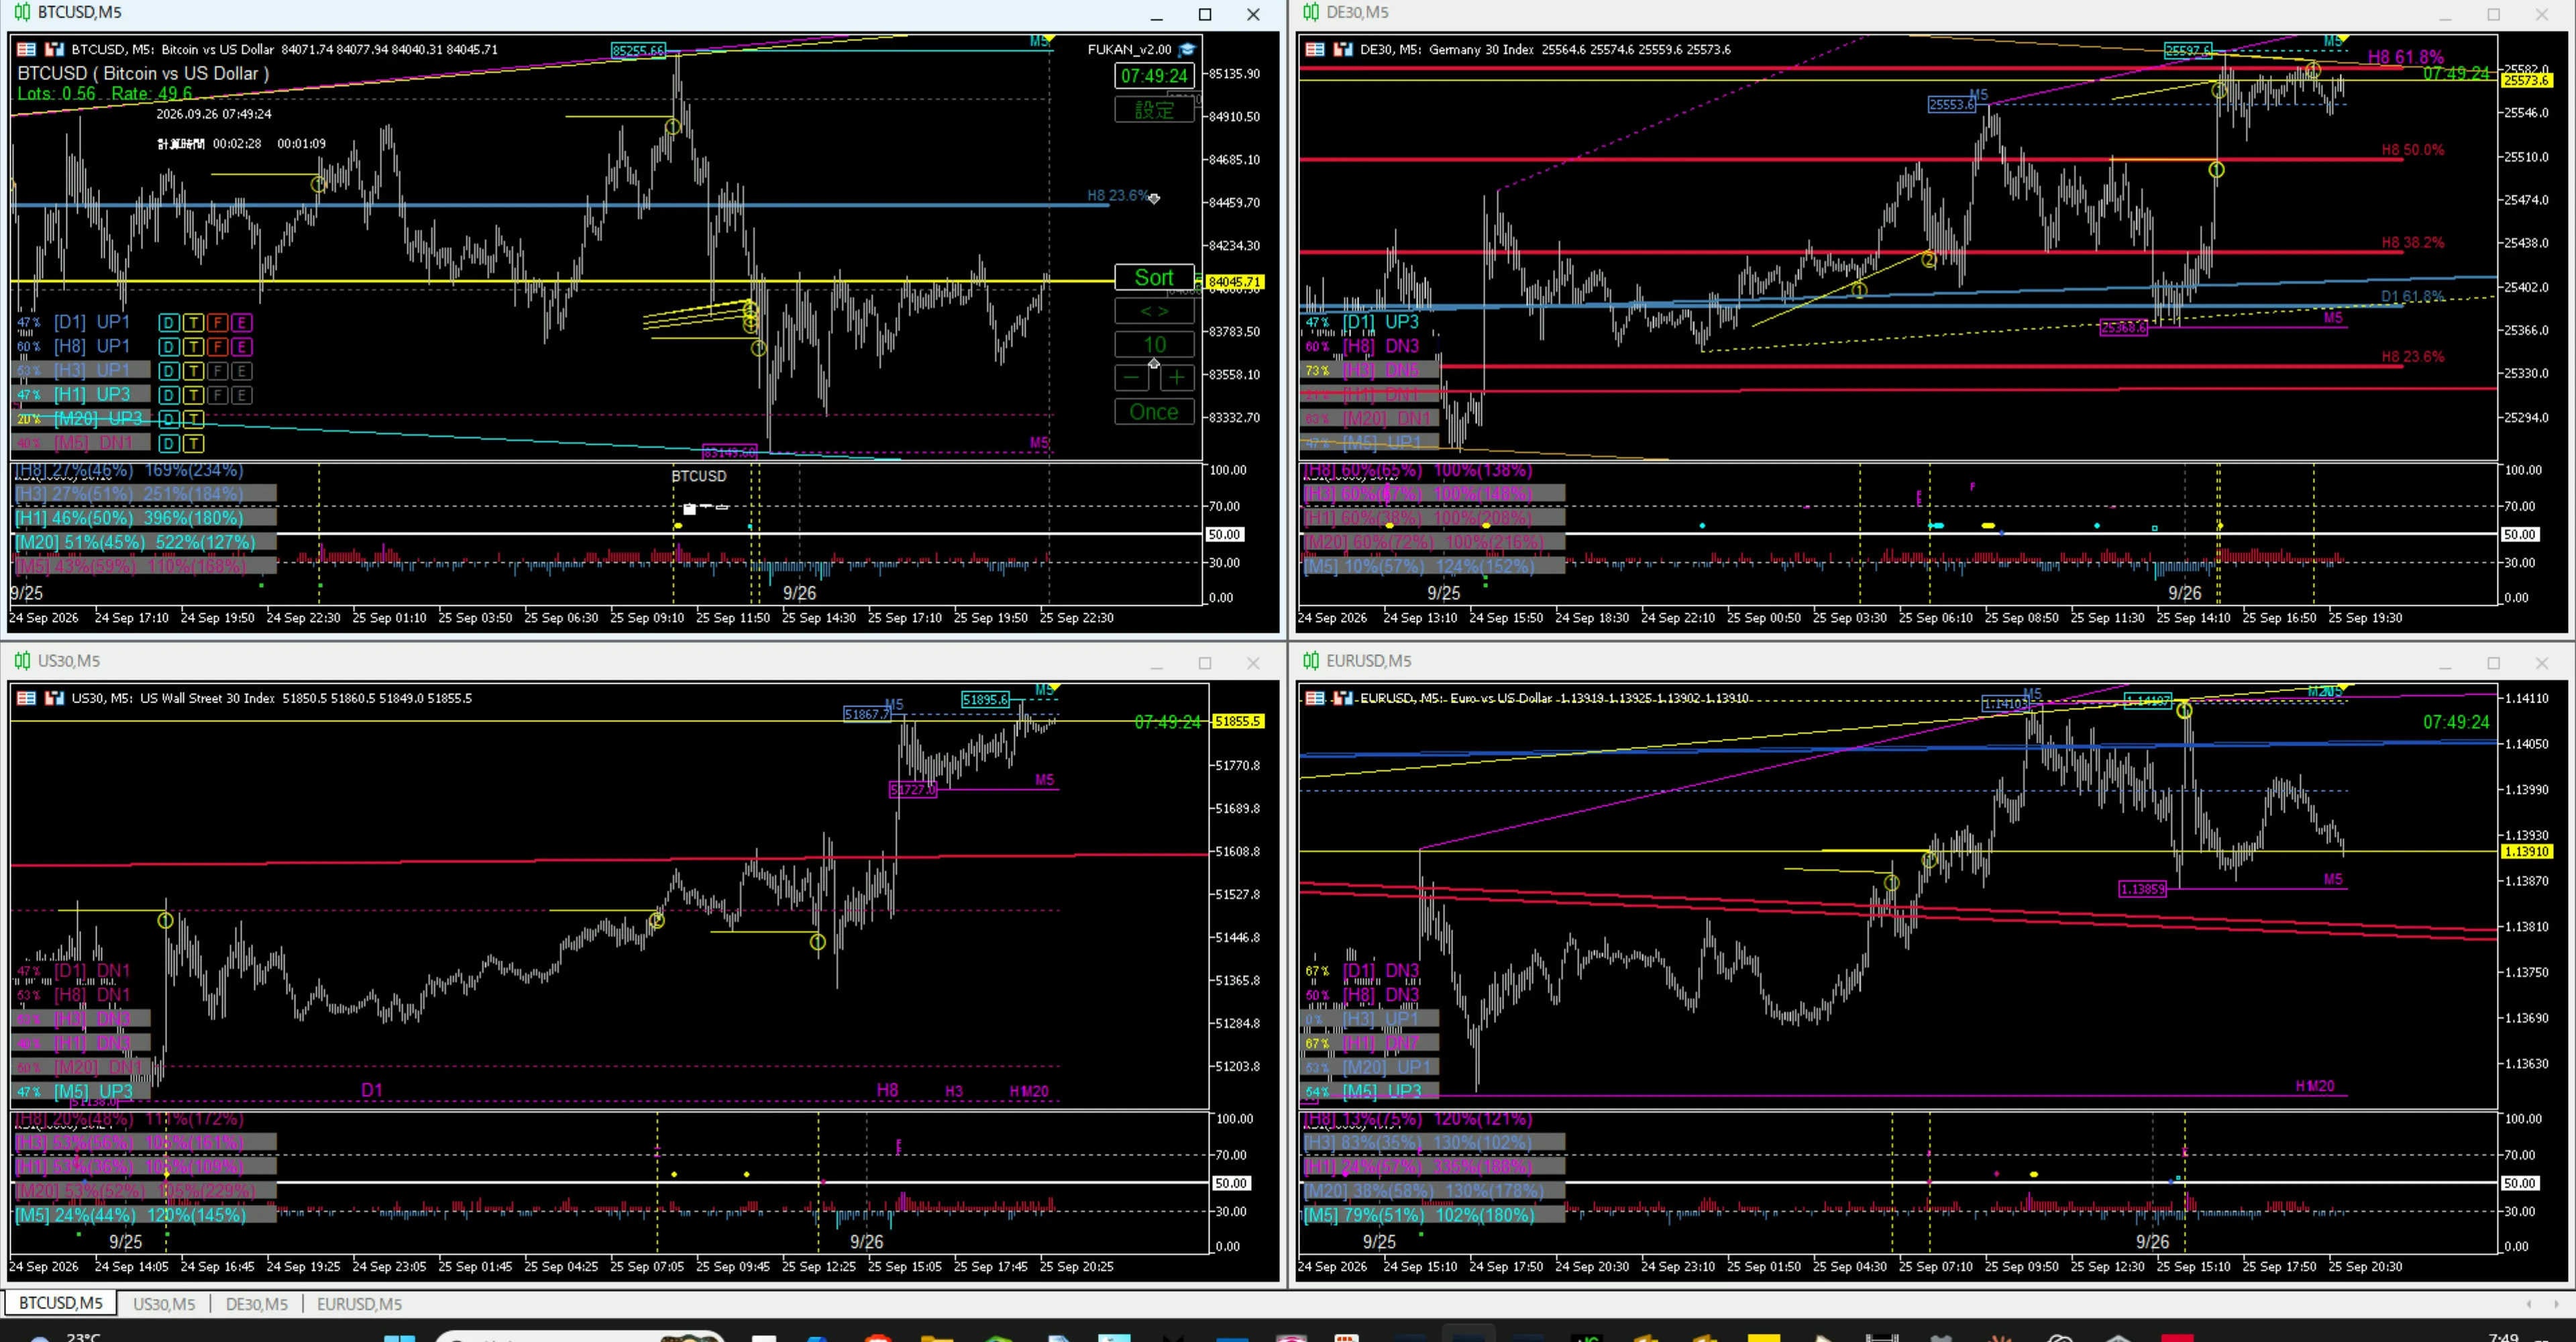
5|Initial Calculation Completed in 2 Minutes 28 Seconds (Actual Time)
Under the current demo environment and settings, the measured completion time was 2 minutes 28 seconds. In the final portion of the video, you can verify the calculation time in the top-left and the four charts after completion. Note that this recording took place over a weekend, so for DE30, US30, and EURUSD, some displays such as price tags may not be shown due to market closure. The absence of tags other than BTCUSD does not mean that the initial calculation is incomplete.
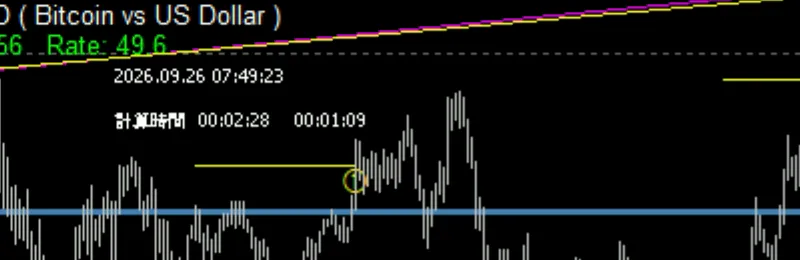
This is the original shot with the top-left calculation time display cropped. It shows 00:02:28. There are other time displays as well, but this article does not speculate on their breakdown.
About the Comparison with old Market Wave
The old Market Wave was a product for MT4, and re-measuring under the same conditions was not possible. Therefore, rather than presenting numerical figures like “how many times faster,” we record the conditions and real measurements that can be confirmed with the current FUKAN.
Check on the Actual Screen
Try FUKAN
For information on FUKAN’s features and the 7-day trial,GoGoJungle FUKAN product pageplease check it. First, please verify the display and calculation time in your own MT5 environment.
This article records product operation and market observations and is not investment advice or a buy/sell recommendation. It does not guarantee future price movements, profits, or win rates. Processing time and display content vary depending on the PC environment, account/broker history, instrument, and settings.