
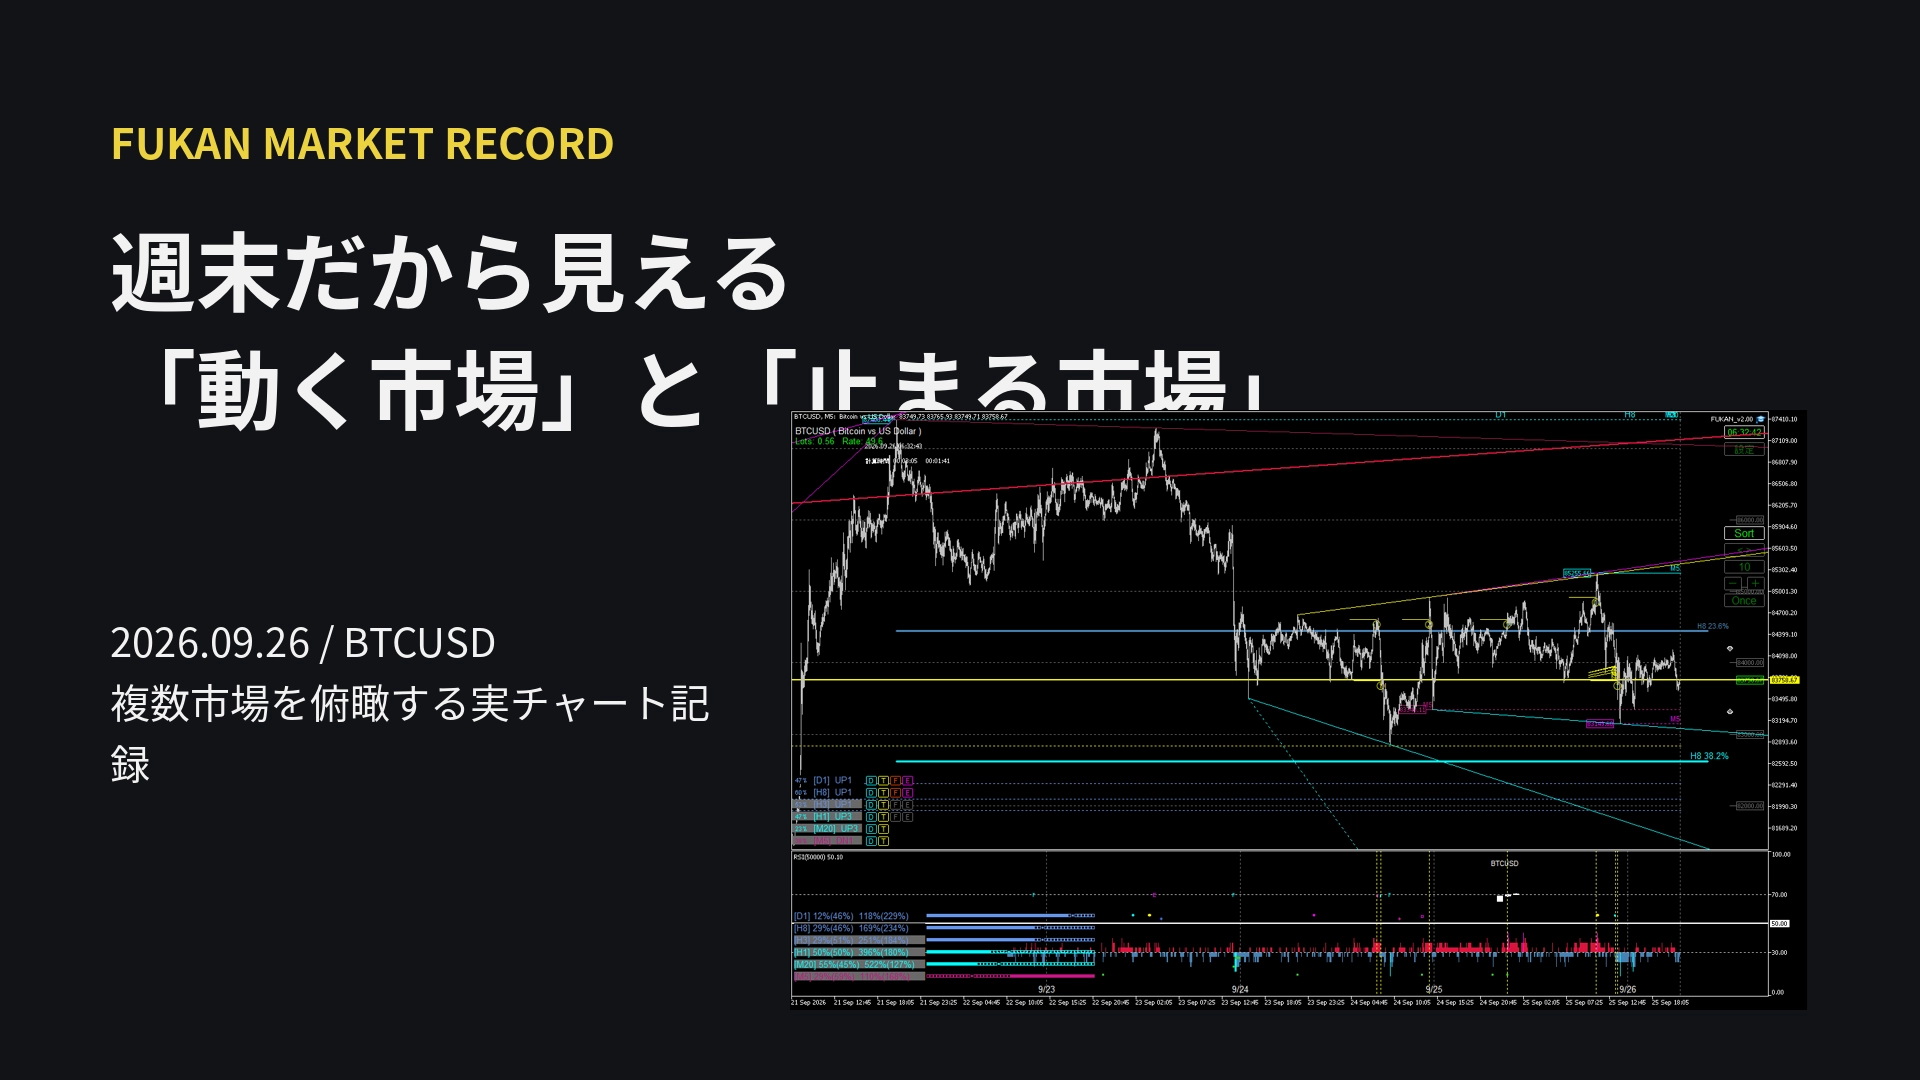
Because it's the weekend, the "moving market" and the "stopped market" become visible
FUKAN Market Record|Because it's the weekend, the "Moving Market" and the "Stopped Market" you can see
This is the actual chart record for Saturday, September 26, 2026.
On weekdays, when you view stock indices, FX, and crypto assets in the same screen environment, every market moves at the same time, so people tend to focus on the amount of information displayed on the screen. However, on weekends the situation changes. While markets like DE30, US30, and EURUSD are closed, BTCUSD continues to trade.
This time, using that difference, we’ll look at what it means to “view the market from above with FUKAN” from actual BTCUSD time progress.
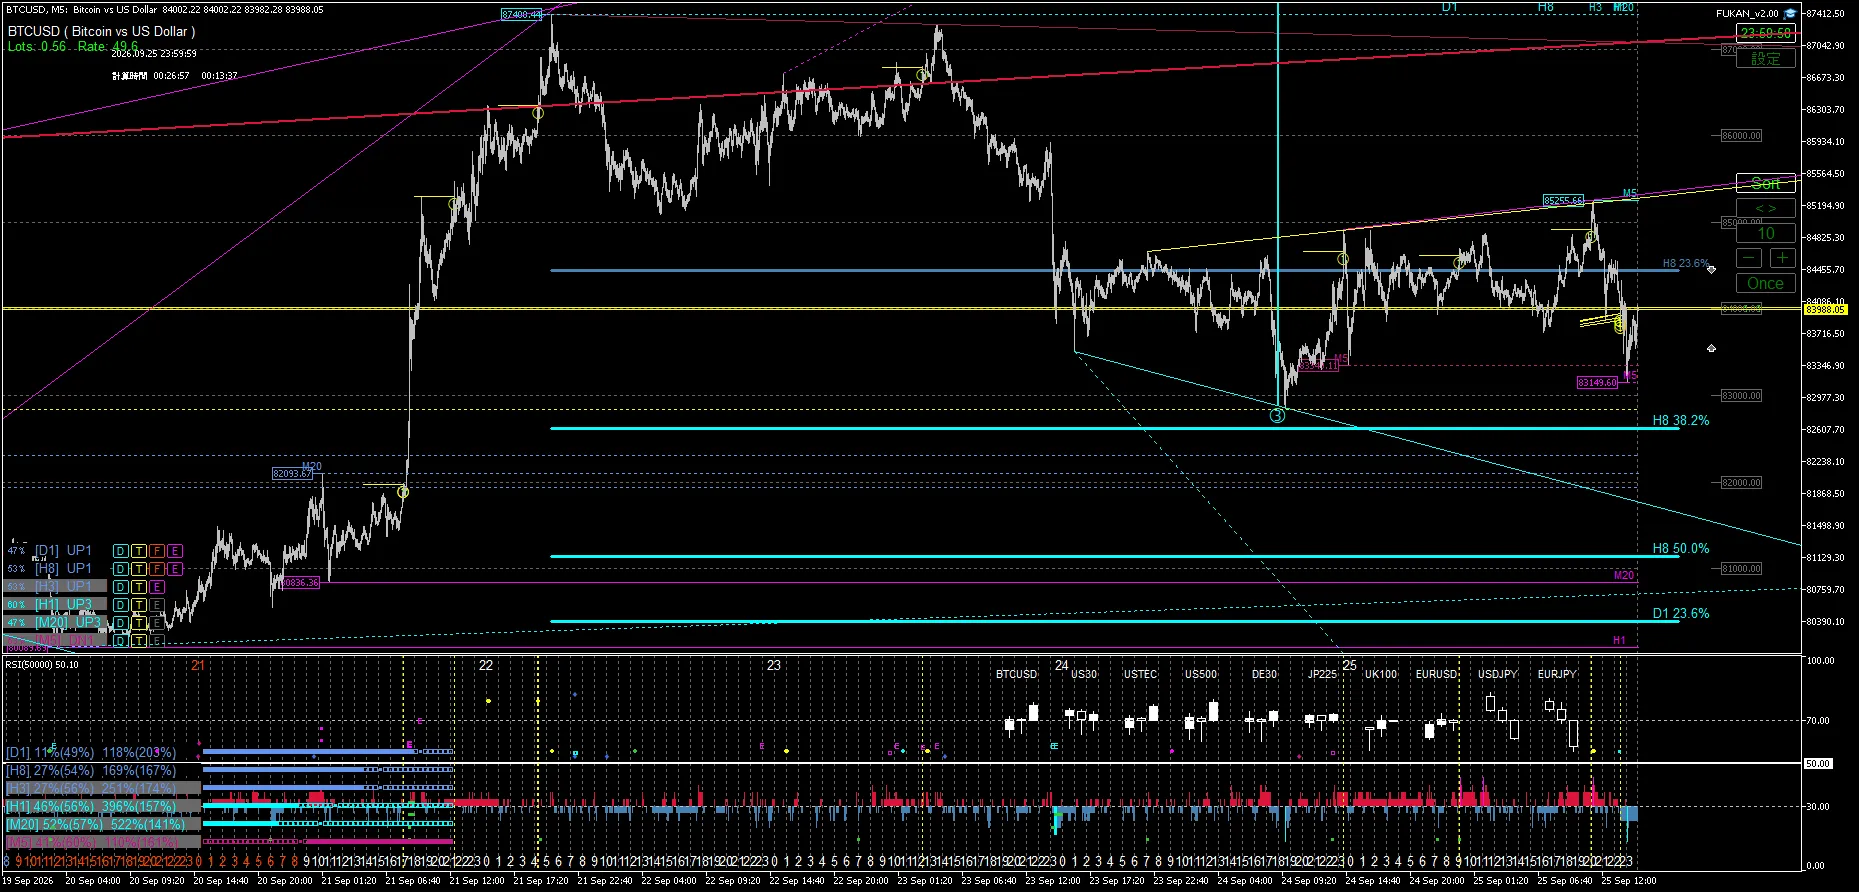
00:00 — BTCUSD advances while leaving the position after Friday close
The first image is BTCUSD at 00:00 on September 26. While lines calculated from multiple timeframes remain, the price is moving at the right edge. What’s important is not seeking the answer to buy/sell from a single line. It is to be able to see on one screen where the current price lies among the multiple higher and lower levels.
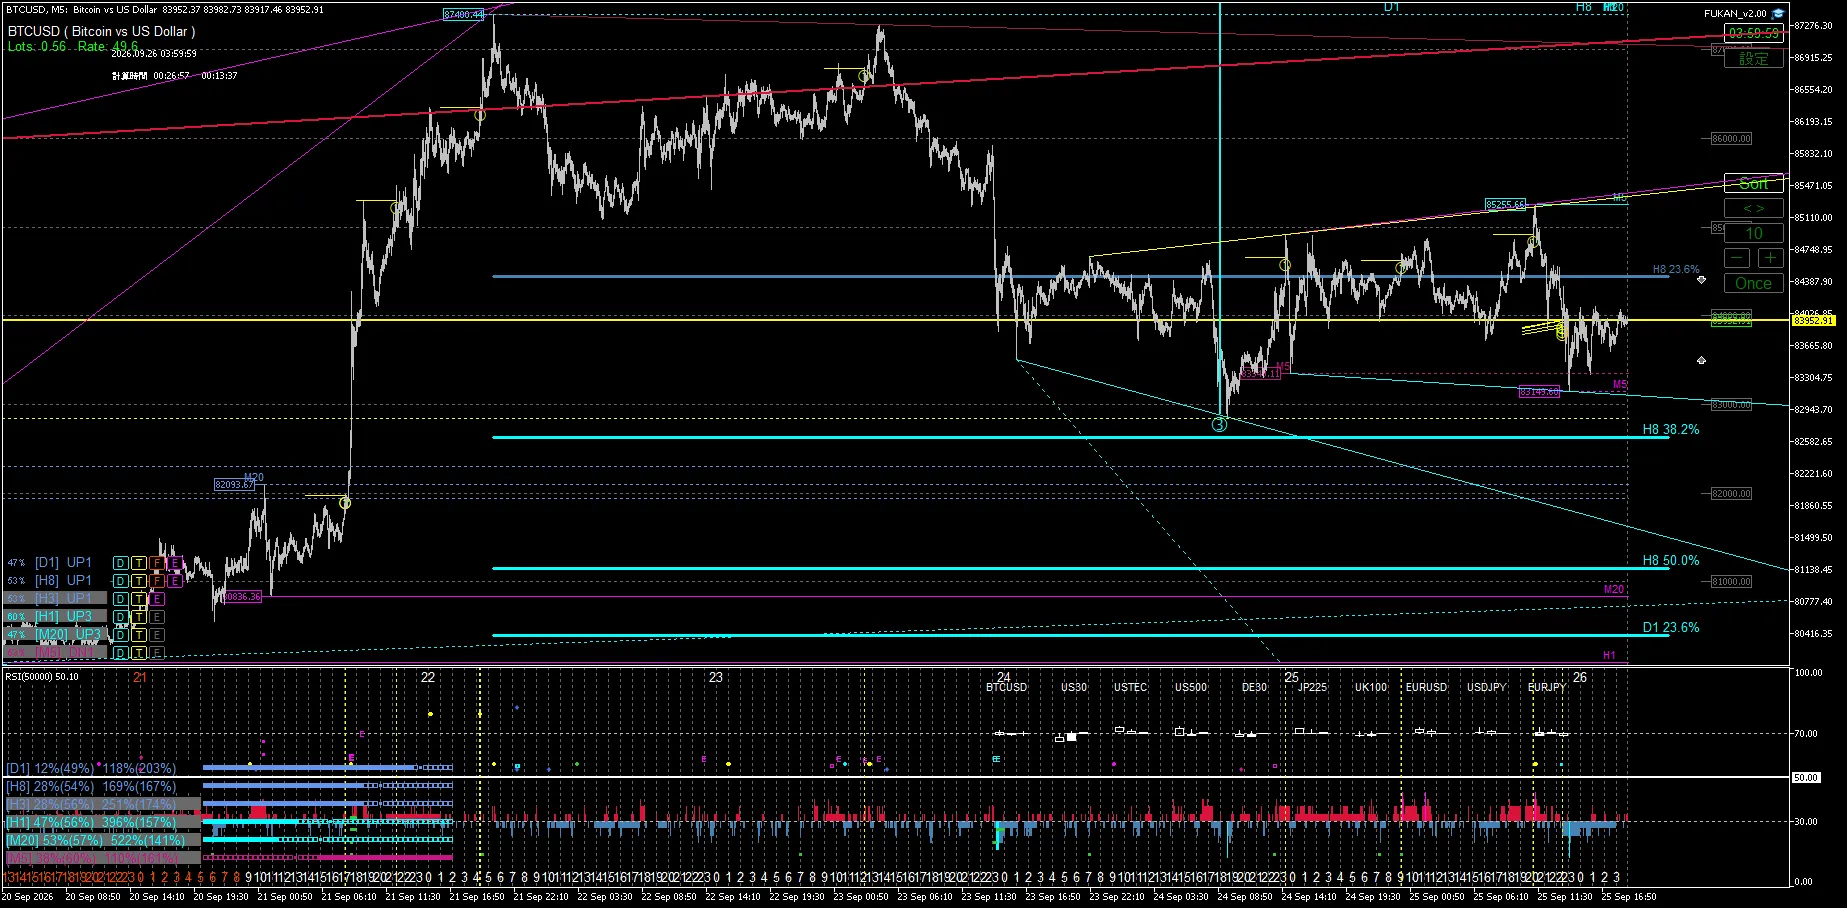
04:00 — As time advances, movement within the same map becomes visible
Even about 4 hours later, BTCUSD is still moving. Rather than rebuilding the entire screen to compare, by looking at how the right-edge price moved within the same structure, it becomes easier to separate short-term price action from higher-timeframe levels.
One of the reasons for developing FUKAN was to reduce the mental effort of reconstruing positional relationships every time you switch timeframes. You can view information from M5 while also seeing M20, H1, H3, H8, and D1 information on the same coordinates.
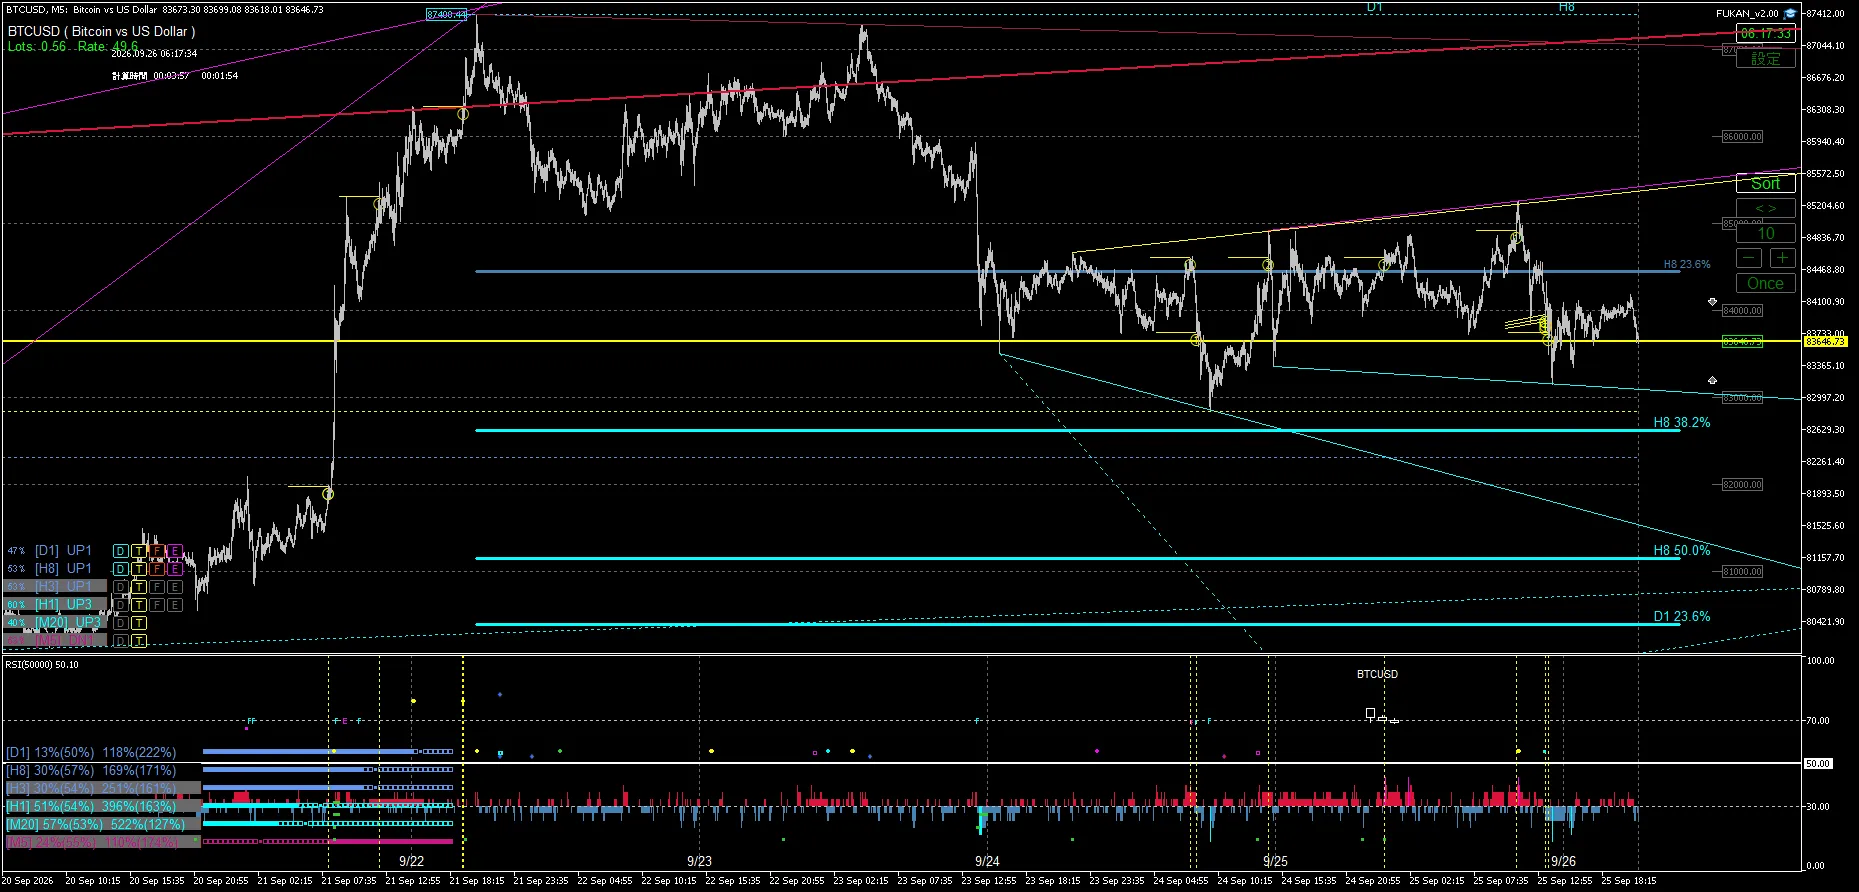
06:17 — Even during weekend price moves, distances to multiple levels change
At 6 o'clock, the right edge’s short-term ups and downs advance further. Here too, what we look at is not “which line will surely bounce,” but what levels derived from other timeframes exist around the current price, and how the price moves between them.
This is not a market-buy recommendation. It is for organizing information when reading charts. Some lines react, while others clearly pass through. Recording both is important for actually viewing the market.
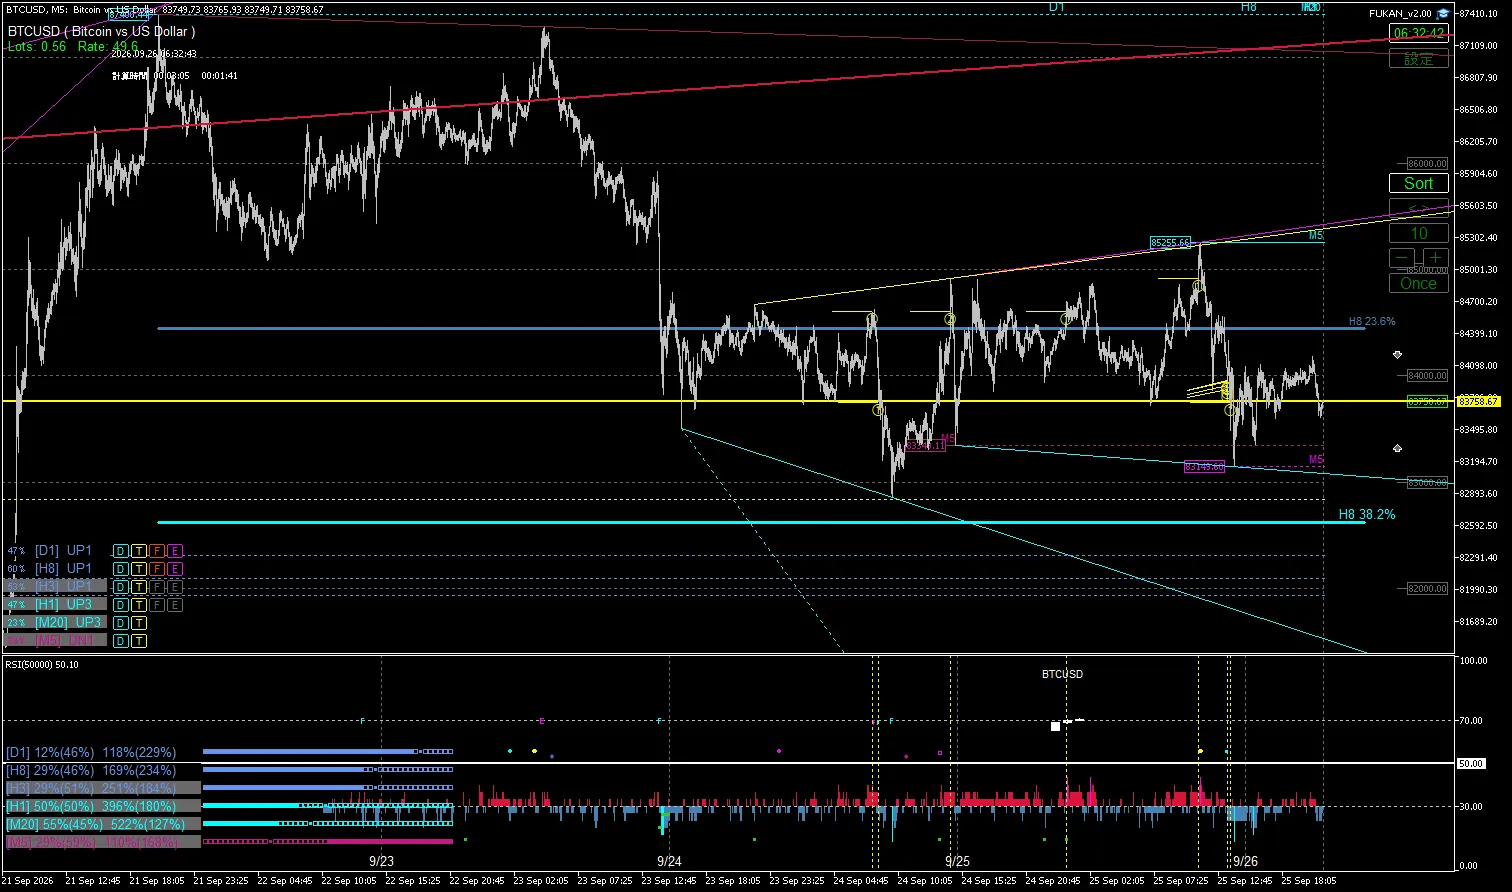
06:32 — Before looking at the “signs,” view the overall position
FUKAN offers yellow events and several other displays, but the core of the product is not a single signal. By overlaying different structures such as Dow, Trend, Fibonacci, and Elliott across multiple timeframes, it aims to provide an overview of the current position.
Since many markets other than BTCUSD stop on weekends, this way of thinking becomes easier to understand. If you only follow moving markets, you’ll more clearly see FUKAN’s fundamental idea: “where in the map is the price moving.”
So, how should it be used on weekdays
On weekdays, DE30, US30, EURUSD, and others start moving again. When you place multiple assets side by side, you can see that even in the same time frame, the structure and the reaction to lines differ by market. In future Market Records, we will record not only examples of reactions but also examples of breakthroughs and cases where there was little reaction.
FUKAN currently offers a 7-day Trial. If you want to confirm the display and timeframes you usually view in your actual MT5 environment, please see the Trial information on the product page.
※This article is a record of chart display and market observation and does not constitute a recommendation to buy or sell any specific financial instrument. It also does not guarantee future price movements or profits.