

【Maasan Trend Arrow Update】From "a sign appeared" to "you can now tell where to aim"
Hello, I am Maasan.
In the previous article, I explained how I actually trade Gold (XAUUSD).
Confirm the big trend on the 1-hour chart
↓
Confirm the trend direction on the 5-minute chart
↓
Look for entry timing on the 1-minute chart
This is the flow I trade with.
And,
“Maasan Trend Arrow is not a tool to enter blindly just because an arrow appears.”
That’s what I also conveyed.
This time, here is the continuation.
Currently, Maasan Trend Arrow is undergoing a new update.
With this update, what I aim for is,
“Not just 'I see a signal, so I look at the chart'”
but
“Make the places closer to the conditions I actually target easier to understand.”
That is the goal.
We will introduce it using real charts.
The week is over, so the current real-trade results
In the previous article, I also posted the mid-September 2026 progress.
At that time,
+436,393 yen
was the result.
And after continuing to trade, as of September 25, the result is
+725,670 yen
.
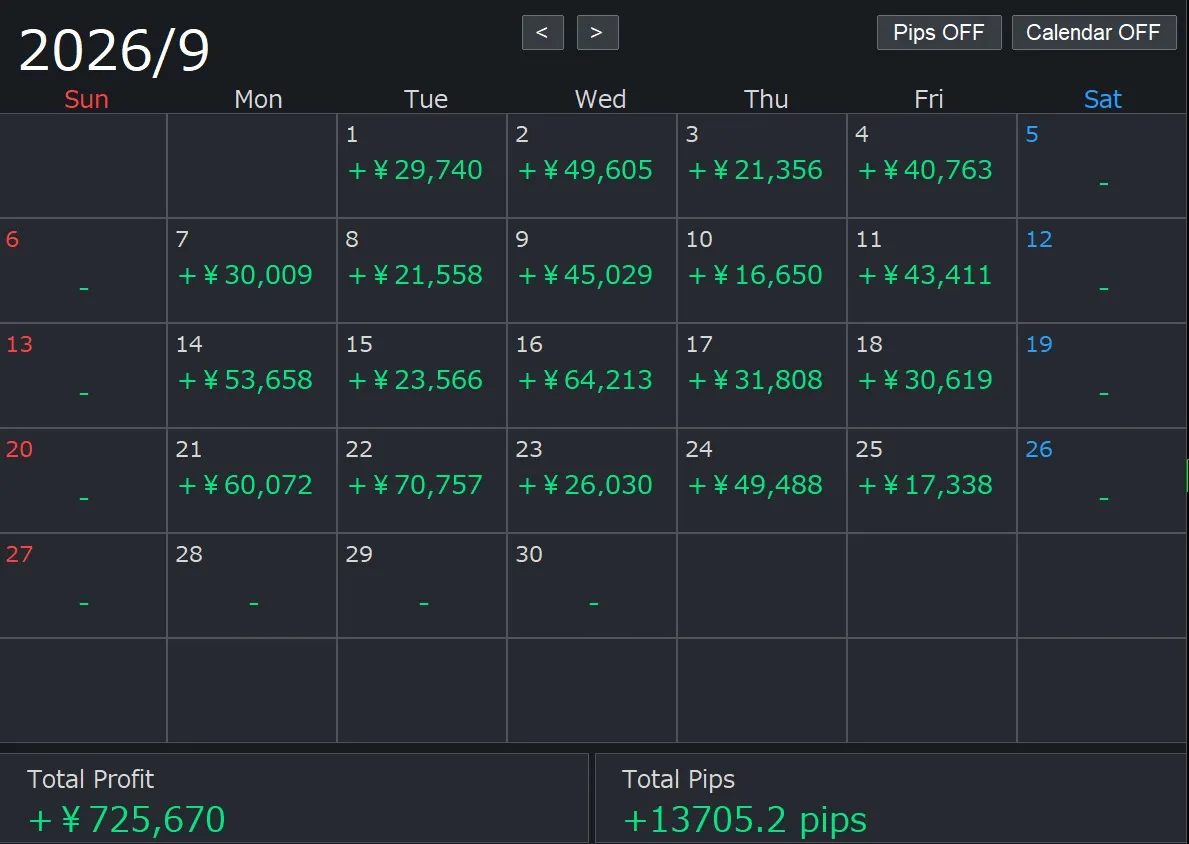
Of course, this result does not mean
“Anyone can achieve the same profit by using Maasan Trend Arrow.”
.
The results vary greatly depending on lot size, number of entries, market conditions, take-profit and stop-loss decisions, etc.
I am reporting based on my own actual trading results.
And what I consider important is,
“not just how much I won.”
Even more important is
“Why did I enter there?”
That part is what this update aims to make even easier to understand.