
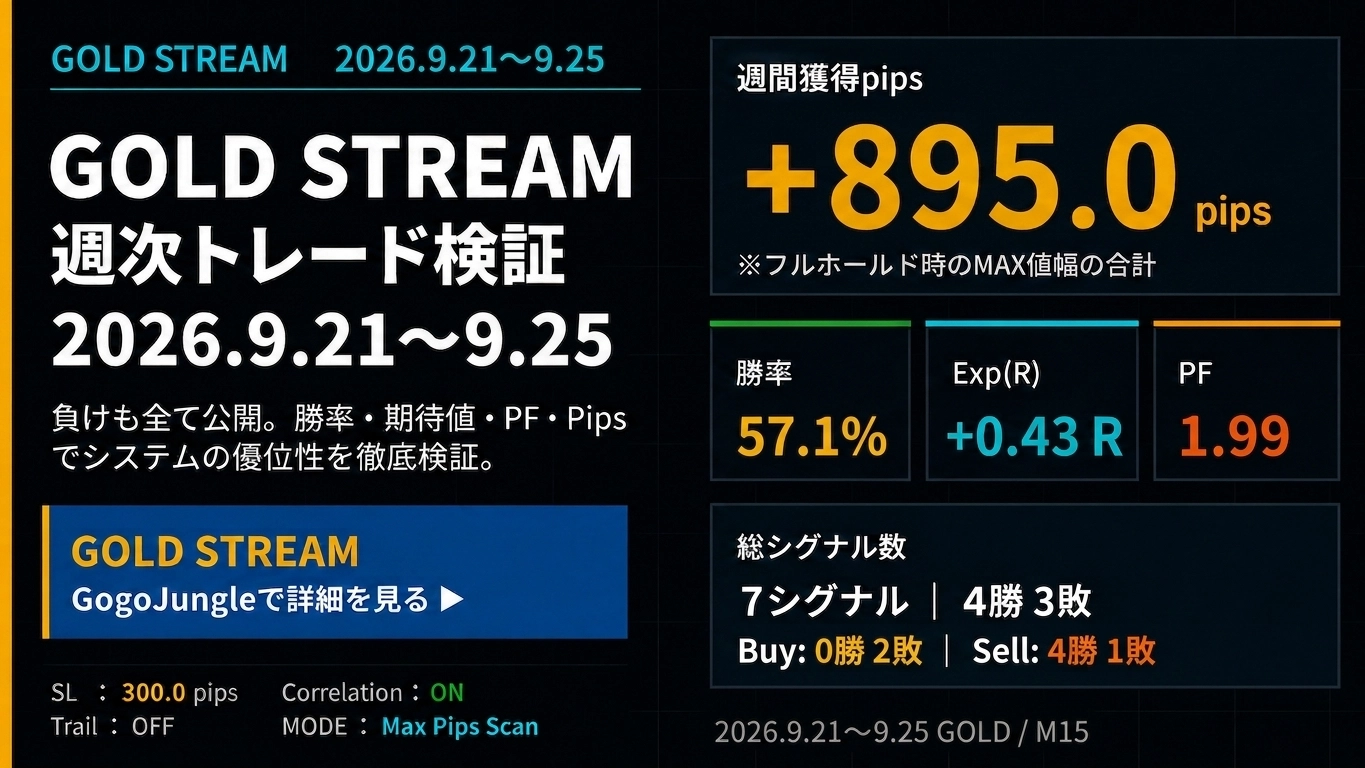
+895pips【Weekly Trade Verification & Delivery History】GOLD Day Trading Specialization "GOLD STREAMv2" 2026.9.21~9.25
+895pips【Weekly Trade Verification & Delivery History】
GOLD Day Trading Focus "GOLD STREAM v2" 2026.9.21–9.25
Verify GOLD’s price movement, strength, and correlations, and assess signal accuracy, range, and expected value every week. Not only win rate, but also PF, Exp(R), and 5-day ADR comparisons are included to evaluate this week's trading environment.
① GOLD Market Analysis
1. Price Trend
From September 21 to 25, GOLD traded with strong downside pressure in the second half after initial buying pressure, forming a sharp downtrend. Initially: range-bound, but major indicators and dollar buying in the FX market caused a rapid trend reversal. Volatility was high, making direction determination extremely challenging.
2. Supply & Demand / Investment Factors
Central banks’ ongoing gold purchases provide medium- to long-term support, but actual demand buying was limited due to caution over sharp price swings. Since prices remained near highs, profit-taking selling pressure tended to lead the supply-demand balance.
3. Investment Trends
Institutional investors and gold ETFs showed some hedging demand against geopolitical risk, while speculative funds sensitive to short-term interest rate moves moved notably in and out. This short-term capital flow contributed to a sudden decline in the latter part of the week.
4. Overall Assessment
This week’s 5-day ADR was727pipsand provided enough volatility for day trading. However, because the trend clearly reversed from early-week “buying” to late-week “selling,” it was a risky environment to hold a single directional bias. The week tested the ability to identify turning points in strength/weakness accurately and to flexibly switch viewpoints.
⑤ SILVER / COPPER Market Conditions
SILVER
SILVER followed GOLD’s decline, with selling dominating toward the end of the week. Uncertainty in industrial demand also weighed on upside potential.
COPPER
COPPER continued in a range-bound, nervous pattern due to expectations of further Chinese stimulus and global growth concerns, lacking a clear directional bias.
② GOLD STREAM v2 Weekly Trade Verification
Weekly Verification Results
③ GOLD STREAM v2 Delivery History
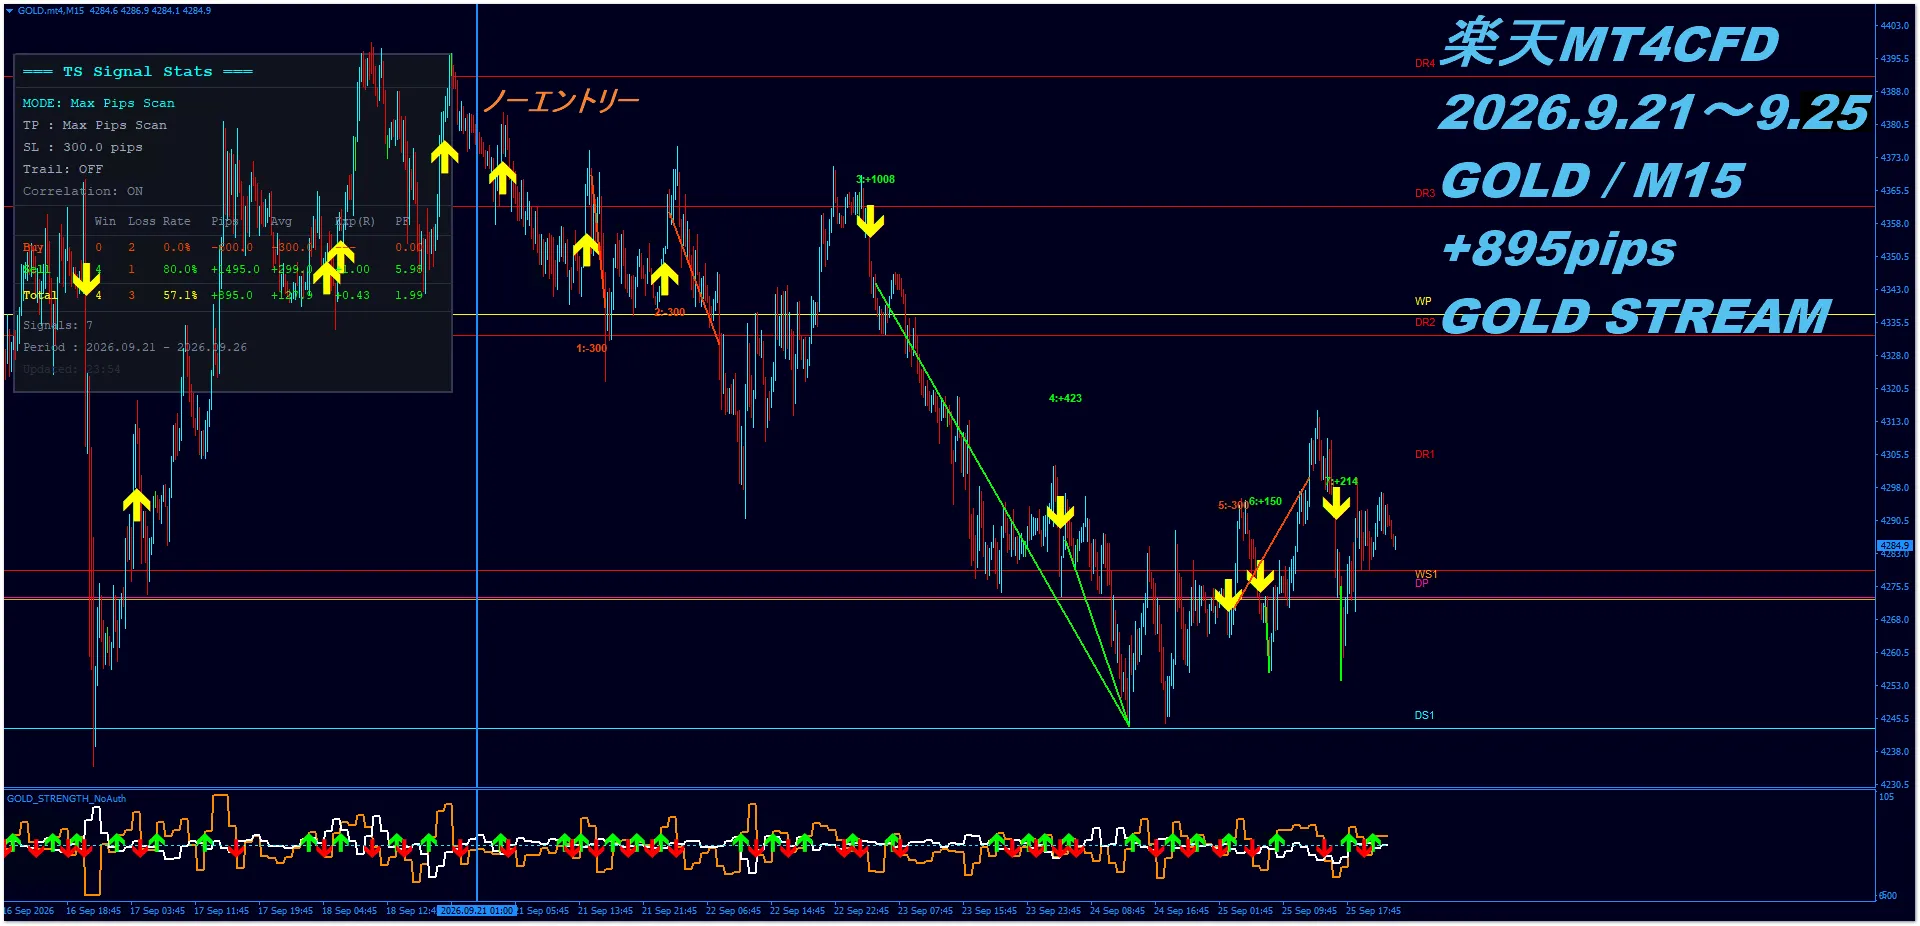
Weekly Signal Delivery History

④ Weekly Verification AI Evaluation
This week5-day ADR 727pipsprovided ample range for day trading. We evaluate how the tool performed against sharp chart reversals using metrics such as win rate, PF, expected value, and range efficiency.
■ Signal Judgment and Entry Precision
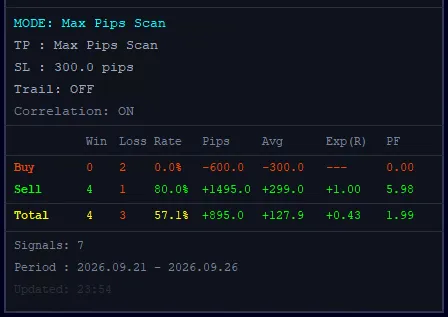
In the verification panel,a total of 7 signalswere recorded, with results4 wins, 3 losses; win rate 57.1%. Notably, Buy signals had 2 losses (-600.0pips) while Sell signals achieved 4 wins and 1 loss, demonstrating outstanding precision and generating a substantial decline trend with+1495.0pipsrange.
Total MAX Range+895.0pips. In an environment where 5-day ADR is 727pips, this is an excellent result that exceeds the weekly total volatility.
Additionally, the Strength/Correlation filter helped avoid one entry due to correlation mismatch,proving that the logic to filter out unaligned signals is functioning properly and only strong, aligned signals are selected.
■ Performance from Win Rate, PF, Exp(R)
Win rate 57.1%, while the number of wins and losses are balanced,Total PF 1.99 demonstrates the principle of cutting losses and maximizing gains. Notably, Sell signals have PF of 5.98, which is remarkable.
Exp(R)+0.43shows that, with a fixed SL of 300pips, the average per-trade expectation remains positive, indicating robust profitability even during abrupt market shifts.
■ MAX Pips Scan & SL
This chart usesMODE: Max Pips Scan / Correlation: ON.
Displayed pips reflect the MAX value when price moves are fully held after signal generation.+895pipsdoes not represent actual fill profit.
Additionally, stop loss (SL) determination isbased on the 4-hour chart. It is not determined solely by short-term movements on the M15 chart.
■ GOLD Market Difficulty
★★★★☆ 4 / 5
Although the 5-day ADR of 727pips provided sufficient range, the week featured a “roller-coaster” where the trend reversed in opposite directions in the first and second halves. Fixating on a long or short bias could lead to severe losses, so the difficulty is rated 4/5 due to the challenge of calmly switching direction.
■ GOLD STREAM Weekly Trade Verification Evaluation
★★★★★ 5 / 5
In a highly challenging falling market, Sell signals accurately captured the trend, including a large wave of +1008pips. With a win rate of 57.1% and PF of 1.99, the correlation filter’s effective avoidance judgments further demonstrate the tool’s high level of completeness. Zero complaints; top rating.
Verification numerical evidence
Are you hesitating on GOLD entries?
“It’s rising, but I don’t know if I should enter now.”
“I don’t know where to enter.”
“Price moves too much; entering feels risky.”
In markets with wide price ranges like GOLD, broad intuition alone isn’t enough; you shouldexamine win rate, PF, Exp(R), strength, and correlation, and use them as criteria for entering or waiting.
Capture sharp trend reversals accurately and filter out unnecessary entries. Use a grounded, evidence-based trading approach to turn GOLD’s rough seas into solid profits. Get GOLD STREAM v2 now and elevate your trading to the next level.
View GOLD STREAM v2 product page Ask a questionRelated Articles
If you want to know more about trading concepts and GOLD trading, click here.
- 【Video】“GOLD STREAM Signals Following Price Movements | TRADE REVIEW (2026.8.10–9.04)”
- The One Reason You’re Not Seeing Results
- Why Trades End with “Dull and Sudden”
- 【Tool’s True Performance Exposed】GOLD STREAM Dedicated Win/Loss Analysis Tool Verification
- Conclusion: You can Trade GOLD (XAU/USD) in a domestic FX account.
The verification results and figures published here are reference information based on historical market data and do not guarantee future profits or similar performance.
The pips and P/L data shown are based on the maximum range (MAX) reached after entry signals, calculated using a fixed stop-loss (SL) setup. They represent the MAX range of price movement if entries were fully held after signals, and do not indicate actual realized profits or trade outcomes.
Actual profit or loss depends on entry/exit timing, spreads, slippage, trading fees, execution environment, position size, take-profit/stop loss decisions, and market conditions. SL judgments are based on the 4-hour chart; results may vary under different trading conditions.
Additionally, due to differences in trading conditions and price delivery, the actual price, pips, P/L, and fill results may vary depending on broker, brokerage, and trading platform. Therefore, there may be discrepancies between published data and actual trading performance.
This data is a reference material for evaluating the signal advantage and market analysis accuracy of GOLD STREAM v2. Final investment/trading decisions should be made based on your own financial situation, risk tolerance, and trading environment, at your own responsibility.