

2026/9/26 Dollar-Yen, Gold, SP500, and Nikkei 225 environment

For verification purposes, we provide a weekly video showing the movement of USD/JPY.
Note: The score signals and score lines in the video only appear on the future side. (They do not appear on the lower chart image)
USD/JPY
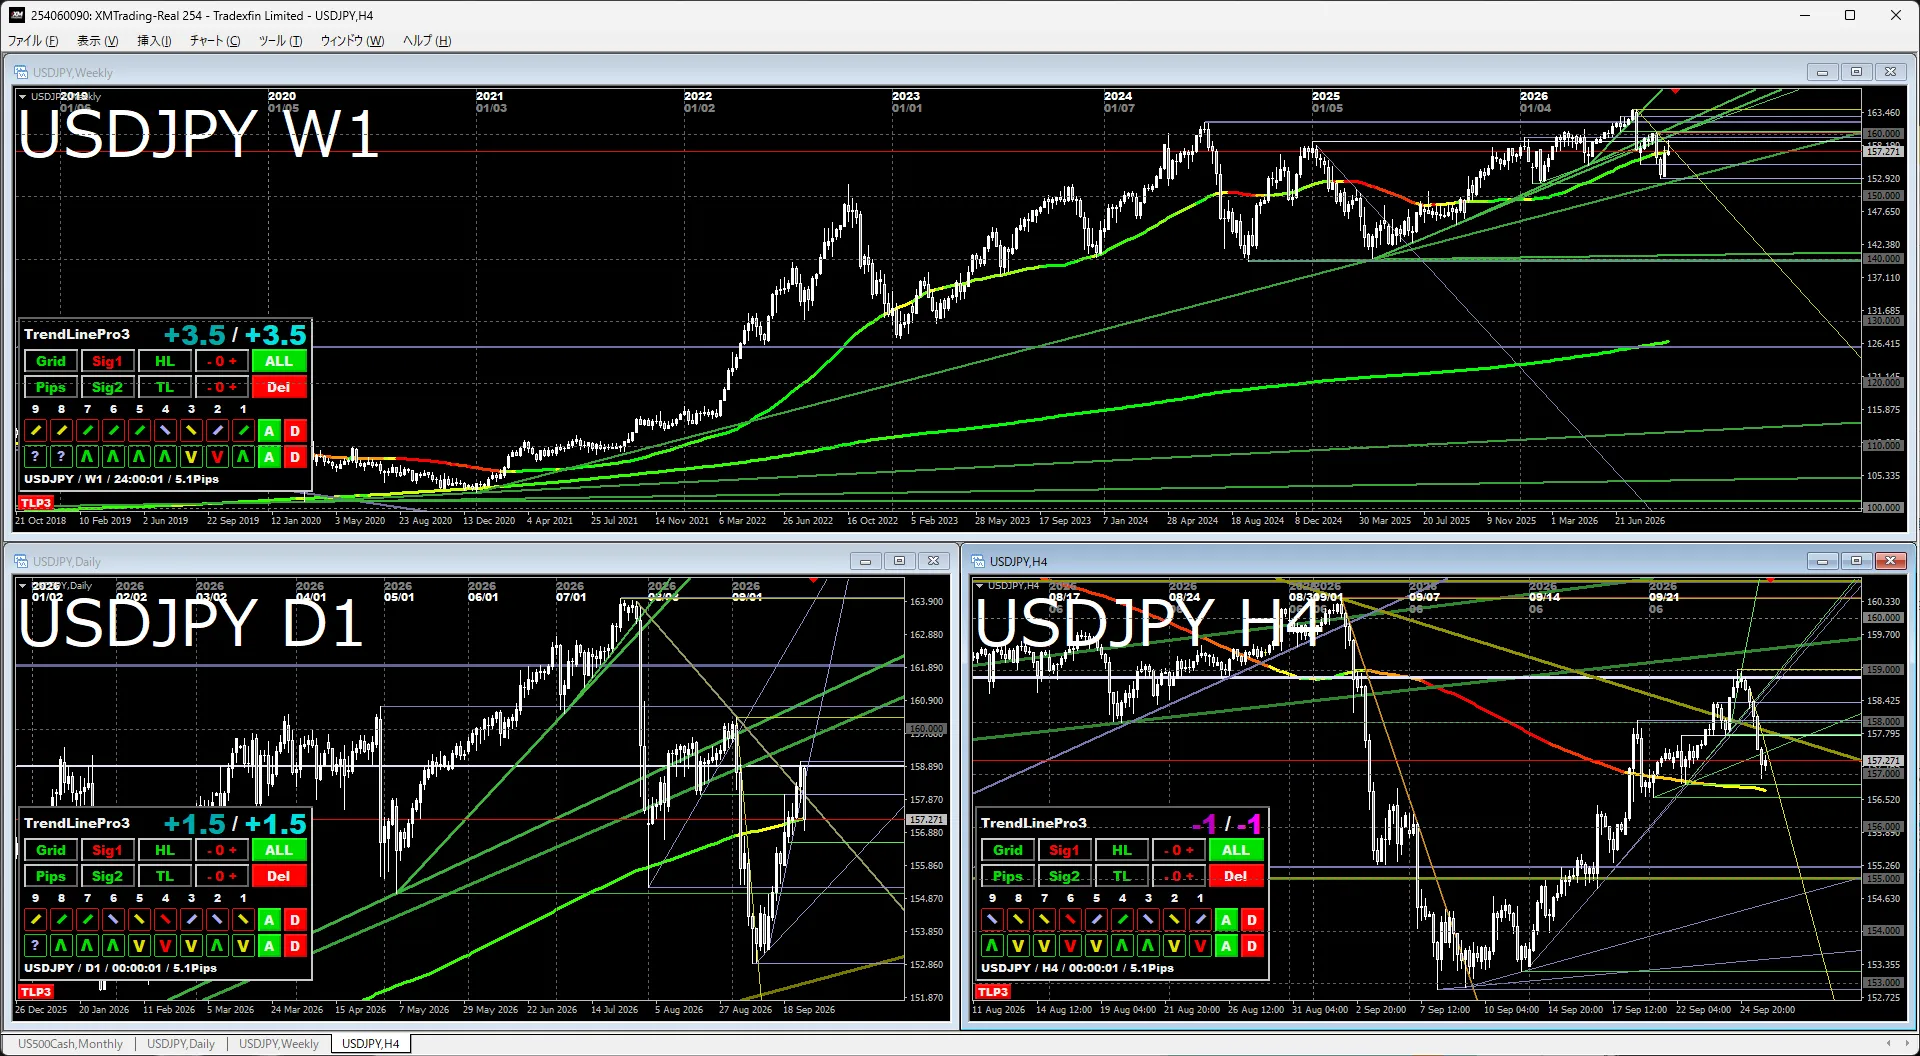
WeeklyThe long-term trend has not broken, but the upward trend from April 2025 has ended, and the rise has cooled. In the near term, the area around 152 yen, where the next support level (green horizontal line) and the trendline (green diagonal line) converge, is likely to be strongly watched. If it rebounds here, the price may move sideways; if it breaks through, the next target could be around 140.
Daily & 4-hourIf it neither falls nor rises sharply, and if next week it clears 160, the rise could strengthen, but in the near term it may remain steady and range-bound.
Gold
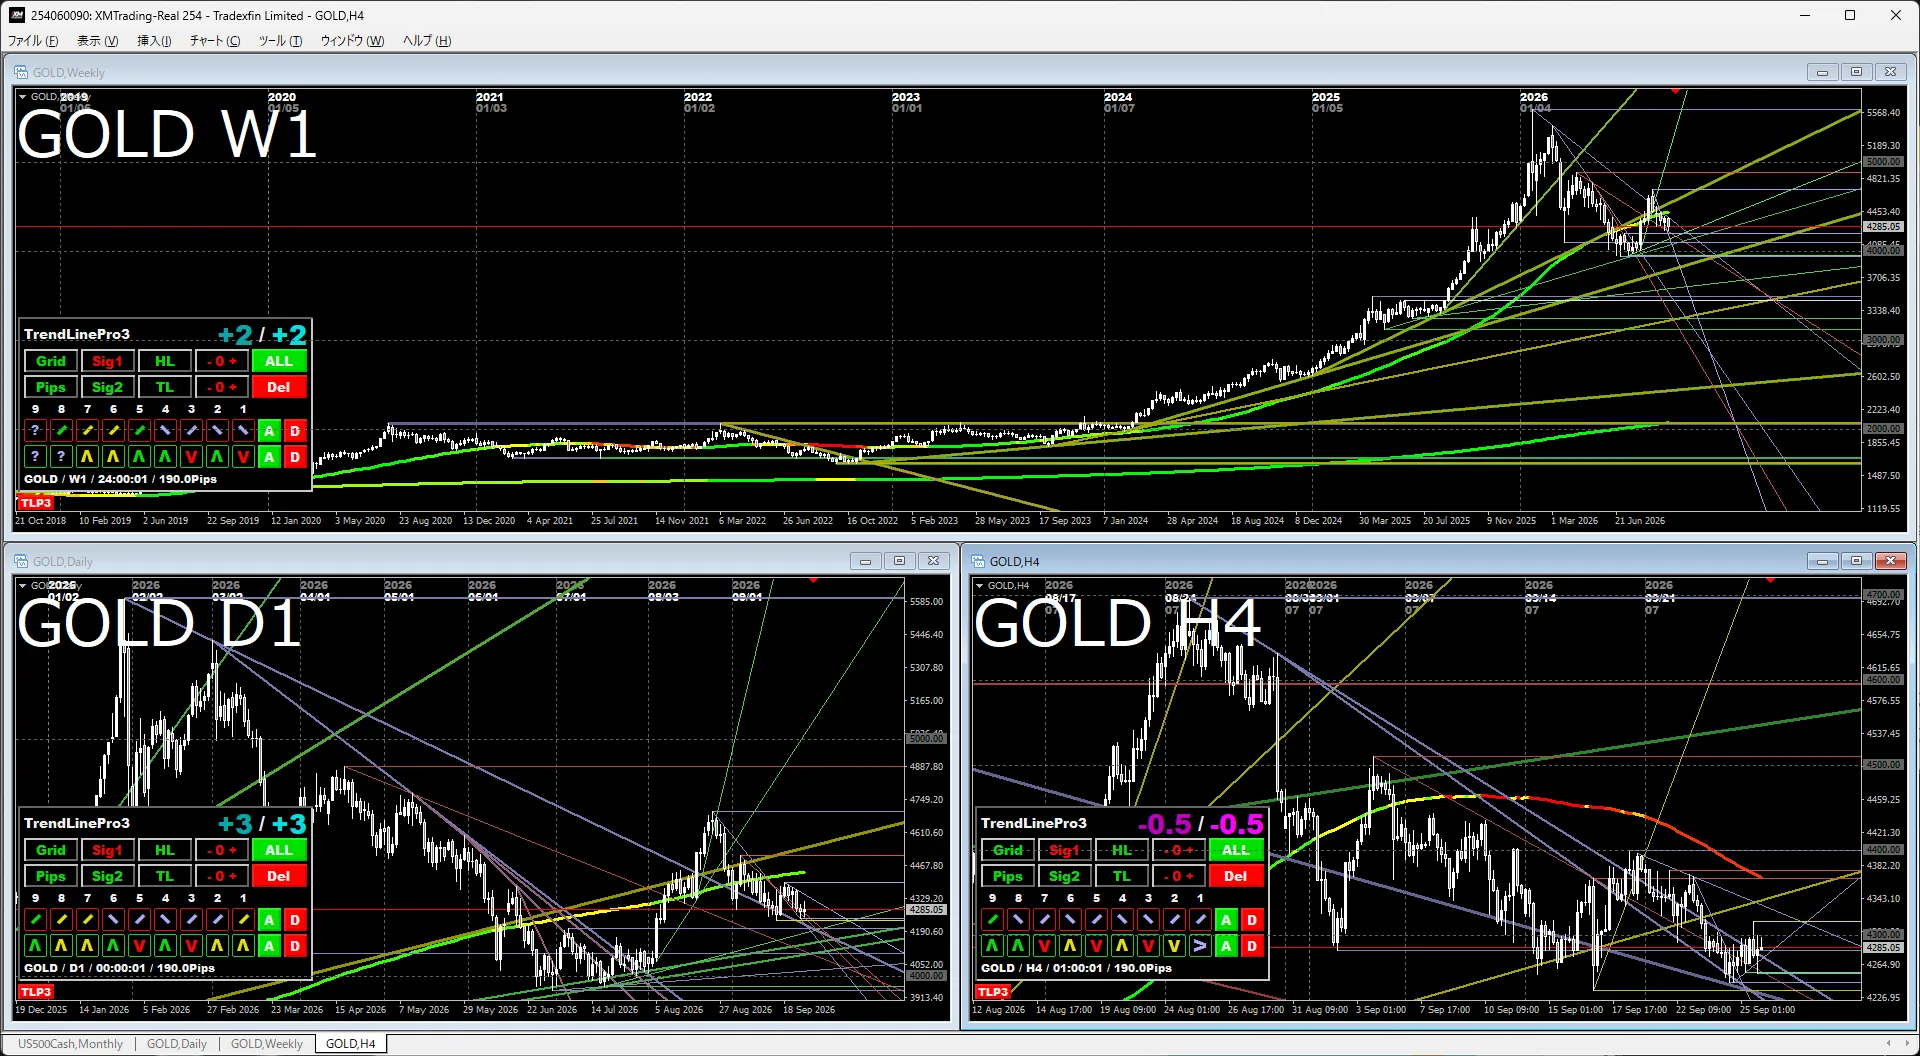
Daily & 4-hourThe sideways movement continues, but if it breaks above 4,400, upward movement becomes more likely. Personally, I expect continued choppy price action.
S&P 500
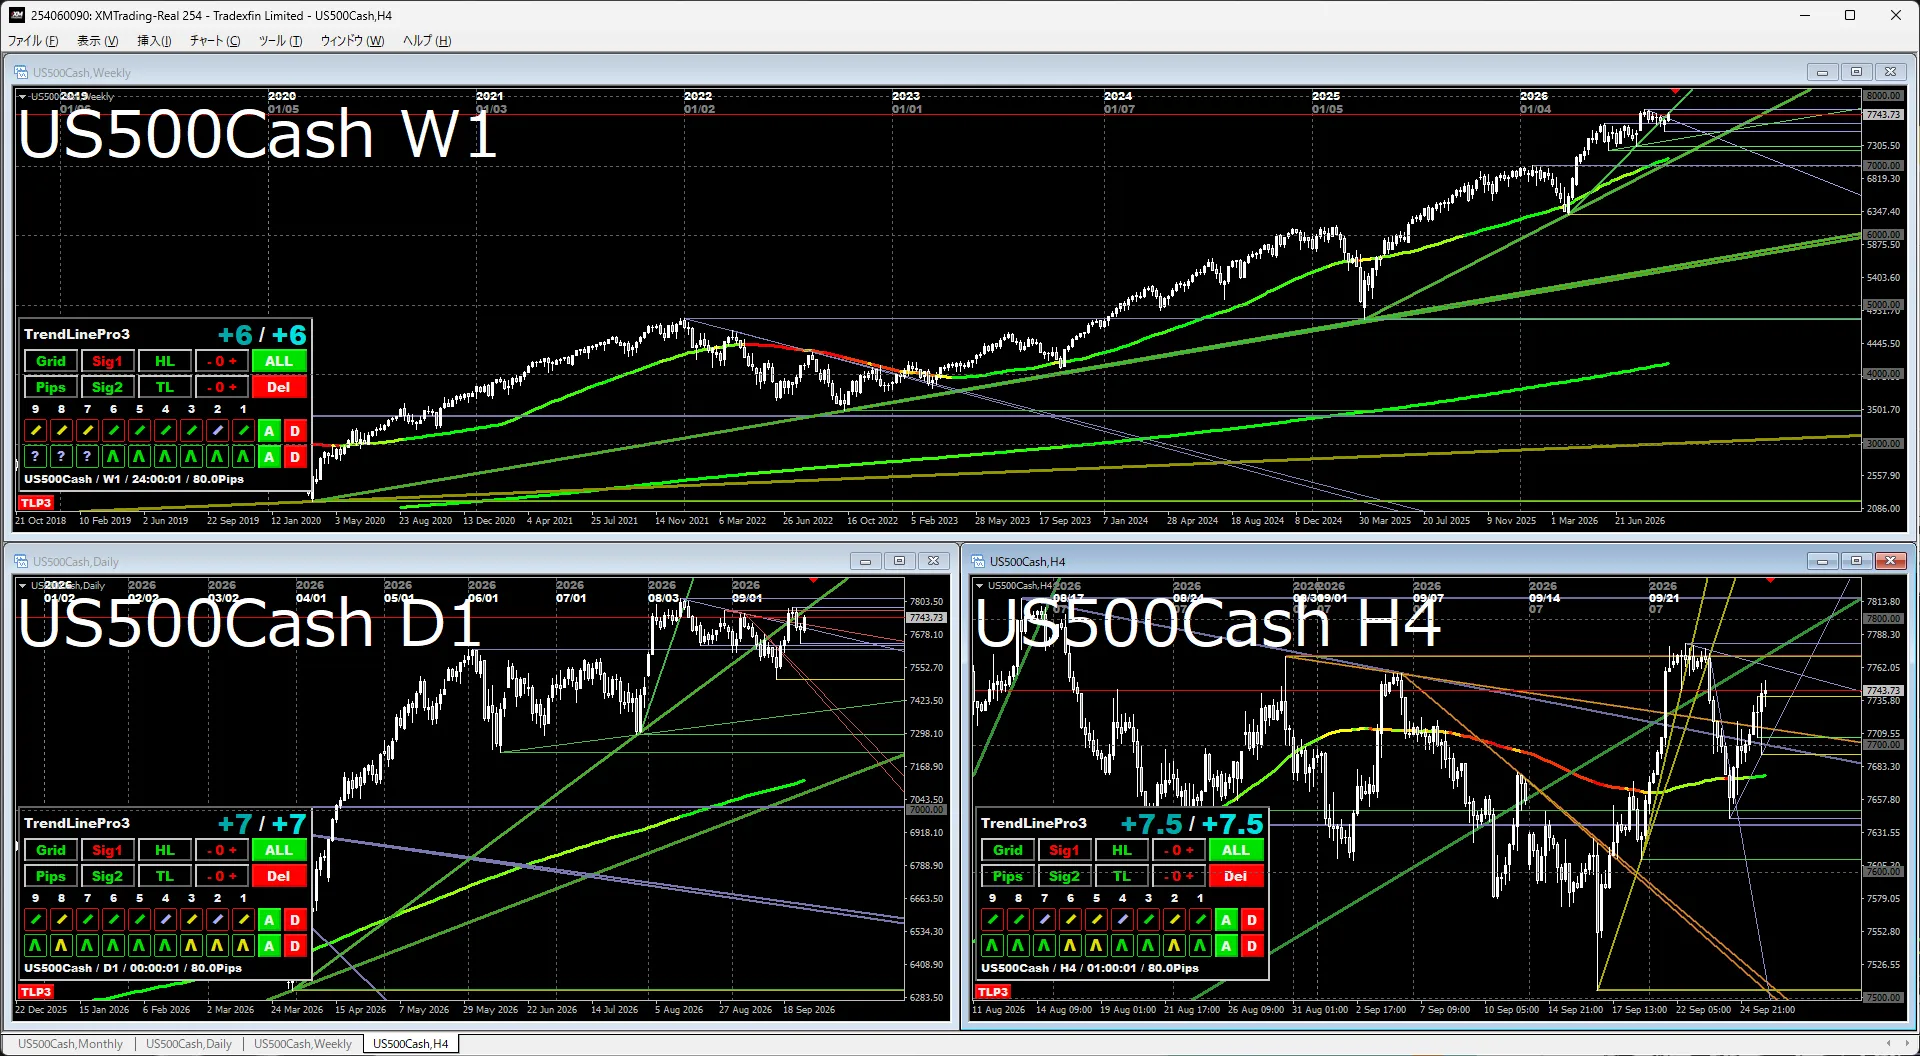
Daily & 4-hourThe near-term resistance level has been broken for now, and the 4-hour MA is turning upward, making upside movement timing more likely. In the near term, a new high is likely in sight.
Nikkei 225
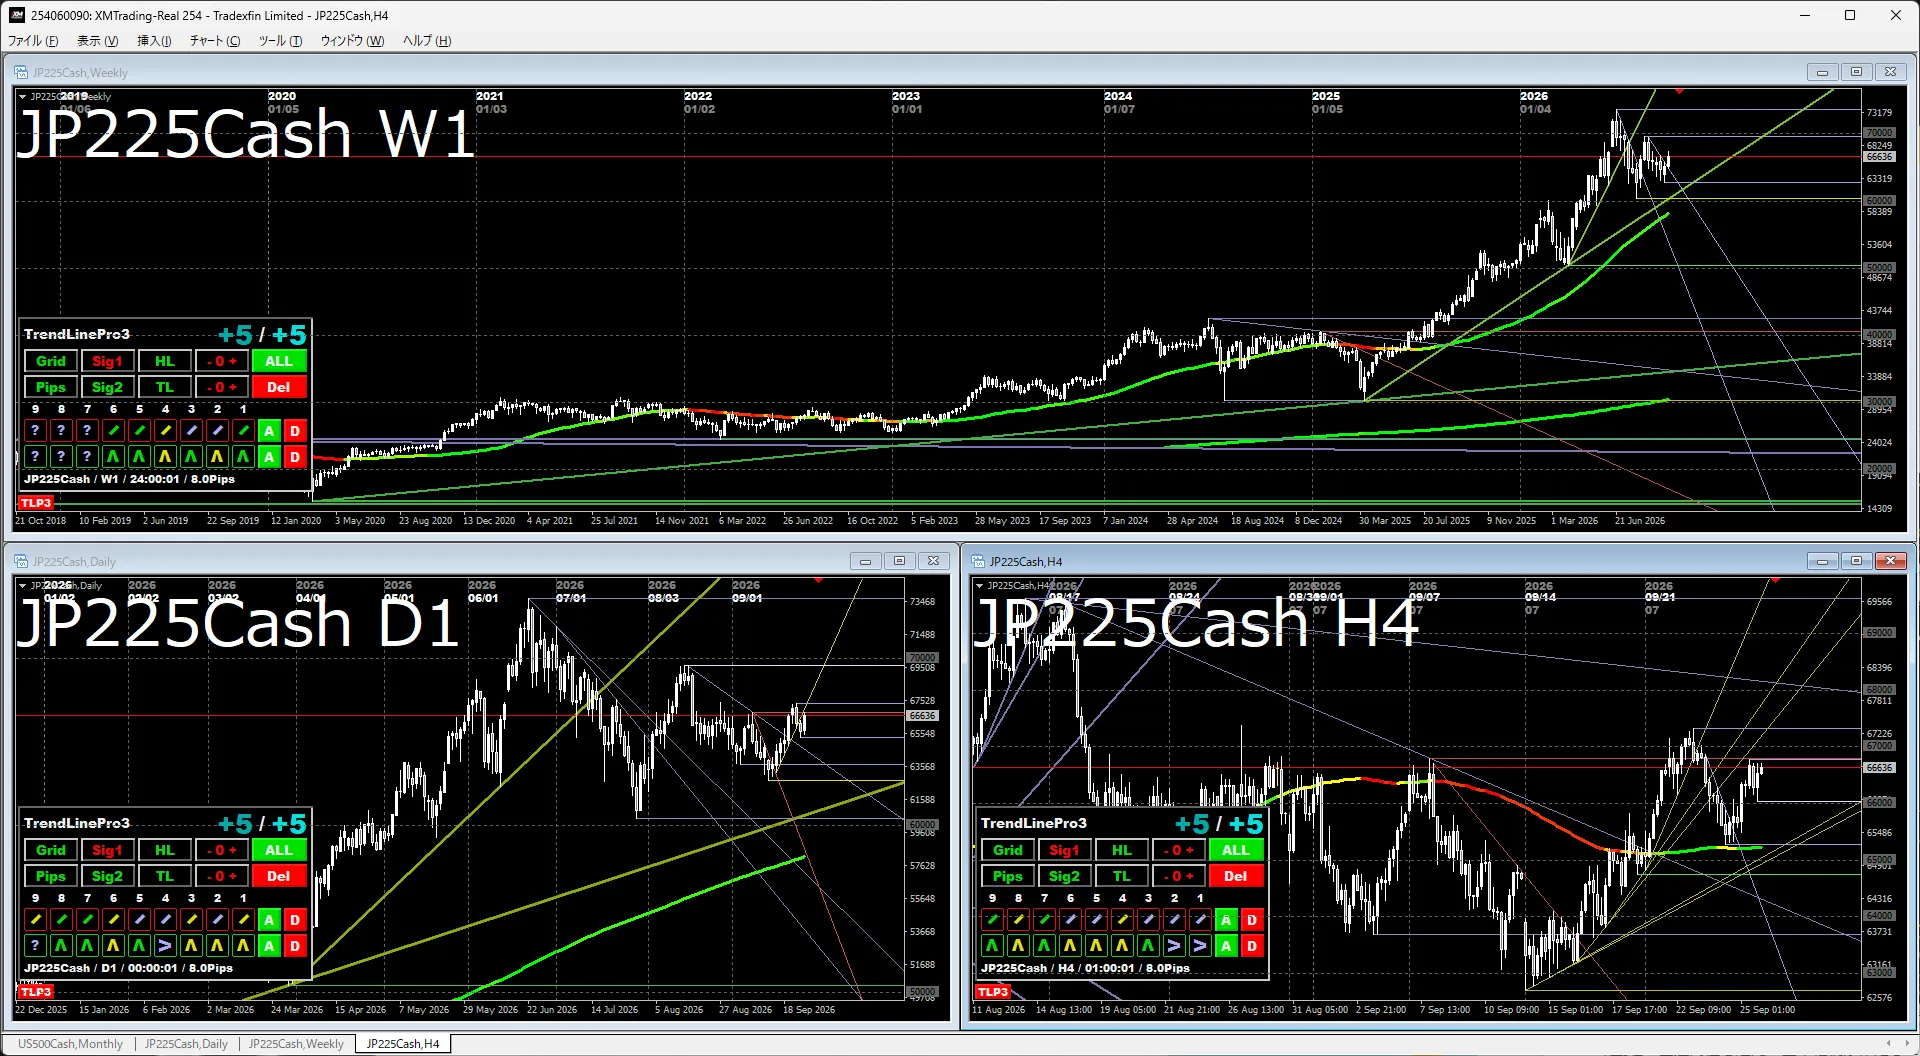
Daily & 4-hourThis forms an inverted triangle ascent, so visually it does not feel strongly upward, but the 4-hour MA is flat, and technically the path could test higher levels. However, the mood may change above 70,000.
The indicators in the attached image use the following indicators.
If you are interested, please take a look.