
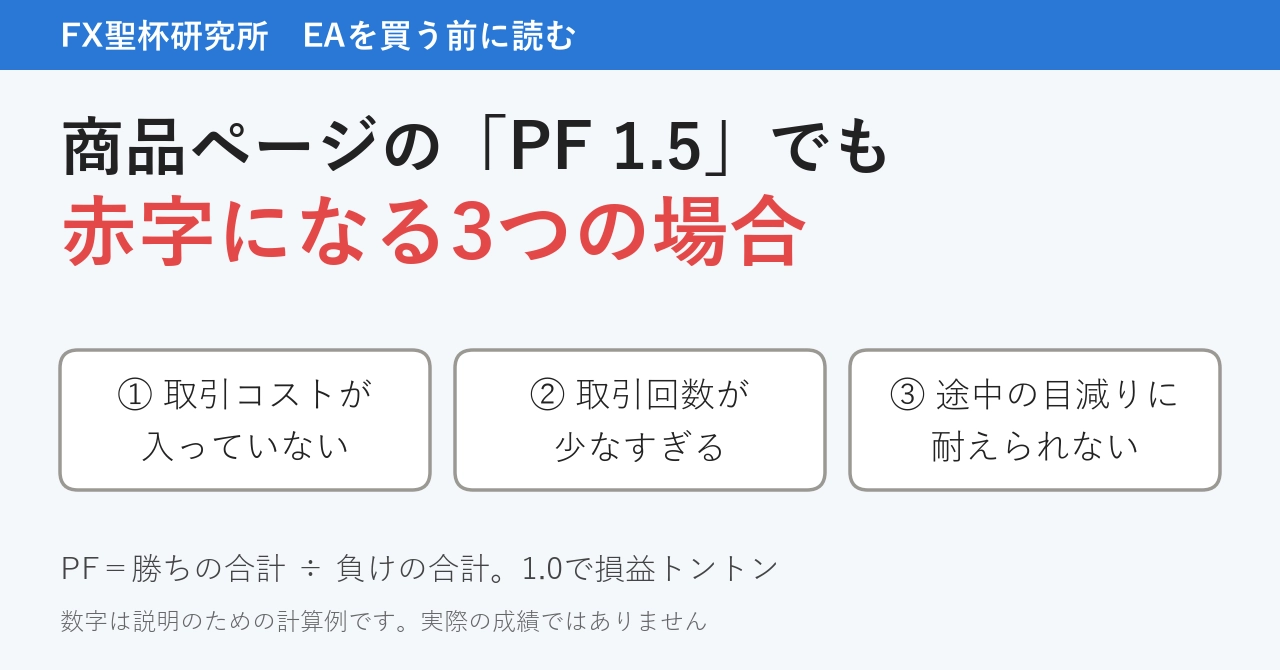
What is PF? Three cases where EA's product page "PF 1.5" also shows red text
I am the director of FX Holy Grail Research Institute. I am a 50-year-old systems engineer, keeping a log of testing automated trading methods that look like they could win, and breaking them down using past data.
When you search for EA (a program that automatically executes FX trades) and go to product pages, there is always a number that catches your eye. PF. Today, this is a discussion on how to read this number before buying.
All numbers appearing in this article are calculation examples for explanation.They are not my personal verification results or performance.
Conclusion
PF (the ratio of total profits to total losses; 1.0 means break-even) may be 1.5, butthat does not guarantee you will be profitable on your own account.
There are three typical ways to incur losses.
- Trading costs are not included
- Number of trades is too small
- The owner cannot withstand the drawdown of assets along the way
The most common oversight is the first one.If a method has small profits per trade, merely adding costs can push PF from 1.5 to below 1.0.
What PF is
PF is calculated by the following formula.
Sum of profits from winning trades ÷ Sum of losses from losing trades
For example, if the total profit is 150,000 yen and the total loss is 100,000 yen, then 150 ÷ 100 = 1.5.
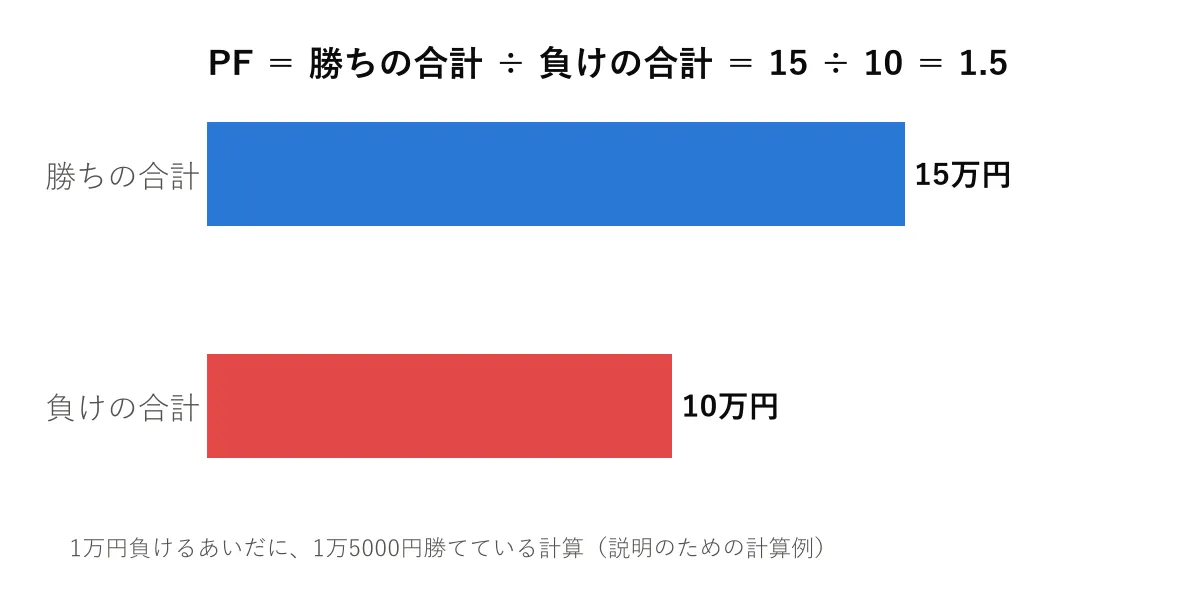
In other words,you are winning 15,000 yen for every 10,000 yen you lose. A PF of 1.0 is break-even, and PF below 1.0 is a loss.
One thing to note: PF is a ratio, soyou cannot tell how much you earned or how much you reduced at some point along the way.This limitation connects to the discussion that follows.
Case 1 for loss: Trading costs are not included
In FX, you incur costs with every trade. The main one is the spread, the difference between bid and ask prices. Some brokers also charge fees. In this article, I refer to all of these as “trading costs.”
Here is a calculation example. A method that makes 100 trades of USD/JPY, with 50 winning and 50 losing trades. The price range is written in sen. One sen equals 0.01 yen.
The trade size is considered as 10,000 units. If you trade 10,000 dollars worth, a 1 sen move results in a 100 yen profit or loss.
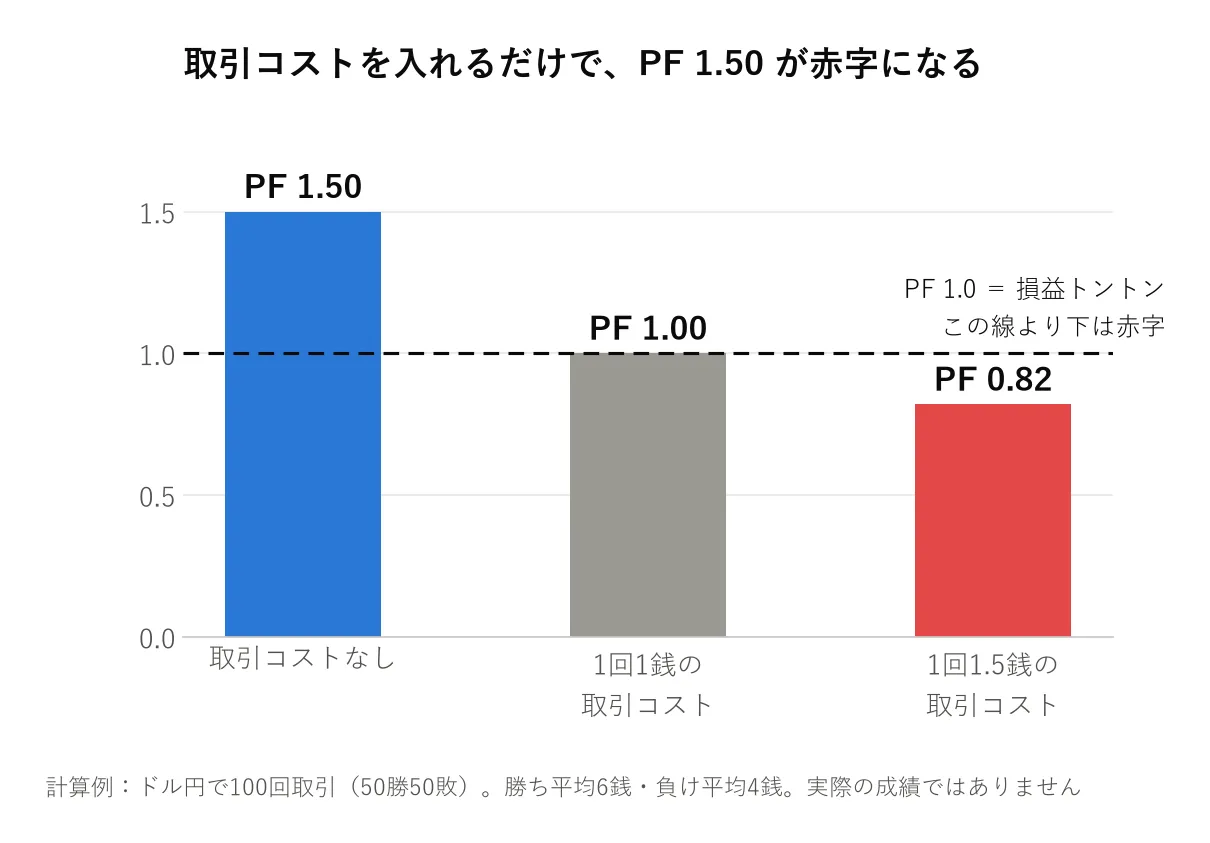
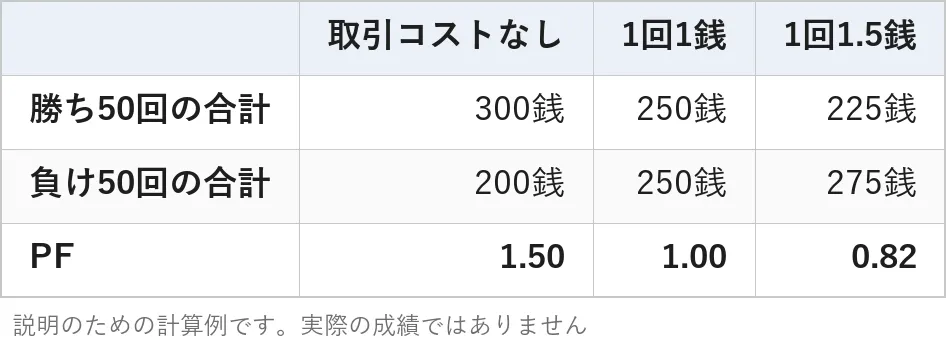
Condition: 100 trades, average profit per winning trade is 6 sen, average loss per losing trade is 4 sen. Costs are subtracted from the wins and added to the losses.
Before including trading costs, PF is 1.50. If you include 1 sen per trade as cost, it becomes 1.00 (break-even); with 1.5 sen, PF drops to 0.82loss.
The smaller the profit per trade, the more costs break the PF.For a method aiming at 6 sen per trade, a cost of 1 sen is one-sixth of the profit.
Actual costs vary by broker and time of day. Even if the cost is only 0.3 sen, if you target 2 sen per trade, the cost is about one-seventh of the profit. With the same calculation, PF drops from 1.50 to about 1.04, almost breaking even. The critical point is not the size of the cost, butthe ratio of cost to profit per trade.
On the product page, is PF shown after deducting trading costs? If costs are deducted, what sen is used to calculate the spread? PF that does not mention these details should not be trusted at face value.
Case 2 for loss: Too few trades
The following calculation example uses a strategy that has only 10 trades.
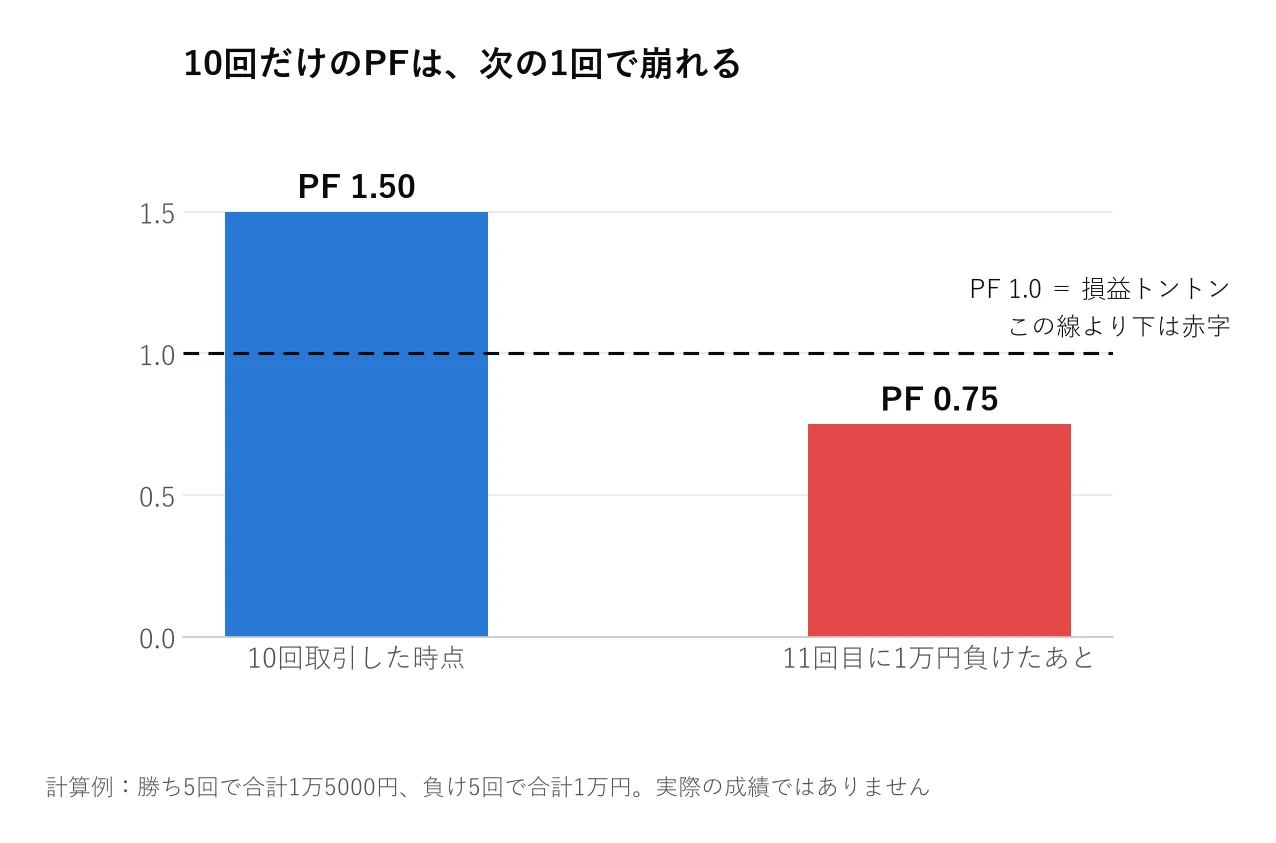
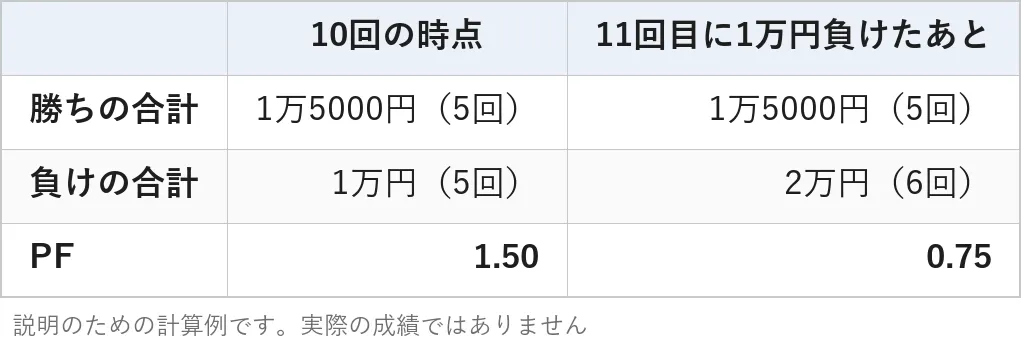
At 10 trades, PF is 1.50. If you lose 10,000 yen on the next trade, it drops to 0.75.
PFs with too few trades are highly influenced by chance results.Even with PF 1.5, PF of 1.5 after 10 trades versus PF of 1.5 after hundreds of trades are not equally reliable.
On product pages, near PF, look forthe number of trades and the validation period. If not stated, I think you should not rely on it for judgment.
Case 3 for loss: Inability to endure drawdown in between
Finally, there are cases where the numbers show a profit, but the actual account ends in loss.
Here we look at the maximum drawdown (the largest peak-to-trough fall in assets).
Calculation example: In five years of testing, suppose a method ends up with PF 1.5 and profit, but immediately after starting, the assets begin to decrease, and in the second yearthe asset decreases from 1,000,000 yen to 600,000 yen. The maximum drawdown is 40%.
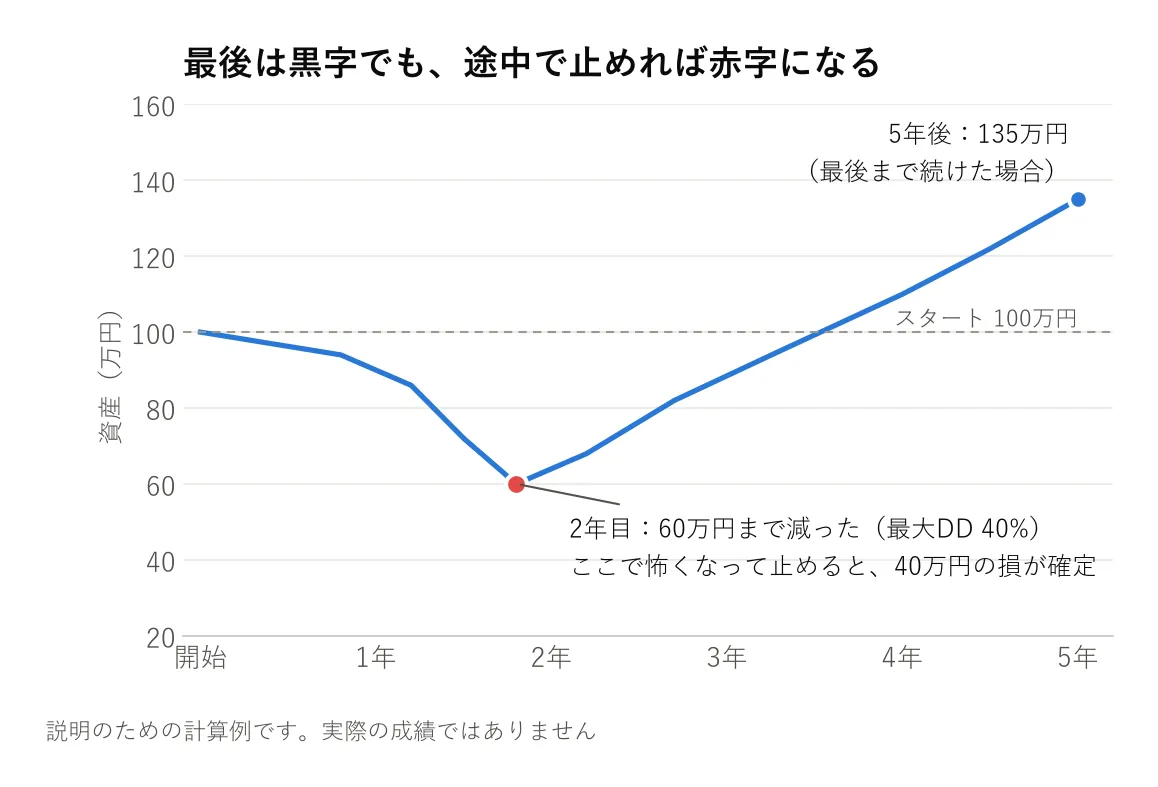
If you held on to the end, you would be in the black. But when your real money drops by 400,000 yen, many people become frightened and stop.The loss is realized at the point you stop.
PF is a ratio of the final totals, so the interim suffering is not visible. If you increase the number of trades, the decline will be even larger.
Three things to check on the product page
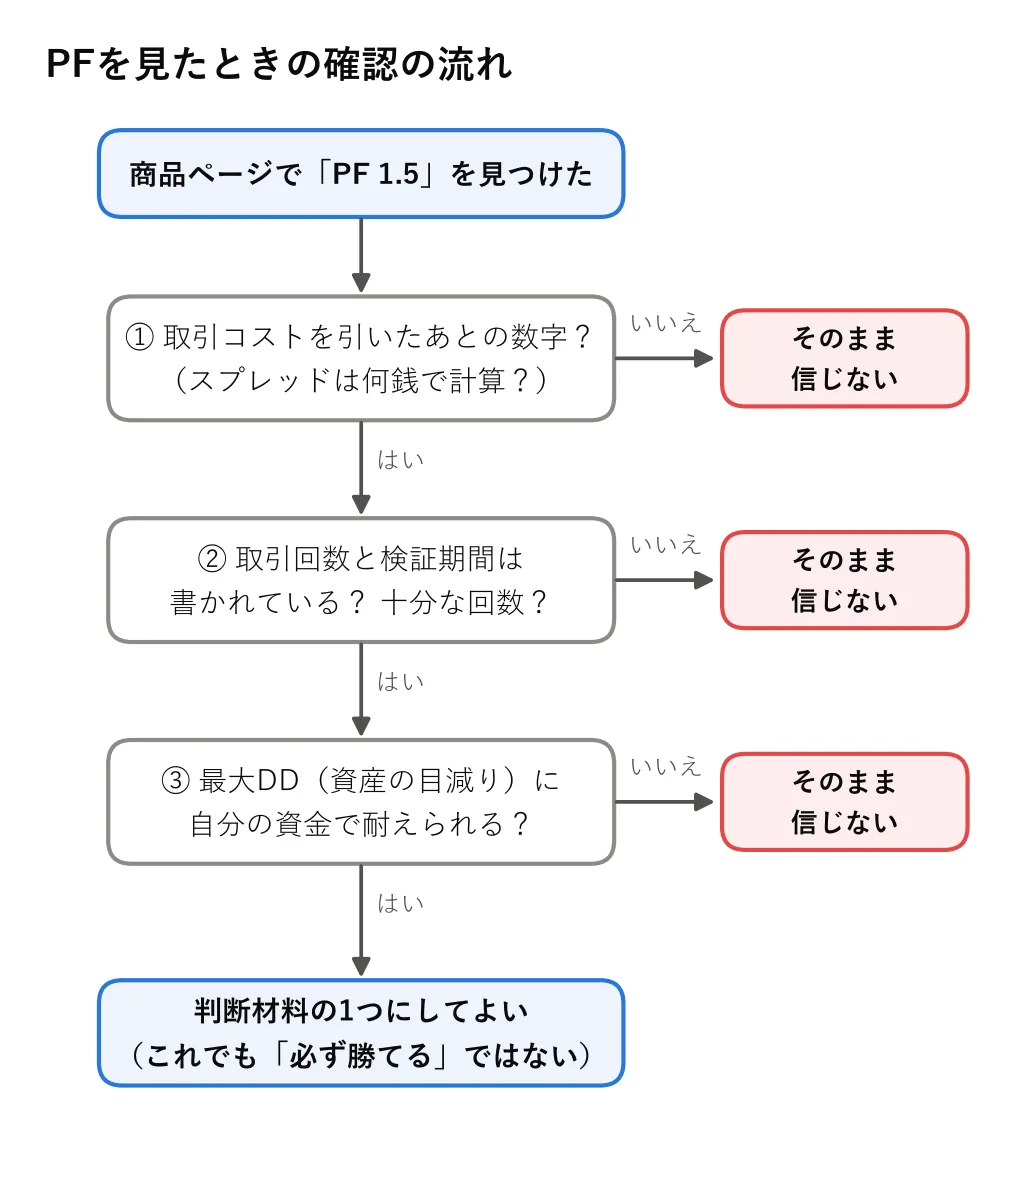
In summary, when you see PF on an EA product page, please check the following three things.
- Whether PF is shown after deducting trading costs.What sen was used to calculate the spread
- Number of trades and validation period.PF with a small number of trades may be a coincidence
- The size of maximum drawdown (asset drawdown).Whether your own funds can withstand that drawdown
There is one more, even bigger reason. If you overfit parameters to past data, the PF on past data may appear high, but it will not perform the same in future markets. This is called overfitting to the past, and PF numbers alone cannot reveal it.
A high PF is not inherently bad. However,relying on PF alone is dangerous.
Conclusion
FX Holy Grail Research Institute, when we see a good number, first looks for “under what conditions can it collapse.” The three points in this article are the entry points for that. I created the calculation examples and diagrams with AI help, and I recalculated all the numbers to verify them.
I do not promise a method that guarantees victory. But I believe there is a Holy Grail out there, and I am seeking it.
The Holy Grail I am looking for is a trading rule that does not collapse even when trading costs are included or in periods we have not yet observed. The three checks today are the first tools to discern fake Holy Grails.
Next, when you look at PF on an EA product page, please verify these three items. Every time you remove one fake, you come one step closer to the Holy Grail.
Glossary
- EA: A program that automatically executes FX trades
- PF: Sum of profits from winning trades ÷ Sum of losses from losing trades. Below 1.0 is loss
- Spread: The difference between bid and ask price. A cost paid with each trade
- Sen: 0.01 yen. For a 10,000-unit trade, a move of 1 sen moves 100 yen
- 10,000 units: The unit of trade size. For USD/JPY, 10,000 dollars worth
- Maximum drawdown (max DD): The asset drawdown at the most negative point
※This article is not financial advice. All numbers are calculation examples for explanation.