
Stopped opening 30 currency pairs one by one — a method to search for overlapping SMC-related pairs with a single yen
I am lab.aiueo, developing MT4/MT5 indicators.
When looking at multiple currency pairs with SMC (Smart Money Concept), there are moments when confirmations can’t keep up.
In this article, I will describe the原因, the idea of reversing the order of confirmations, and how it is embodied inSMC-Compass for MT5and how to read it.
By the time you open the 10th sheet, the 1st sheet is moving
Open charts in order from the top of the watchlist. EURUSD, GBPUSD, USDJPY…
For each, check where the Order Block is, whether the Fair Value Gap (FVG) is filled, and the direction of higher timeframes.
Around the 10th sheet, when you suddenly return to the 1st sheet,the pairs you judged as “still early” just moved.
It’s not that you missed it.While confirming, the situation changedinstead.
Why doesn’t “one-by-one” keep up
Because there are too many confirmations.
Even if you limit SMC to five bases (Order Block, FVG, Premium/Discount, Liquidity Sweep, direction of higher timeframes), you still have to view both buy and sell sides, resulting in 10 confirmations per pair.
Doing this manually every time isn’t realistic. In the end you end up looking only at the pairs you always monitor, and you miss other conditions that align elsewhere.
Reverse the confirmation order
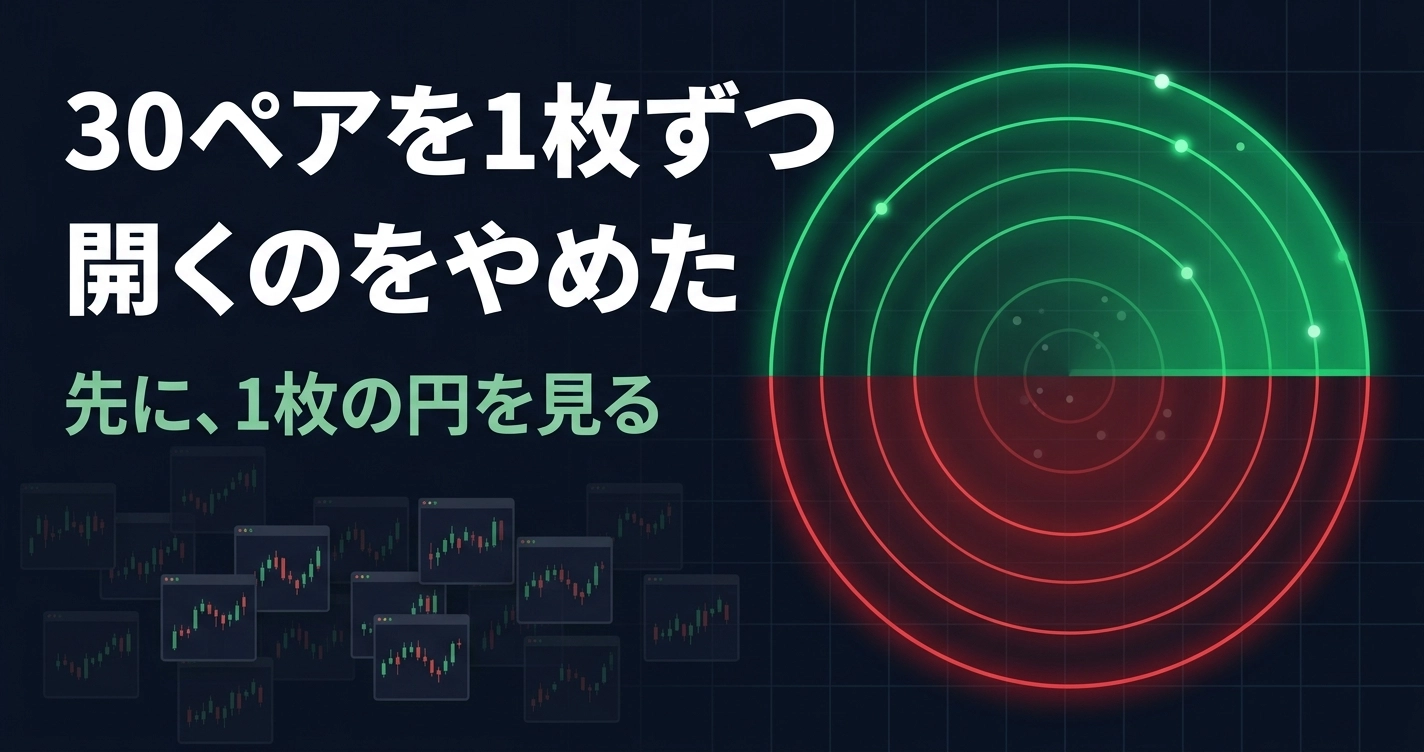
Instead of judging after opening each sheet one by one,evaluate all pairs with the same yardstick first, and place the results on one map. Humans should first look at the map and open only the standout parts.
What matters here isto narrow down the information placed on the map. I narrowed to two things.
- Direction… Are there more buy reasons or more sell reasons
- Strength… How many reasons overlap (0–5)
If you flatten this into a circle, you getUp = Buy,Down = Sell, the farther from the center, the strongerThis means 30 pairs fit into one circle, and you only need to look at those on the outside.
What to count
For the most recent confirmed bar, examine the following five items. Each satisfied item counts as one point. Count buy and sell separately, andthe higher total determines direction, and the count is strength. If buy is 3 points and sell is 1 point, that’s “Buy & Strength 3.”
| Element | Conditions for a Buy point | Conditions for a Sell point |
|---|---|---|
| Order Block | Touches a valid bullish OB | Touches a valid bearish OB |
| Fair Value Gap | Touches an unfilled bullish FVG | Touches an unfilled bearish FVG |
| Premium / Discount | Close below 50% of the range (undervalued) | Close above 50% of the range (overvalued) |
| Liquidity Sweep | Recently dipped below a low and came back | Recently dipped above a high and came back |
| Higher timeframe | Higher timeframe trend is up | Higher timeframe trend is down |
Structural breaks (BOS / CHoCH) aren’t counted as points; they are used as the foundation when finding Order Blocks and when deciding the overload/underload ranges.But it’s important to count only on the confirmed bar. Things can change when you identify an OB or set the over/under-valued range, since these are defined from a break.
Count on the confirmed baris also important. If you count on a developing bar, points may appear or disappear in the middle of the bar, causing the map to flicker. If you count only the confirmed bar, there’s no later rewriting of the display.
The map is for deciding “where to look,” not for deciding “when to enter.”
Even with tools I created,I don’t display entry arrows or take-profit/stop-loss lines.Win-rate and backtest results are not displayed or promoted.Open the map for the standout pairs, and make your own judgments from there.
SMC-Compass for MT5
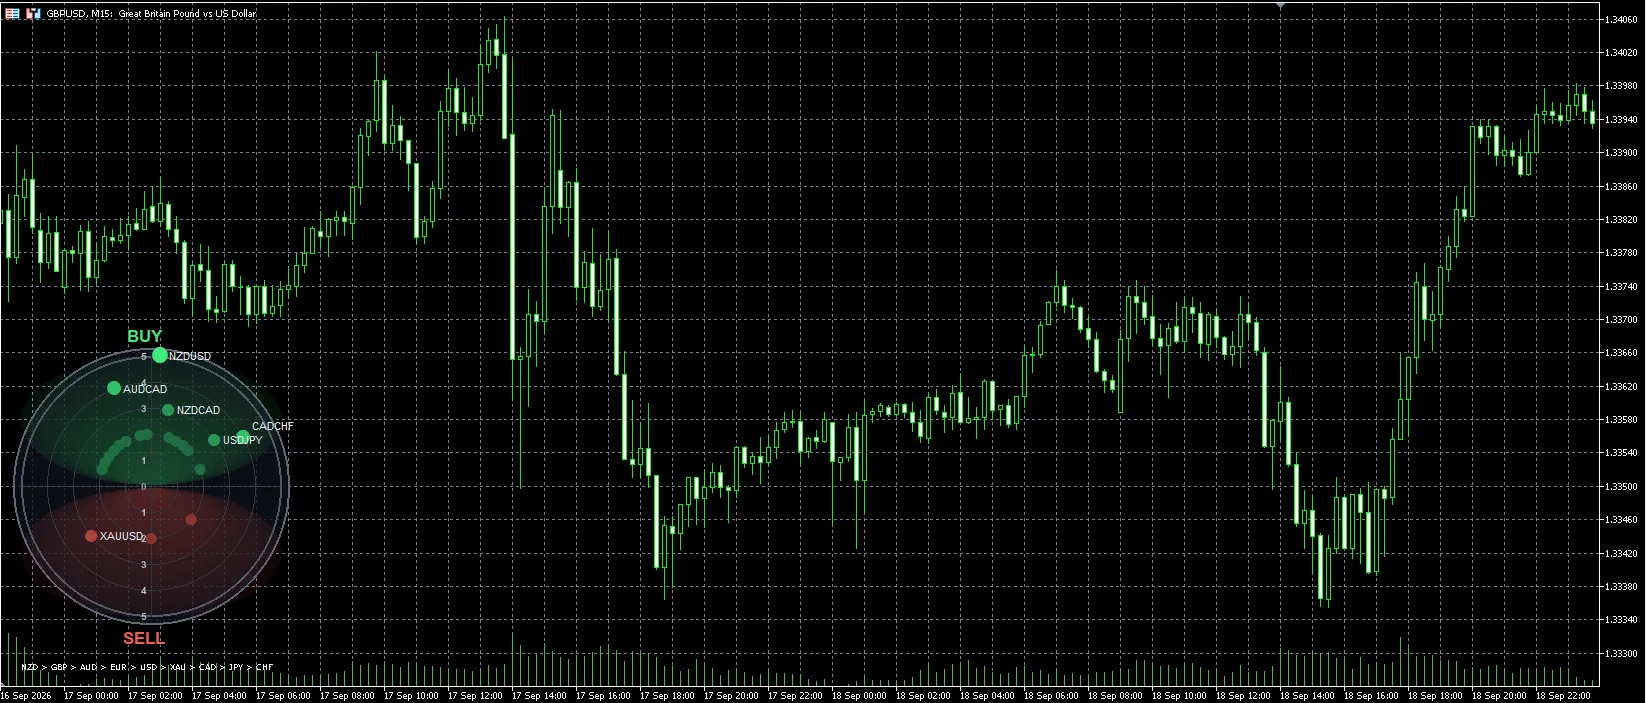
This is the MT5 indicator version of this concept. It displays the SMC status of 30 currency pairs on one circular radar chart on the chart. The scoring basis is the same as the current score shown on the SMC-Signal panel of the same series.
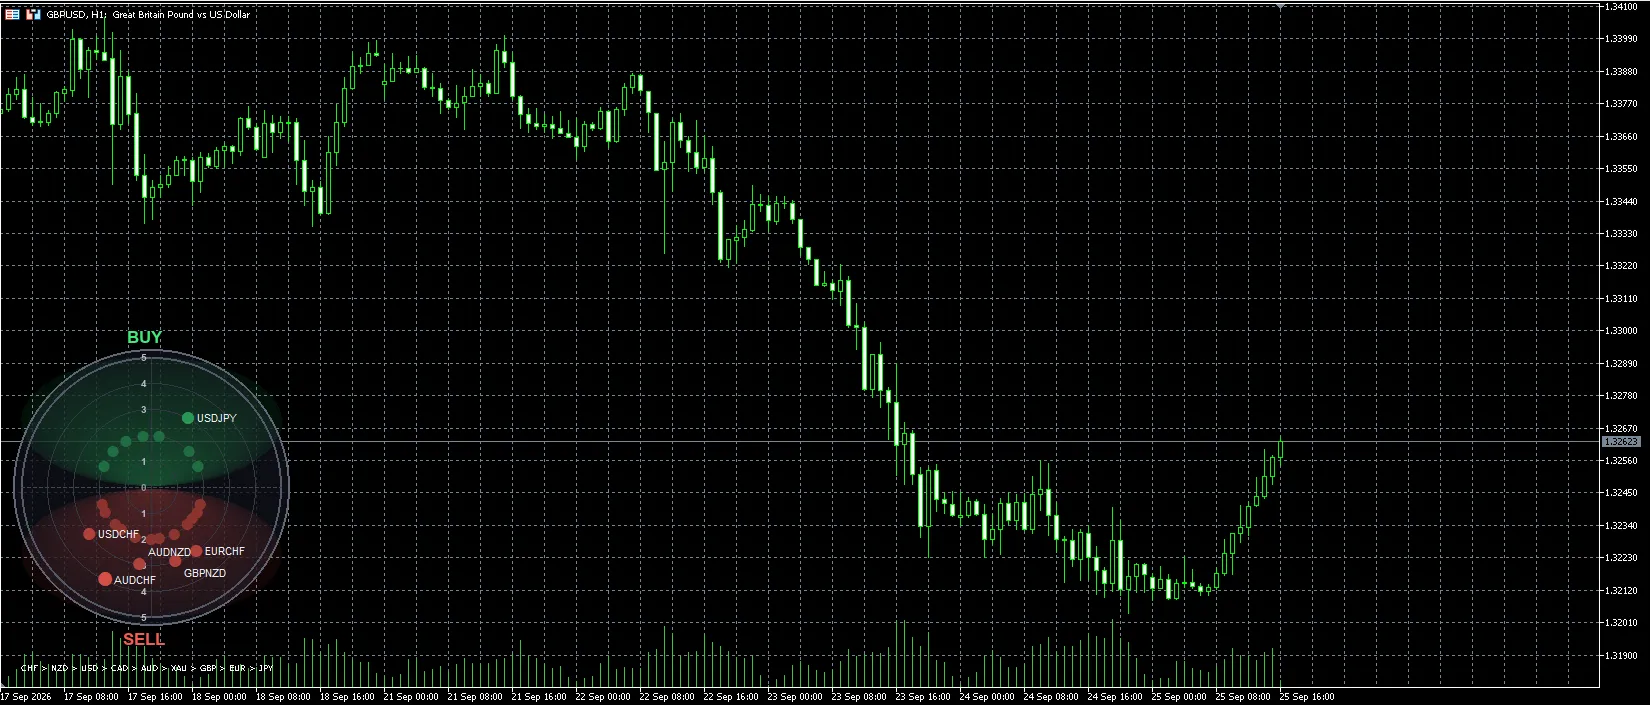
How to read the radar
| Display | Meaning |
|---|---|
| Upper half circle (BUY) | Pairs with more buy reasons |
| Lower half circle (SELL) | Pairs with more sell reasons |
| Distance from center | Strength (0–5). The farther from center, the more overlap of reasons |
| Color and size of dots | From strength 2 to 5, dots become brighter and larger |
| Pair name | Only for strength 3 or higher pairs |
| Line below | Currency strength ranking. The left are stronger currencies |
By default, pairs with strength below 2 are not displayed.If nothing appears on the radar, it means “no pairs with overlapping reasons right now,”not a malfunction.
Three pitfalls that are easy to misread
Because it looks simple, there are points where intuition can miss. This is the part I want to emphasize most in this article.
1. Strength is not “height” but “distance from the center”
When same-direction pairs overlap at one point, it becomes unreadable, so dots are spread in a fan shape to the left and right. Dots that swing widely horizontally look lower when read on the vertical scale.
While revisiting the manual for the screenshots,I realized the faint dot near the “1” on the scale was actually strength 2.
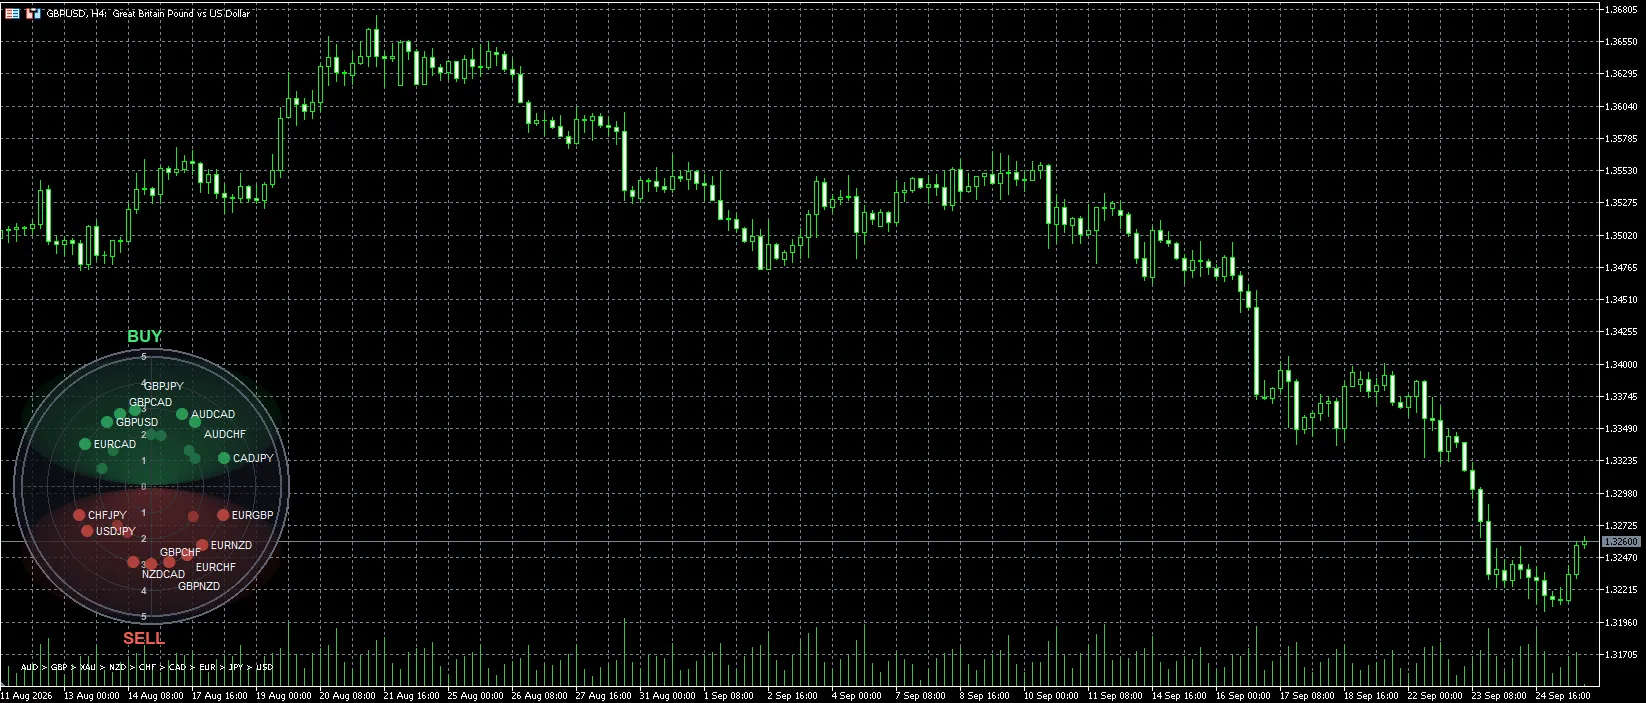
2. In a tie, the Buy side is shown
When buy and sell points are equal, display on the buy side (upper half circle).
Order Block and Liquidity Sweep can apply to both buy and sell at the same time, so 2–2 or 3–3 is common. Even for pairs on the upper half circle, you may open the chart and find as many sell reasons lined up as buy ones.Radar is where candidates are found; judgments are made after opening the chart.
3. Dots do not move until the bar closes
Scoring is done on the previous closed bar, so price movement within the bar does not change the score.
Also, calculating 30 pairs at once is heavy, so it calculates 8 pairs at a time every 5 seconds. It takes about 20 seconds for the whole set to refresh after a new bar forms. The reason you might still see old displayed pairs is due to this queuing.
When found, click to open
Clicking the dots or pair name on the radar opens that pair’s chart at the same timeframenewly
. This is a feature to switch from “open one by one” to “open only the standout parts.” If you paste SMC-Radar on the opened chart, you can see the zones’ positions, and paste SMC-Signal to see the breakdown of the reasons.
How to build currency strength ranking
Under the radar, currencies line up likeAUD > USD > NZD > … > GBPThe left are the stronger currencies.
It is built from the 30-pair scoring results. If EURUSD is “Buy & Strength 3,” then EUR gets +3 and USD -3. Sum across all pairs and divide by the number of involved pairs to rank. If the radar shows a buying pair also as “strong currency × weak currency” in the ranking, that aligns with the overall currency flow.
Alerts
You’ll be notified when a strong pair appears newly or when a direction reverses between Buy and Sell. Popups, push notifications to smartphone, and sounds can be turned on/off individually.
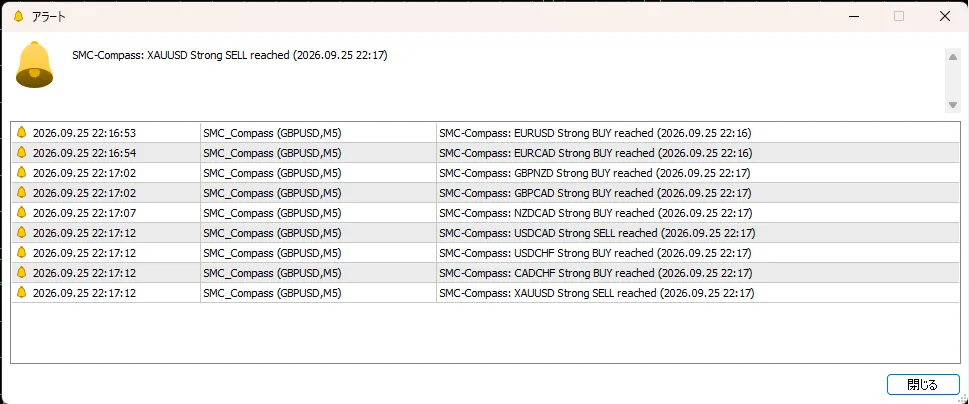
Whichever chart you paste it on, all 30 pairs are subject to notifications. The initial first pass doesn’t ring, and the same pair isn’t re-notified by default for four bars. Notifications are not buy/sell signals; they are notices that “conditions overlapped in a pair.”
Things to know when using MT5
- Immediately after pasting, dots gradually increase.MT5 pulls price data for other pairs as needed. From the second time on, they display quickly. The 30 target pairs are automatically added to the market watch.
- The display is not entirely identical to the MT4 version.Even with the same provider, MT4 and MT5 receive prices from different servers, so highs and lows may differ slightly, and the point count may change by one. This is by design, not a bug.
- Settings are shown in Japanese.Parameter screen items appear with Japanese explanations.
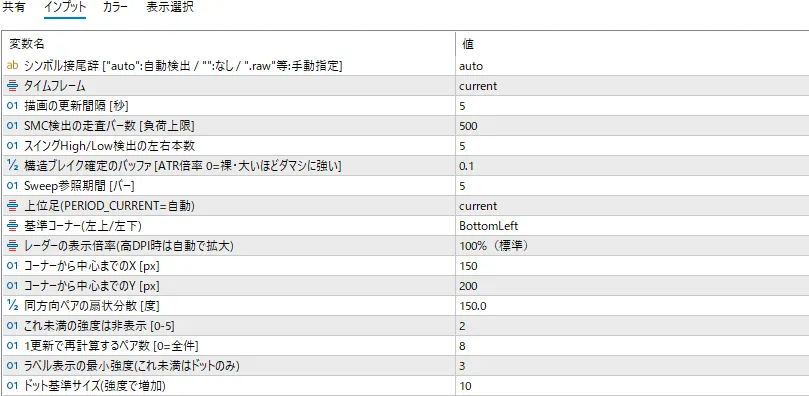
| What you want to do | What to adjust |
|---|---|
| Limit to strong pairs only | Raise “Hide strength below this” to 3 |
| Increase named pairs | Lower “Minimum strength for label display” |
| Change the pairs you monitor | Rewrite “Currency pairs 1–30” |
Workflow
- Find candidates with the radar… Paste on H1 charts and look at pairs near the outer edge and pairs with names
- Cross-check with currency strength ranking… Are you in the “strong currency × weak currency” zone
- Click to open the chart… Check with your own eyes which zones are touched and whether a contrary wall exists
- If nothing appears, pass… The advantage of viewing all pairs at once is instantly knowing when there are no overlapping conditions
System requirements
| Supported platform | MetaTrader 5 (Build 2485 or later) |
| Application | Main charts for currency pairs (any pair) |
| Target | Up to 30 pairs (default 28 major pairs + XAUJPY, XAUUSD; can be swapped) |
| Recommended timeframes | M15 / M30 / H1 / H4 |
| Use of DLL | None |
| External indicators | Not required |
The suffixes of instrument names by brokers (.raw, m, etc.) are read automatically from the instrument name on the pasted chart.
Why I made it
SMC-Compass was originally created for MT4. It arose from my own problem of “dragging to open 30 pairs one by one every morning.”
The MT5 version was made because domestic brokers are realistically phasing out MT4. During porting, I ran the MT4 and MT5 versions with the same diagnostic outputs to compare, and at the time of testing, the breakdown of scoring and final direction/strength aligned for all 30 pairs.
The simpler a tool looks, the more explanatory the “why” behind its display must be, or it can appear buggy. The user manual (PDF, 16 pages) contains all cautions on how toread this article.
For those who already own the MT4 version: the judgment logic and parameter configuration are the same, but please note you would be purchasing it as a separate product.
This product is an analytical support tool that displays overlaps of Smart Money Concept conditions across multiple currency pairs. It does not provide buy/sell signals, investment advice, or guarantees of performance.
The displayed content is mechanically calculated from past and current prices and does not predict future price movements. The developer is not responsible for any damages arising from trades made using this product. Please make investment decisions at your own risk.