

FUKAN Real Market Records|Post-Decline Trend of DE30 and Comparison with US30/US500 (September 24) Tracking the approach to price ranges in chronological order and comparing the three indices at the same time
Viewing DE30's Aftermath Across 3 Markets
FUKAN MARKET RECORD / September 24, 2026 / DE30, US30, US500 / M5
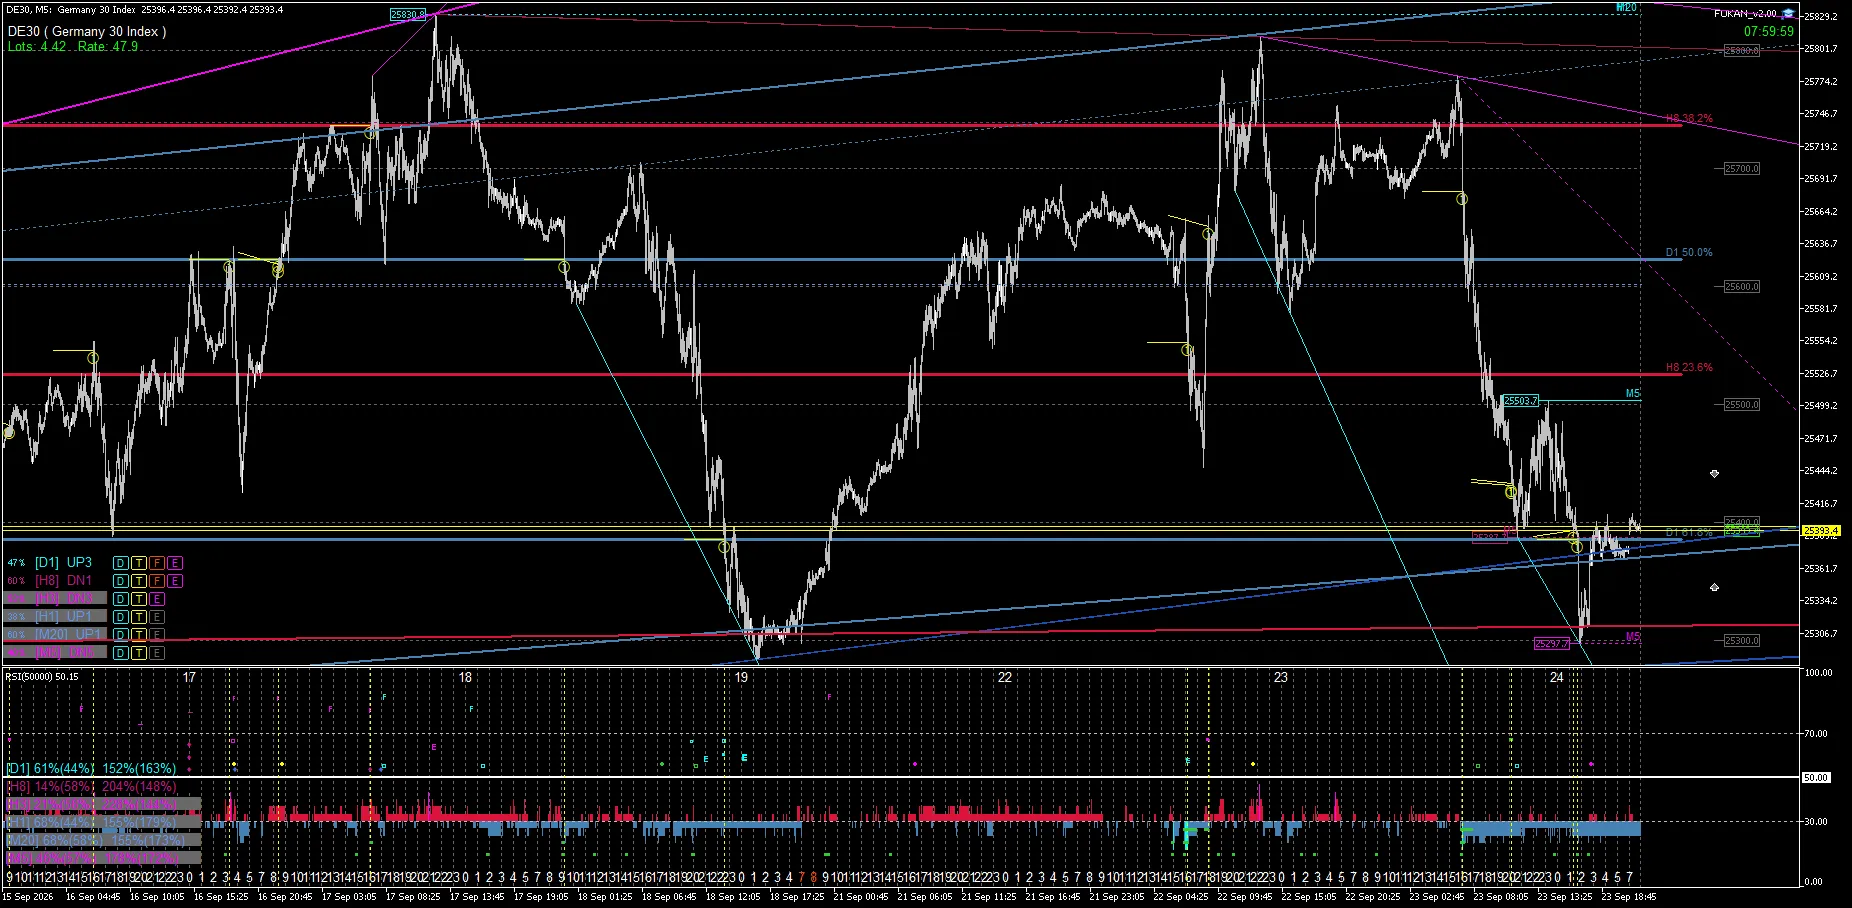
Using the MT5 chart from September 24, we review the progression after DE30's decline at three points: 00:00, 04:00, and 08:00. Next, around 08:00, we compare US30 and US500 side by side to confirm that even the same stock indices occupied different relative positions.
The theme this time is not only “whether a signal appeared,” butwhere the current price lies among multiple lines and how that position changed over time. The following are market observation records using actual saved screenshots of FUKAN from that time.
※The times shown are the save times recorded in the image filenames. Please distinguish these from the chart price axis, time axis, and the broker server time.
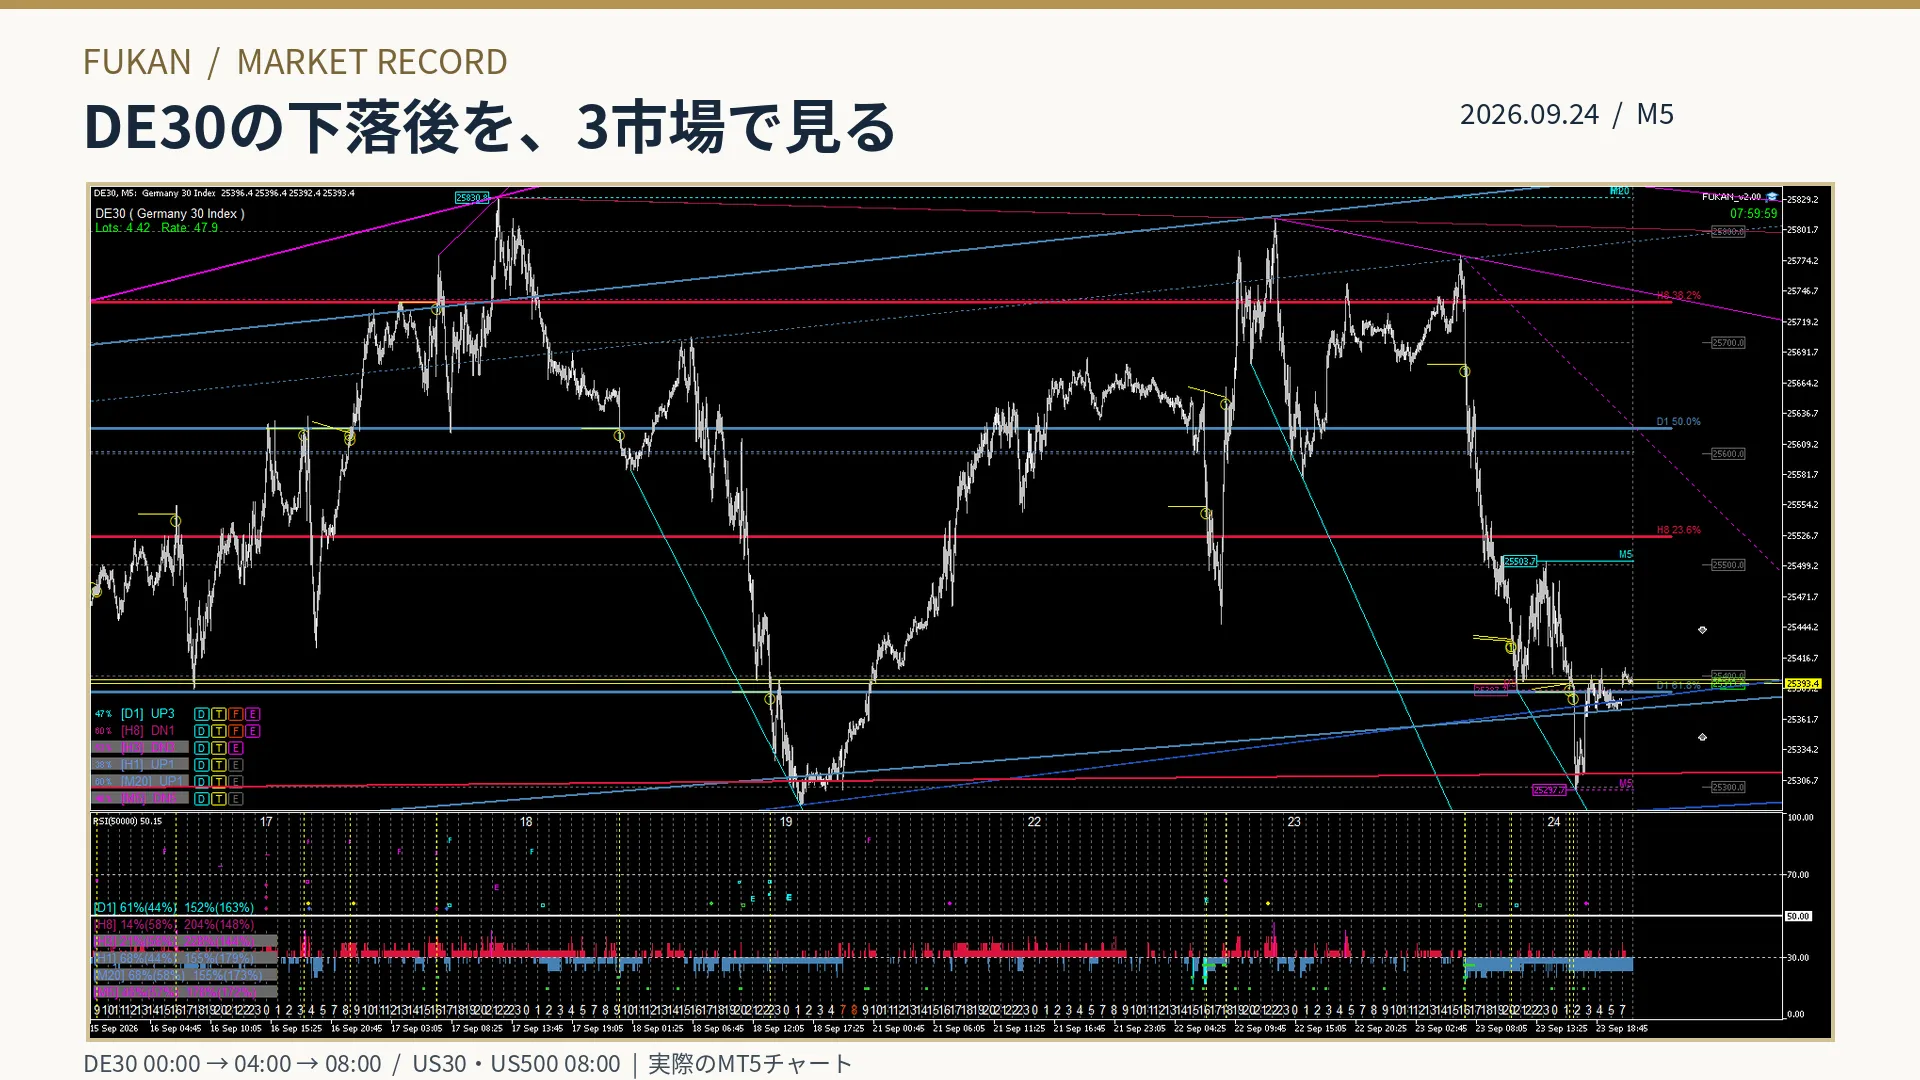
1|DE30 — 00:00: After the decline, which level is it at
In the first record, after the decline from the high price area, the rightmost price is moving toward a price range where several horizontal and diagonal lines are close. This serves as the starting point to confirm the types of lines displayed on the screen and the distance to the current price.
At this point, being near the lower price area and the idea of a rebound continuing are two different things. In the next record, we compare how the price position changed.
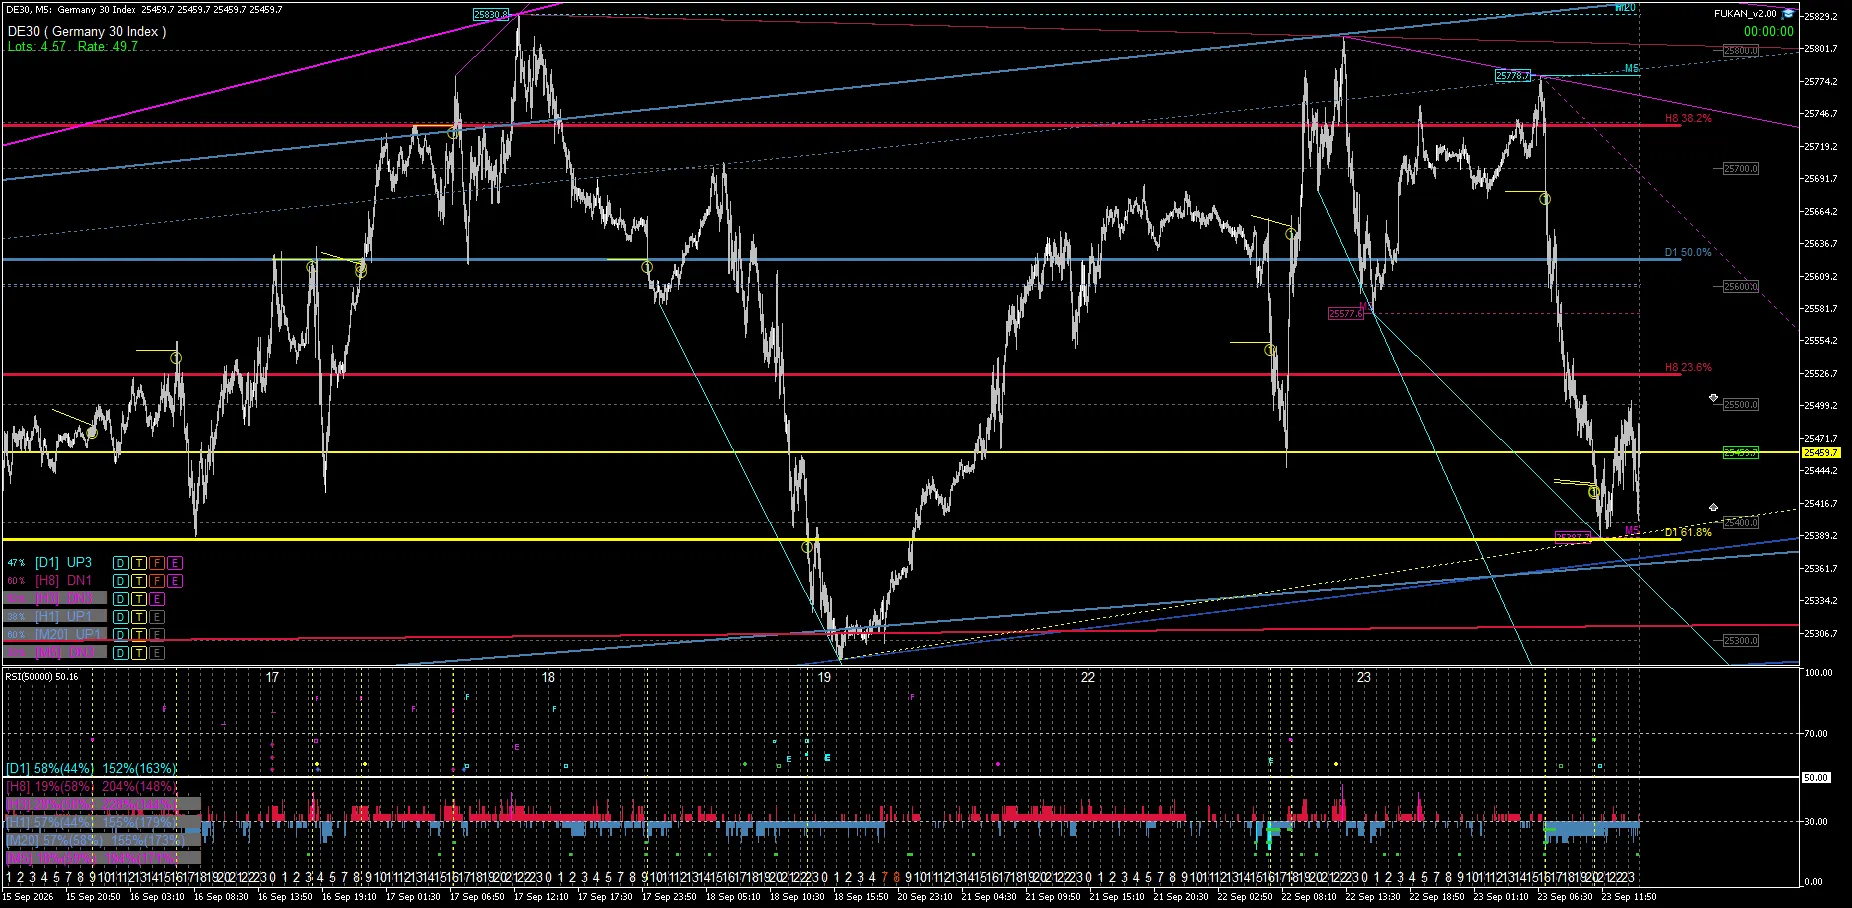
2|DE30 — 04:00: Approaching the lower line cluster
In the 04:00 record, the rightmost price is positioned at a lower level than in the 00:00 image. The relationships with multiple horizontal and diagonal lines on the right side of the screen change, allowing us to trace which region the post-decline price reached.
Thus, even with the same chart and the same display settings, placing images from a few hours later lets us distinguish approaching key price zones and the price movements after reaching them.
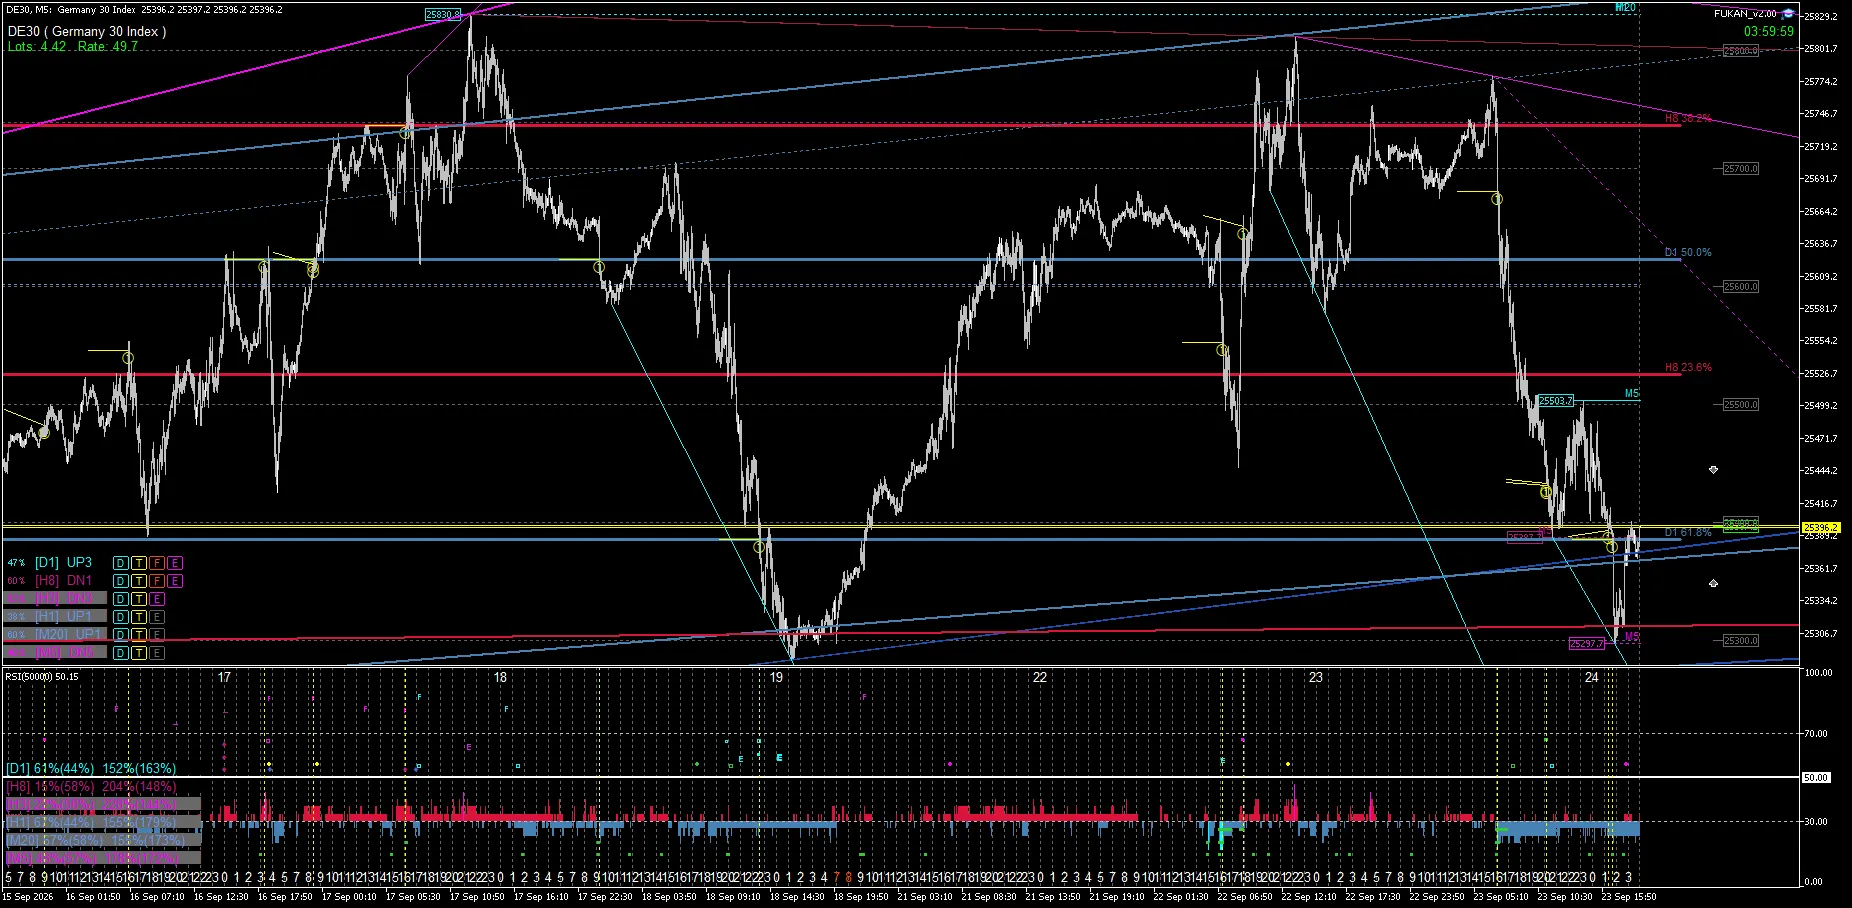
3|DE30 — 08:00: Reconfirming positions in the low price zone
In the 08:00 image, DE30 is still close to the lower price band. If viewed in order from 00:00, you can confirm not only that a decline occurred, but how far it fell and around which levels it fluctuated during the process.
Just because a price approaches a displayed line does not guarantee a rebound.Whether it reacts, breaks through, or does not react remains the next observation targetfor FUKAN Market Record.
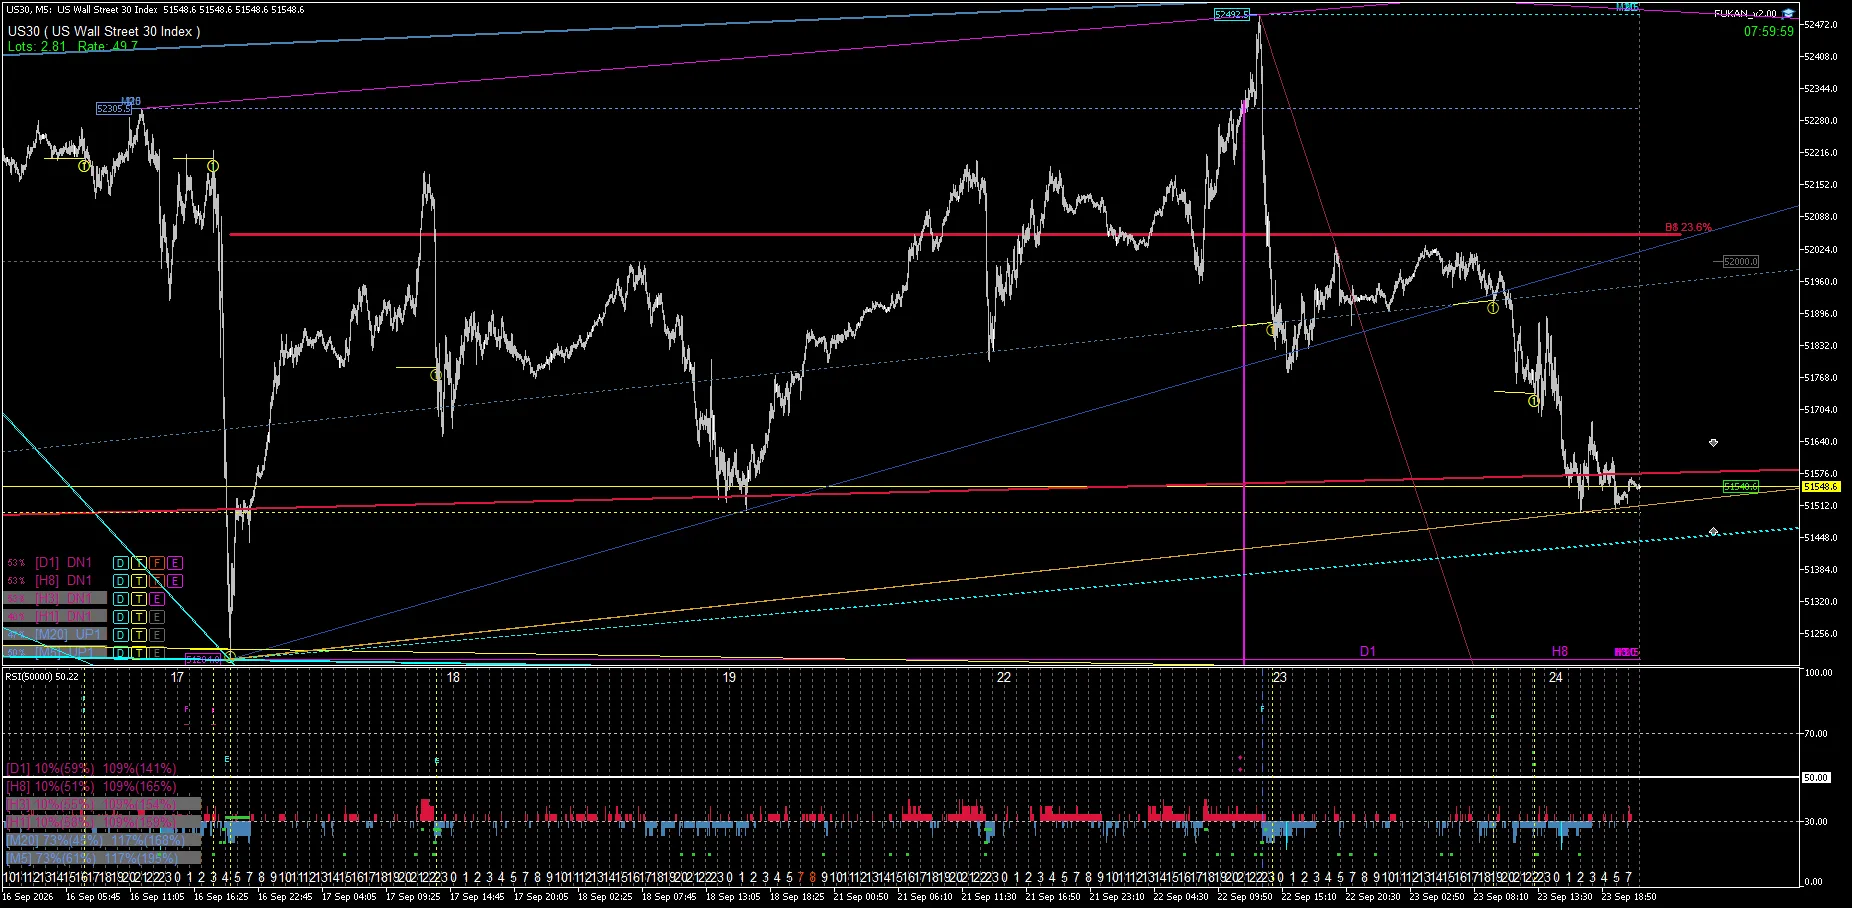
4|US30 — 08:00: The same moment, different market structure
In US30 around the same moment, after the immediate prior decline, the rightmost price approaches a horizontal price band. Even on the same M5 screen as DE30, past price moves, line positions, and the magnitude of the previous drop do not match.
Do not apply the same level or reaction seen in one index directly to another index. The value of listing multiple markets side by side is that you can confirm these differences using the same display method.
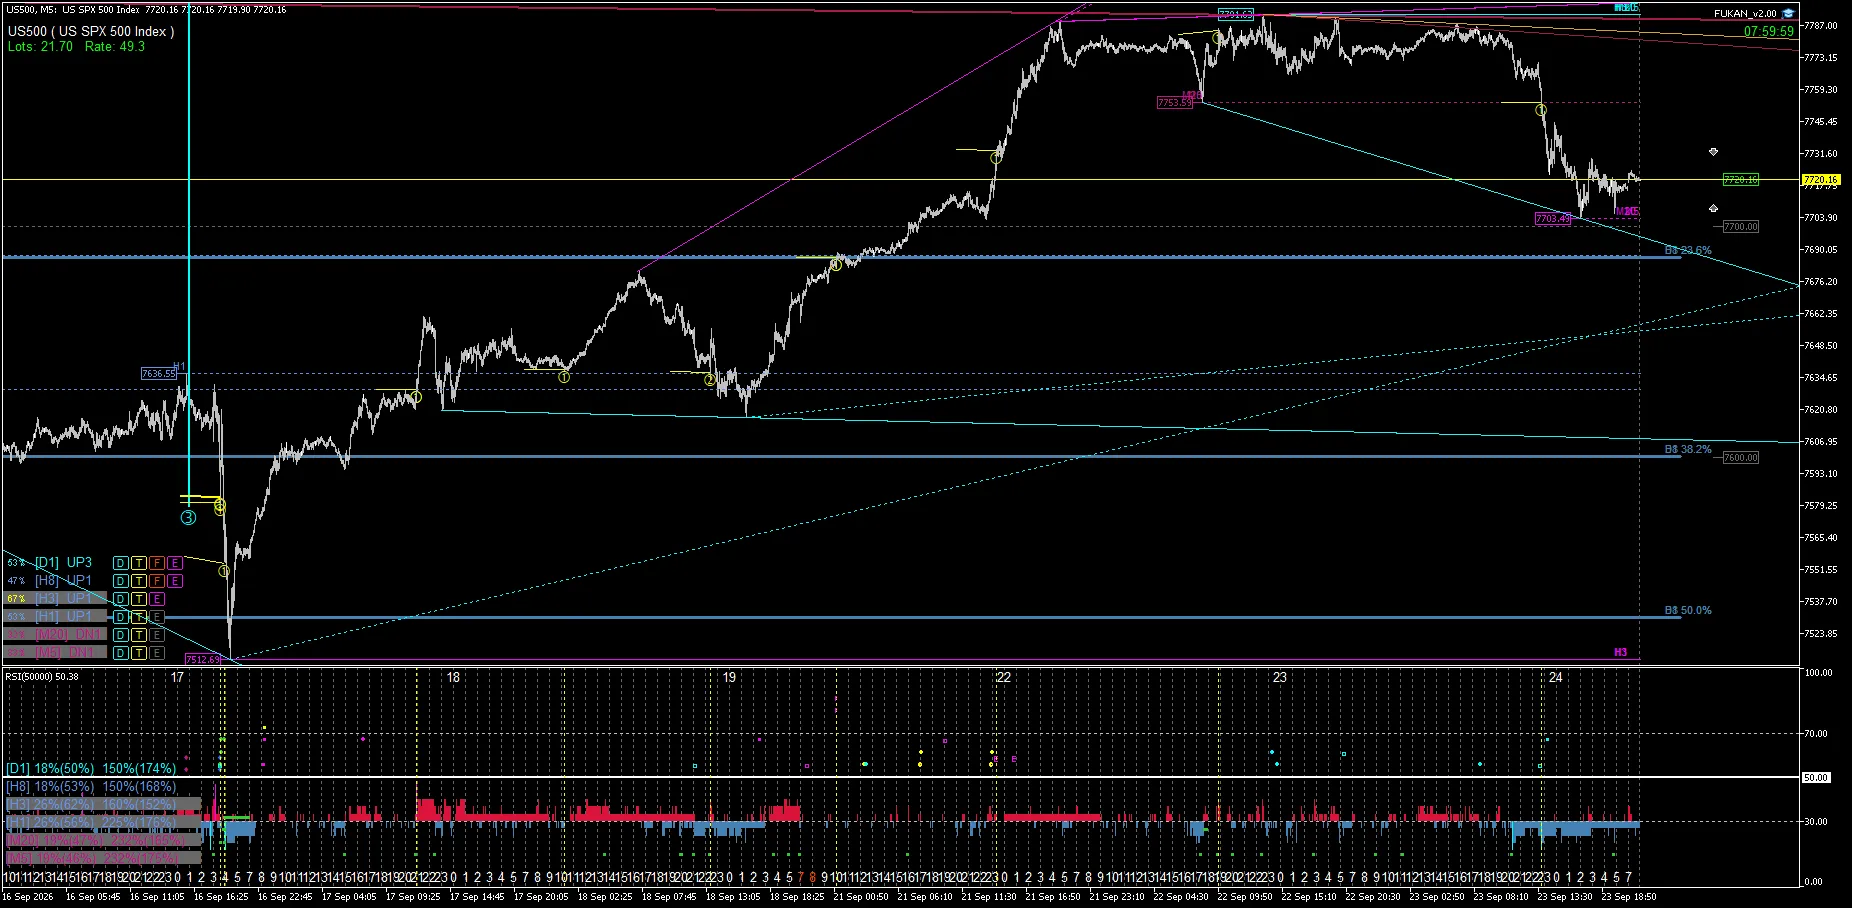
5|US500 — 08:00: Observing the pullback after the rise
The US500 image shows a continuation of the rise from the left, then movement in the high-price area, followed by a pullback on the right. Even though it occurs around the same time as 08:00, the price movements follow a different path from DE30 and US30.
Even when prices are falling at the same time, what happened before—whether there was an earlier rise or continued decline—changes the price areas to watch and the meaning of comparisons.
The meaning of viewing with FUKAN
FUKAN is a tool for displaying multi-timeframe market structure on MT5 and organizing different levels such as Dow, Break, Trend/Channel, Fibonacci, and Elliott on a single screen. MAIN / SUB allow parallel observation of different securities as well.
These five images were saved using that functionality to record actual market observations. Rather than merely showing signal success or failure,they preserve the passage of time around declines and differences with other indices. From these images alone, you cannot determine the statistical superiority of each line or future price movements.
Summary
By lining up DE30 at 00:00, 04:00, and 08:00, we confirmed the relationship between post-decline prices and the lower line clusters in chronological order. Adding US30 and US500 reveals that even at the same time, the paths of price movements and the positions relative to the lines differ.
On September 25, 2026, FUKAN began selling on GoGoJungle. The product overview and how to apply for the 7-day free trial areon FUKAN’s product pagefor your review. Please first verify the display and operation in your own MT5 environment.
This article is a market observation and analysis record and not investment advice or a buy/sell recommendation. It does not guarantee future price movements, profits, or win rates. The content displayed and the available features vary by settings and broker environment.