
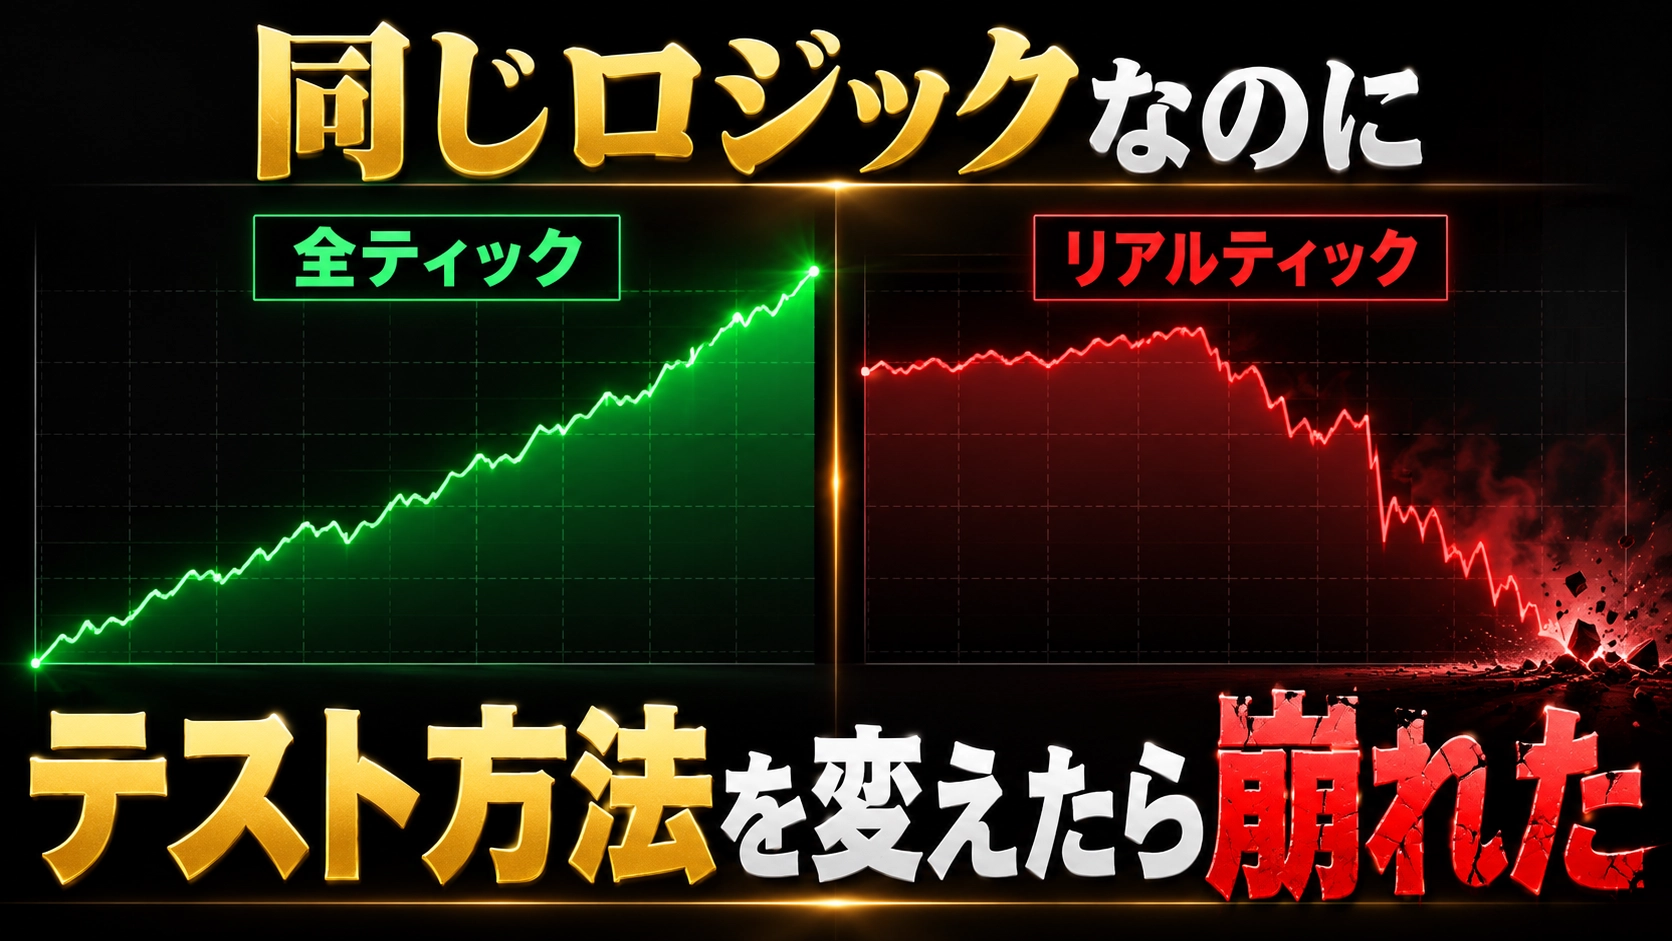
[EA Development Failures] The EA that was "always rising" with any currency collapsed the moment one testing method was changed
Last time I wrote about five numbers I check when opening a backtest — maximum drawdown, number of trades, PF, win rate, and testing period.
So, assuming you hold these five points, if a profitable EA remains so when you change the period or switch currencies, is it trustworthy?
A while ago, I actually built such an EA. There wasn’t a strong anomaly from the five perspectives.
Even so, it collapsed when a single test condition was changed, and I stopped development.
This is the story of that.
“It might be a quite strong logic”
The subject was a short-term scalping EA for the forex market. I’ll skip the fine details, but it targeted short rebounds near a horizontal line,
Approach the horizontal line → confirm a 1-pip rebound within 5 seconds → enter
using price movements in the second range.
The initial results looked good. However, a single good result isn’t enough to feel confident.
It’s natural in development to doubt, “Is this only for this period?” or “Is it only biased to this currency?”
Even when changing the period, it stayed positive. Expanding currencies also remained positive. In the end I looked at USDJPY, GBPUSD, EURUSD, GBPJPY, and EURJPY — five currencies — and all were positive.
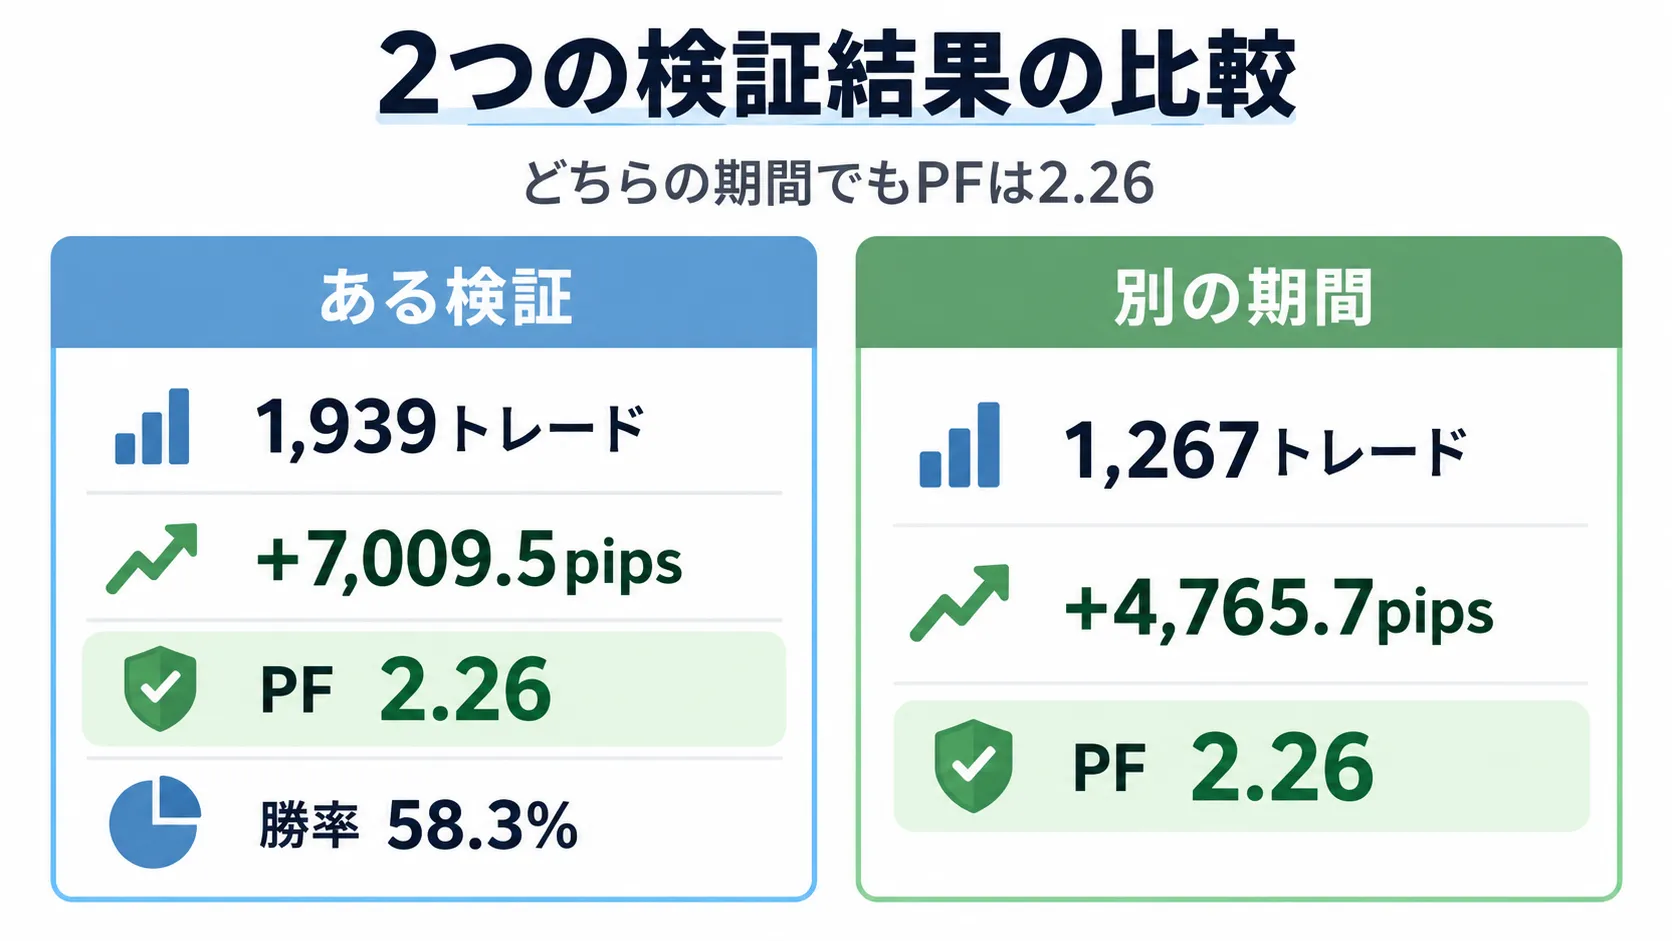
In one test, for the total of five currencies
1,939 trades
+7,009.5 pips
PF 2.26
Win rate 58.3%
In another period
1,267 trades
+4,765.7 pips
PF 2.26
In the latter, about 30 of 32 months were profitable out of roughly 2 years and 8 months.
The number of trades wasn’t extremely small, PF wasn’t unrealistically high, and win rate wasn’t in the 90s.
Even by the five viewpoints I wrote about previously, there wasn’t a strong anomaly.
Two tests with different periods both had PF 2.26 for all five currencies, so at the time I thought,
“Perhaps I’ve found a fairly strong logic.”
What I had overlooked
As I continued testing, there was something that bothered me.
In MT5 Strategy Tester there are several ways to reproduce price. Up to then I’d run it in “every tick.”
But this EA isn’t the type that holds for a long time.
“Did a 1-pip move within five seconds become the basis for entry?” is the branching condition. A few seconds of price movement sequencing decides the result.
“Wouldn’t it be better to check with real ticks, not generated ticks?”
With that thought, I changed only the test method—from “every tick” to “all ticks based on real ticks.”
The logic and parameters were the same. Only the testing method changed.
When I ran it again, at first I couldn’t immediately grasp what happened.
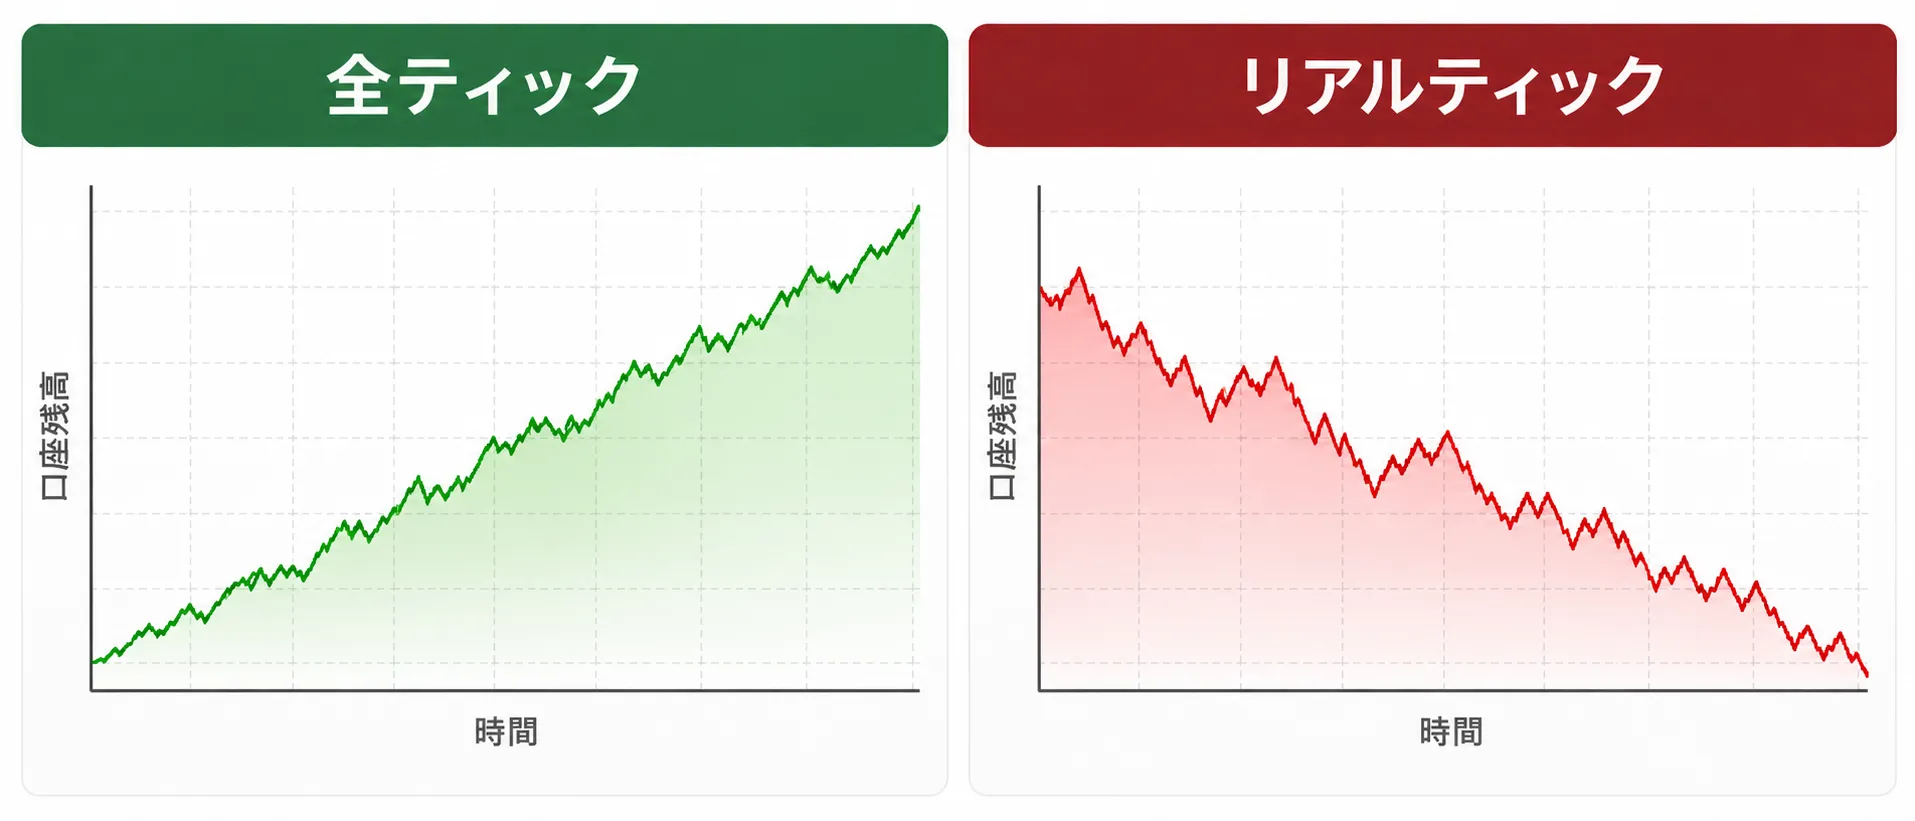
PF around 2 changed to PF 0.82
In the initial real-tick results,
894 trades
Net loss −77,670 yen
PF 0.82
What had looked like a rising curve now showed numbers on the losing side.
Yet, I didn’t immediately conclude “the EA is over because of real ticks.”
There could also be data quality issues. I shortened periods and checked other ranges, but the same trend appeared, so I concluded the problem lay in the logic, not the data.
Further investigation revealed a more troublesome discrepancy.
Even with the same “1-pip rebound,” the count was about 2.7 times higher
I compared how many times the conditions were met in full-tick vs real-tick.
With full-tick, “1-pip rebound within 5 seconds” happened 509 times. With real-tick, 1,375 times. About 2.7 times more.
Initially I suspected the spread. Real-tick includes finer Bid/Ask movements, which could exaggerate spread effects.
Even when narrowing to narrow-spread scenarios, results didn’t recover.
The problem was a bit earlier than that.
The phenomenon identified as “1-pip rebound” differed depending on the mode.
In actual ticks, prices move up and down even within short times.
As a result, you get cases like: approach the horizontal line → briefly move back 1 pip → EA marks rebound and enters → then move back in the original direction
In contrast, in the full-tick mode, during the tick generation process, the perception of these tiny reversals differed.
Even using the same conditional expression, the granularity of price movement being handled differed from the outset.
Rechecking the 406 winning cases from full tick on the real side
So, how did the trades that were profitable in full-tick behave on the real-tick side?
I extracted the actual 406 entries from the full-tick version and cross-checked them with their real-tick counterparts at the same timestamps.
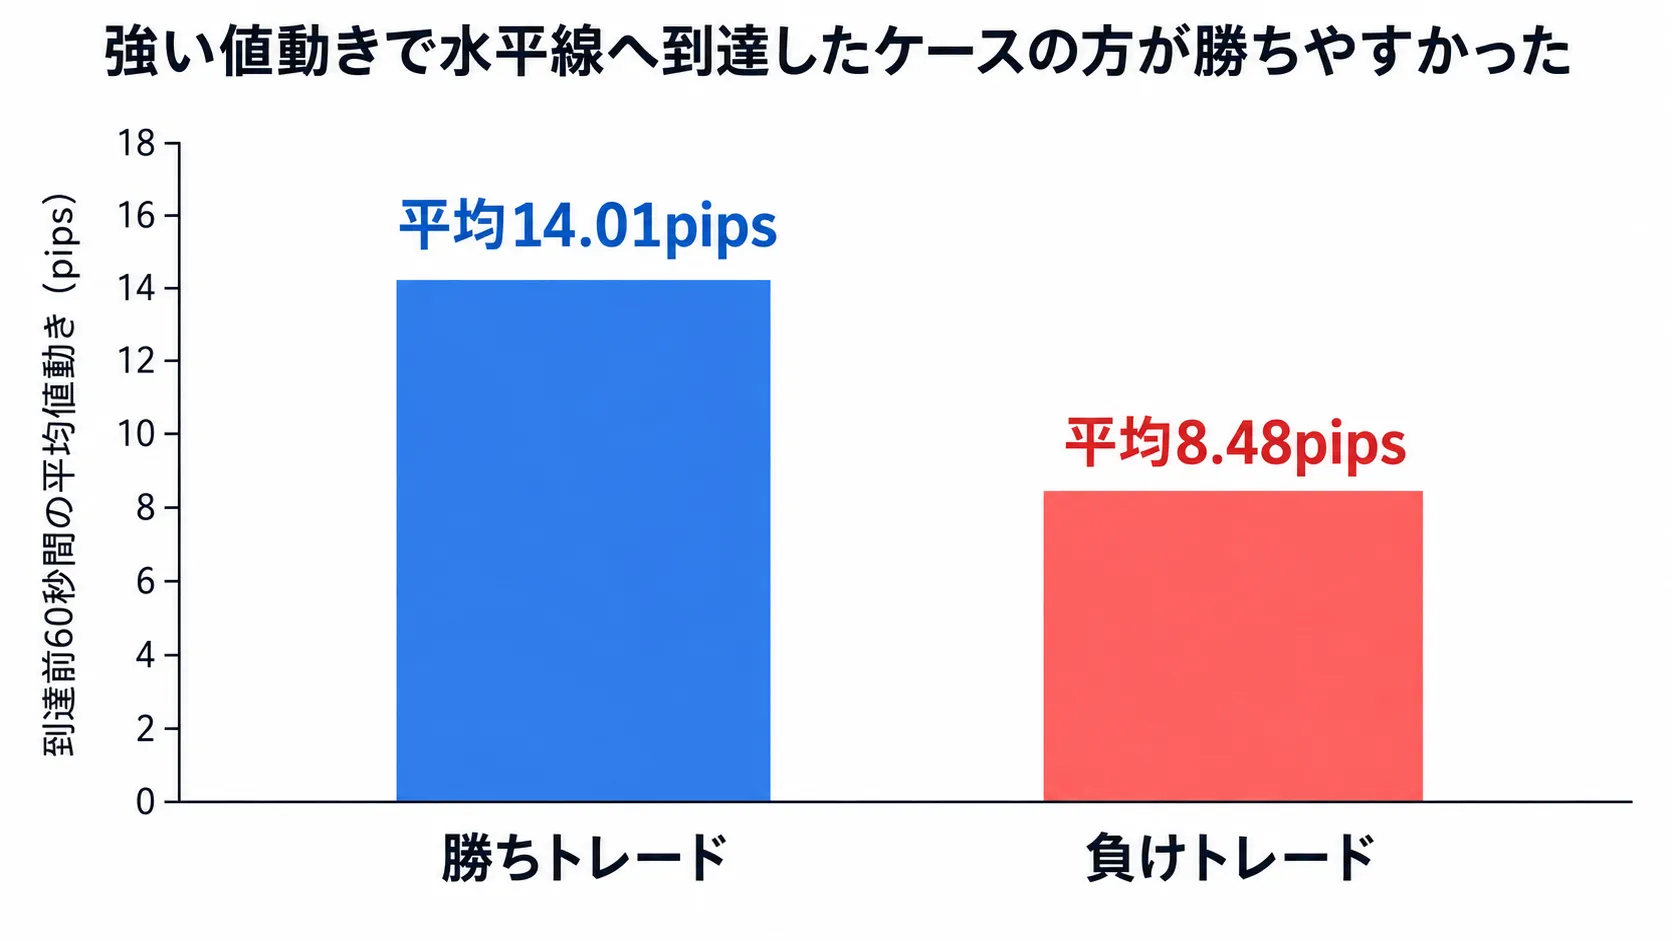
The winning-side tended to be cases where the price moved strongly into the horizontal line rather than just touching and rebounding by 1 pip.
The price range 60 seconds before touch averaged 14.01 pips in wins and 8.48 pips in losses.
For cases that moved more than 20 pips, the full-tick win rate rose to 87.3%.
Here I began to see what the full-tick version was capturing.
“The 1-pip rebound within 5 seconds” did not accurately represent the intended movement
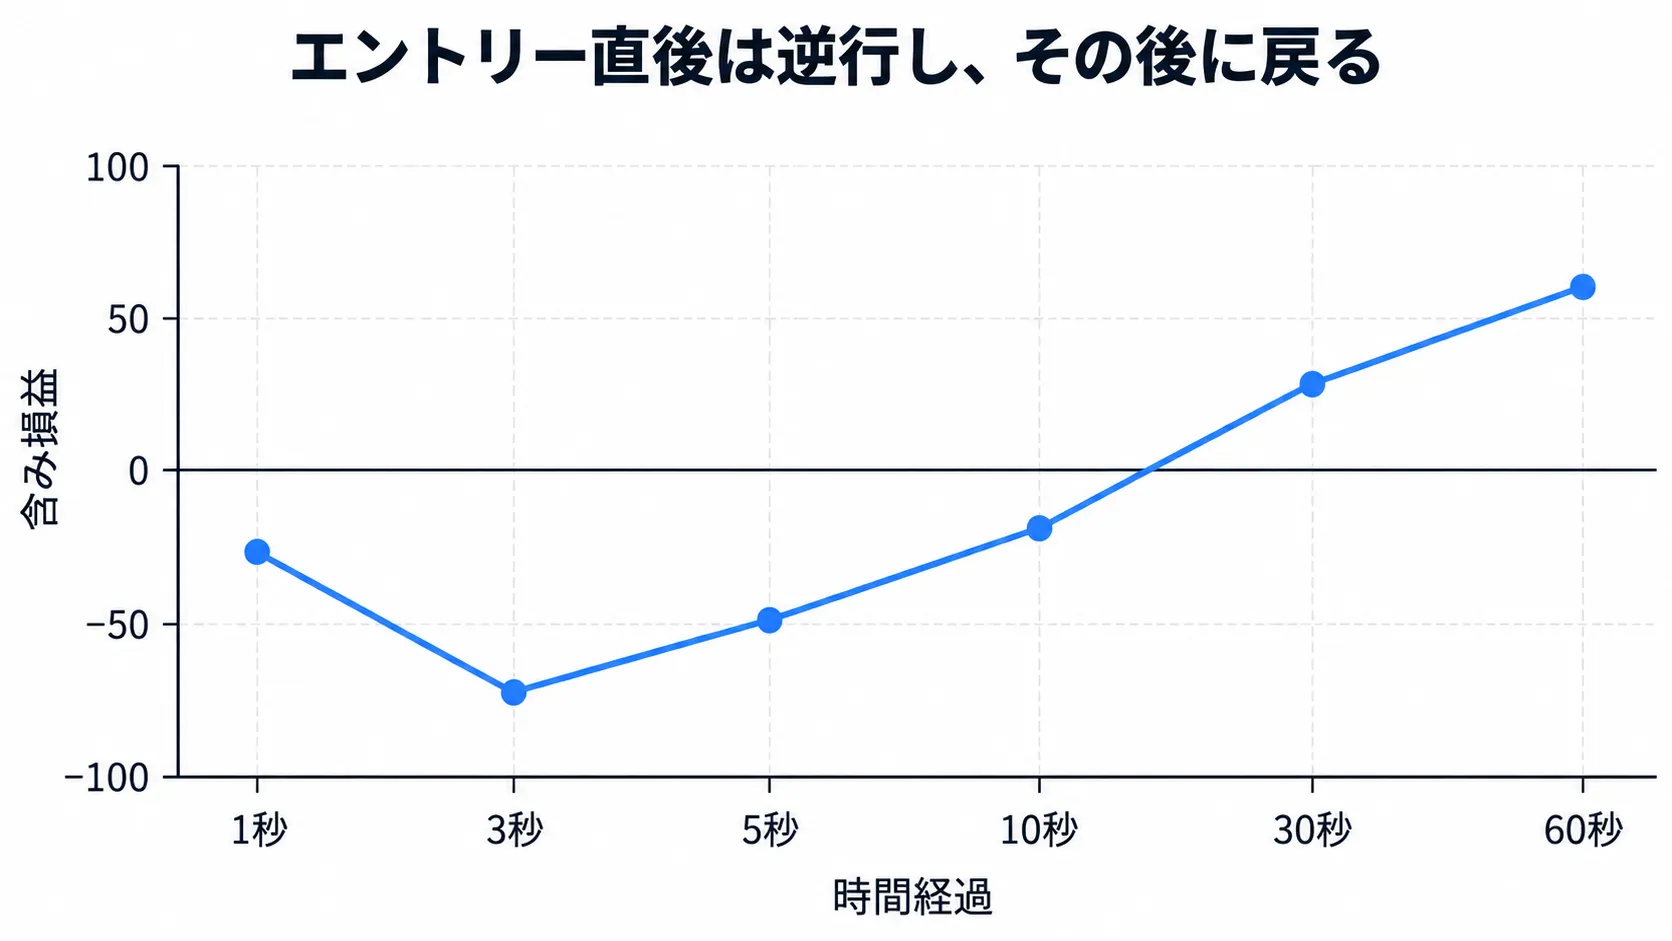
However, looking at the real-tick average, even the winning trades in the full-tick did not strictly move in a straight line right after entry.
1 second later: −1.98 pips; 3 seconds later: −1.46 pips; 5 seconds later: −1.14 pips; 10 seconds later: −0.52 pips
More often than not, it initially moved against the entry. Then it
30 seconds later: +1.44 pips; 60 seconds later: +2.22 pips
and gradually recovered over time.
In other words, the original definition “rebound within 5 seconds by 1 pip” may not have accurately captured the dynamic I wanted to exploit.
What stood out was a pattern of moving into the horizontal line with strong price action, pausing near the line, and then reversing over 10–60 seconds.
At this point, it’s almost a different beast from the initial EA.
I considered rebuilding, but stopped
Once I investigated, I didn’t give up immediately. I gathered real-tick candidates and tried to rebuild the conditions.
Ultimately, using 3,897 cases as material, I compared pre-touch price ranges, rebound ranges, spreads, seconds, and other factors.
Without filters, PF was roughly −0.55 to −0.56 even after 5 seconds or 30 seconds.
With filtering, the results improved to:
Pre-touch range of 60 seconds at least 20 pips
After 10 seconds, rebound direction by at least 1 pip
Spread 2.0 pips or less
This yielded 44 cases / average +3.21 pips / win rate 68.2% / PF 1.43.
I thought “it might still be workable.” But only 44 cases remained from several thousand.
Relaxing the conditions caused the numbers to drop quickly.
If I added more conditions, I could probably create a backtest that looks good.
What I felt then was, “I’m starting to add conditions to fit the results again.”
So I stopped development of this EA for now.
I don’t want to promote the idea that reality ticks are the correct path
I’m not saying “don’t trust full-tick results.”
Different EAs require different levels of price data detail.
This time the big swing came from the entry depending on a very short sequence of 5-second, 1-pip movements.
Logic judged by the second can yield different results depending on how ticks are reproduced.
For longer time-frame EAs, the same width difference doesn’t necessarily occur.
Also, real-tick is not always correct. Data history quality and capture environment can change what you see.
What you should remember is not the mode name, but how your criteria depend on the data’s granularity.
Honestly, there are still parts I can’t fully verbalize yet.
Before the numbers, how that number is made
The five numbers I wrote last time — DD, number of trades, PF, win rate, testing period — I still look at them.
But one more thing comes before them: “From what testing conditions did that number arise?”
This EA, even when you change the period or the currency, the number of trades, PF, and even the monthly view, didn’t look bad.
Nevertheless, it collapsed when you only changed the testing method.
If the curve had looked suspicious from the start, it wouldn’t have left such a strong impression.
It’s a memory I have because it was a rare case of “I tested skeptically and still missed it.”
When I see a nice, clean upward trend, I’m still honestly happy. But one more thought arises next.
“Did this upward trend come from the logic or from the testing environment?”
In closing
This EA never completed. I ran it for days, exported CSVs, looked at thousands of cases, and ultimately stopped. If you judge by results alone, it’s a failure.
However, when I look at backtests afterward, I now pay attention not just to results but to the testing method itself.
There is something to learn from a completed EA, but even more from something that didn’t complete.
Next time I’ll write about money management, especially averaging down.
This won’t be just a piece of negation. I’ve touched it before and it remains a topic I’m still developing.
I’ll organize, from practical experience, what parts of the backtest look attractive and what I look at to avoid misjudging.