
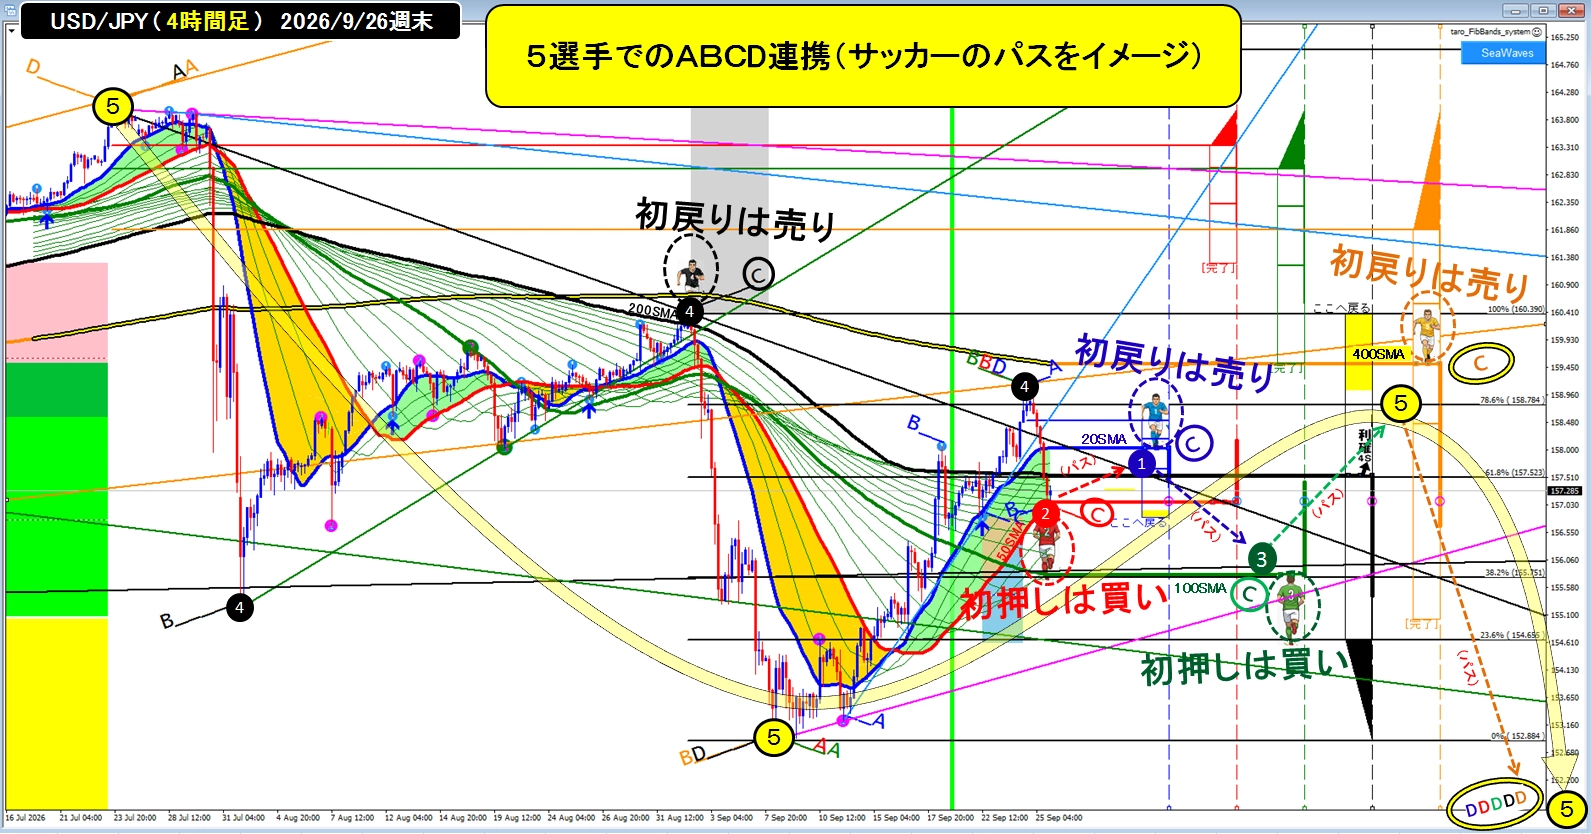
Analyze USD/JPY (4-hour chart) from the perspective of "buy on first push" and "sell on first pullback" (as of the end of the week of 9/26)
This article aims to help readers grasp the price action imagery for USD/JPY (4-hour chart) as of the weekend of 9/26, from the perspective of “the first pullback is a buy” and “the first pullback is a sell,” by showing how each of the five moving averages (20/50/100/200/400 SMA) would look and how they relate to one another.
<Basics of “First Pullback is Buy” and “First Return is Sell”>
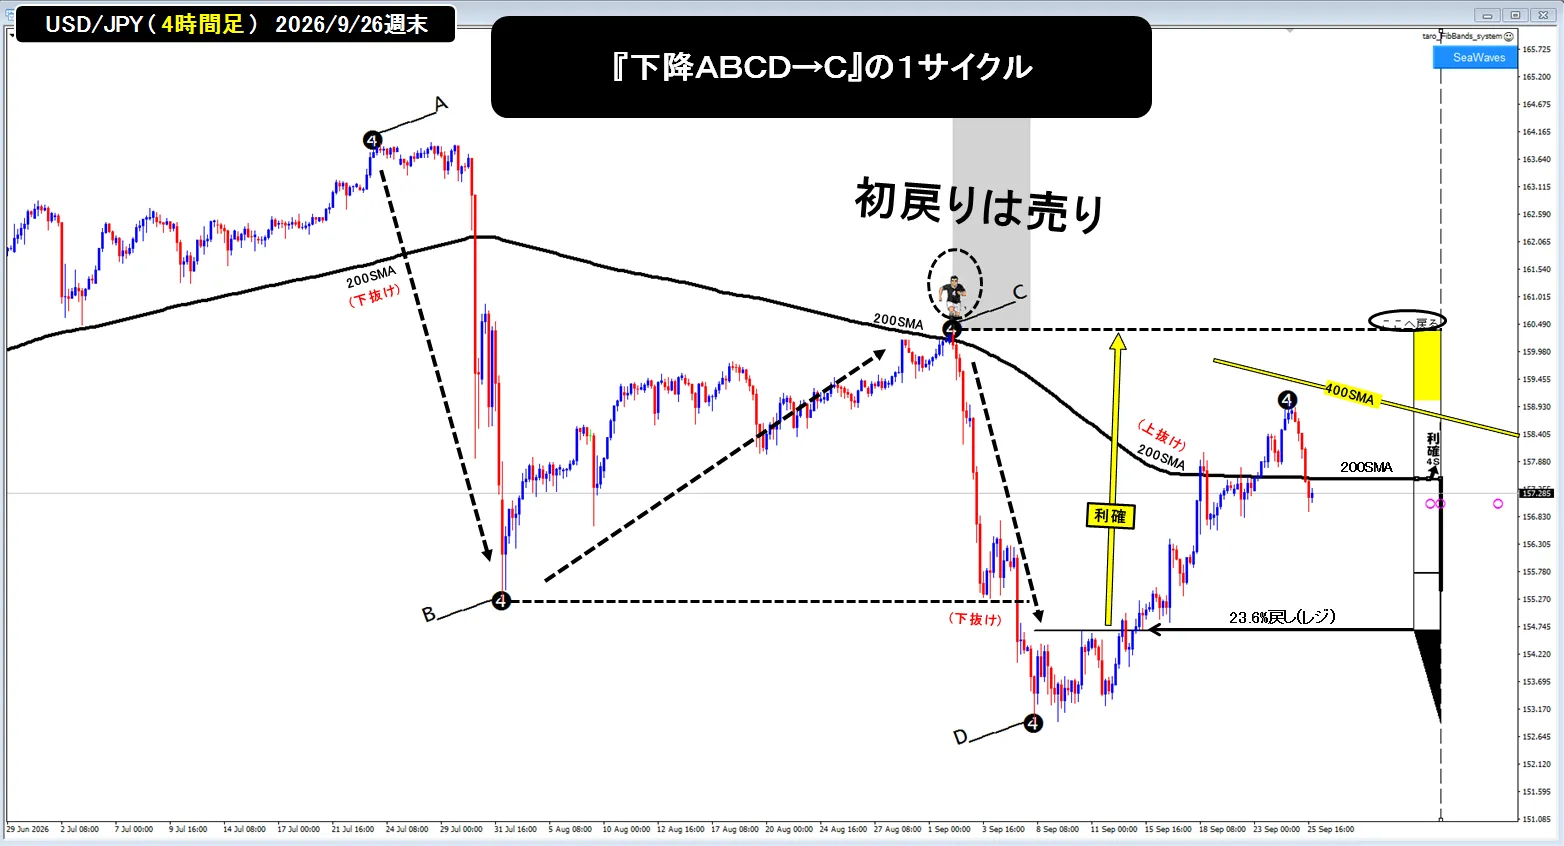
●‘First Return is Sell’is likely to occur at certain levels,the USD/JPY (4-hour chart) 200SMAas an example of a “first return is sell.”‘One cycle of price action ABCD→C’will be examined step by step.
●A pointis, as shown in the figure below, above the upward-sloping black 200SMA where the candlesticks are supported and rise,the point most distant above the black 200SMAis reached.
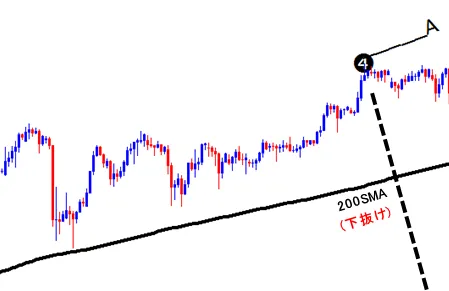
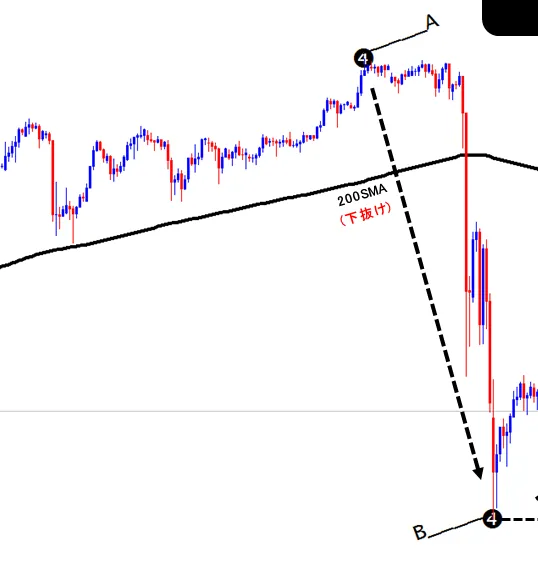
●B pointis, as shown below,the point where price breaks below the black 200SMA and overshoots to the downsideis observed.
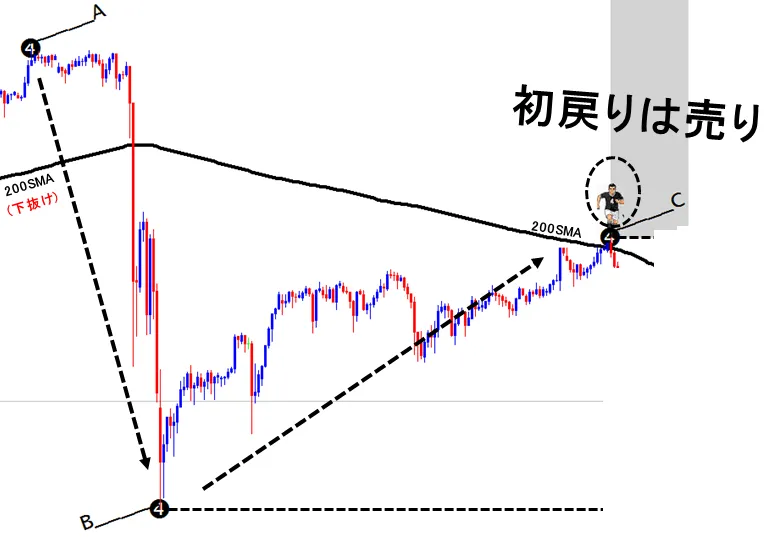
●C pointis, as shown below,the point where the black 200SMA turns downward and the candlesticks press against it from above. This is wherethe ‘First Return is Sell’entry for a return sell (short) may be considered. Profit targets are below B point.(This lower zone becomes D point). Aggressive traders may enter short around the candlestick touching from below or above the price closing above the level, aiming to exit with break-even if it touches from above, or may enter short around where a slightly smaller moving average line is penetrated by the candlestick body, hoping for a support-resistance flip, among other scenarios.
●D pointis, as shown below, in the lower zone below the B point.Further downside is unknown,but in any case, the zone below B point will be the D point. Depending on other moving average traders or those using different time frames,there are cases where B point cannot be penetrated. In such cases,a rise can occur in proportion to the range between CD once C point is broken above.
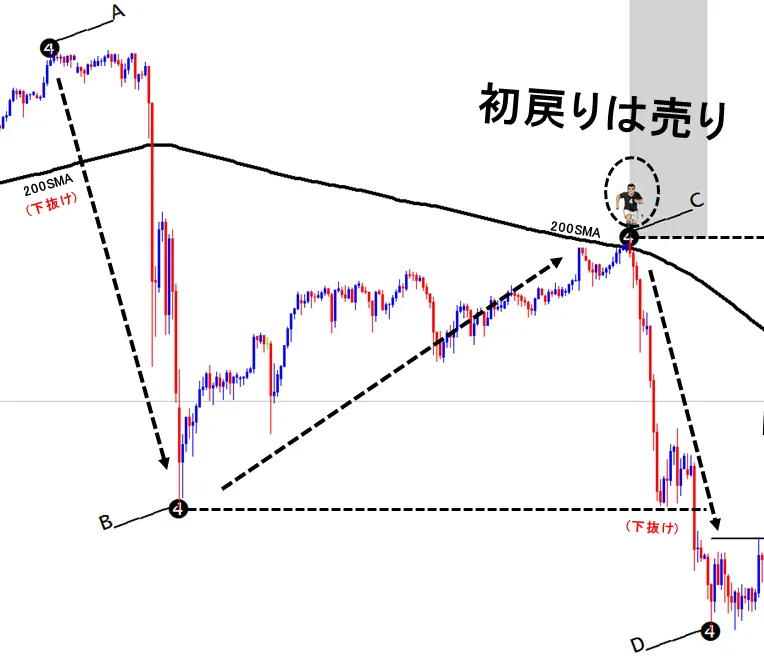
●Return from D→Coccurs as shown below,when taking profit on the short positionfrom C. Traders who went short from Care looking at a 23.6% retracement of CDbelow, and as long as the close remains below this levelthey interpret continued overshoot and downside movement, so many traders hold shorts. However, as shown, if price cannot drop past the 23.6% retrace and instead makes a higher low with the candlestick bodies closing above,they begin to exit shorts with a close above. If the close breaks above the black 200SMA and the upper zone is held, more traders will exit shorts (some may go long). If no one interferes,all profits are taken and price returns to point C, bringing trader capital back and resetting the setup to flat, completing the full first-back sell cycle.Essentially,after that, traders will use a larger moving average to execute a first-back sell again,orafter an upside overshoot, revert to the black 200SMA and consider a ‘First Push is Buy’ trade using re-covered marginas a basic approach. However,in cases like the current weekend chart for USD/JPY (4-hour) where a larger moving average sits below C point and heads downward pressing the price,a return to C may not be possible, and a trader using a larger moving average may opt for a ‘First Return is Sell’ and push for a new low.
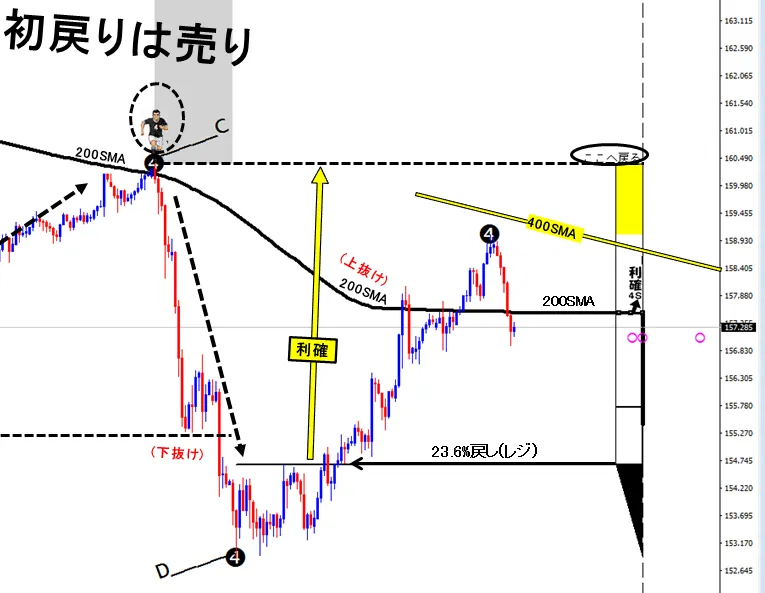
●We have summarized the entire下降 ABCD→C sequence in the figure below for those who want an overview.
Next, using the current USD/JPY as of the weekend of 9/26 (4-hour), we will examine “First Push is Buy” and “First Return is Sell” withthe five moving averages of varying scales (20/50/100/200/400 MA)in sequence.
●Blue① 20SMAas shown in the figure, from this week’s start on 9/21 (Mon),in the coming weektouching the blue 20SMA at B→C confirms a ‘First Push is Buy’,and after the breakout above point B, the price completes ABCD through a push-back to C,then retraces back to C by profit-taking on a push-buy (long),and we end up with D point below and the 20SMA broken to the downside, forming a blue B point near the red 50SMA towards the week’s end.We end the week with this setup.
(Next week,the blue① 20SMA trader expects the price to rise from the B point toward the blue 20SMA area near the downward turning line, then enter a short after seeing a ‘First Return is Sell’ at that level, targeting the D point below B (past the 50SMA).
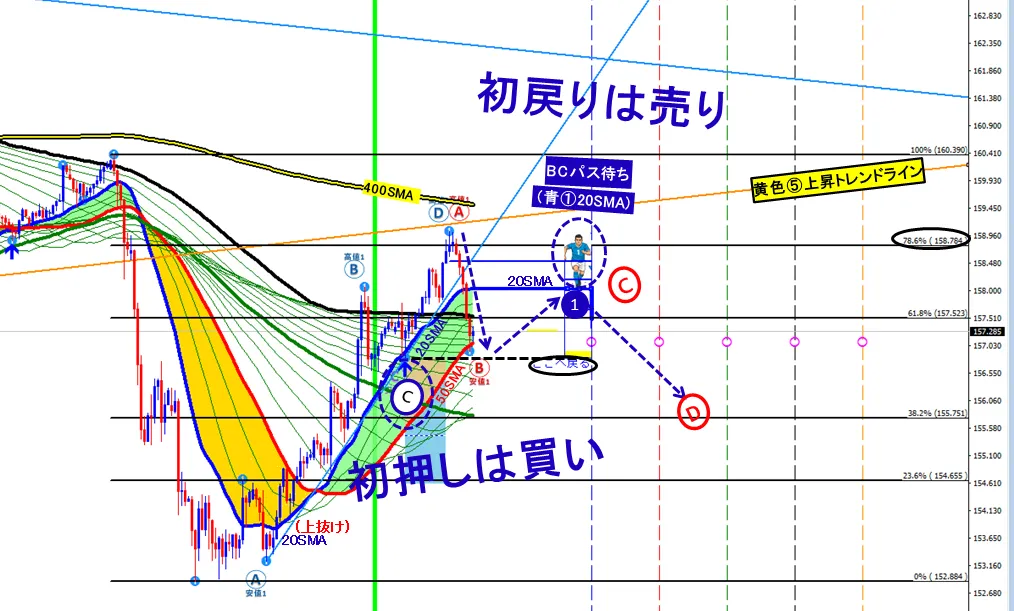
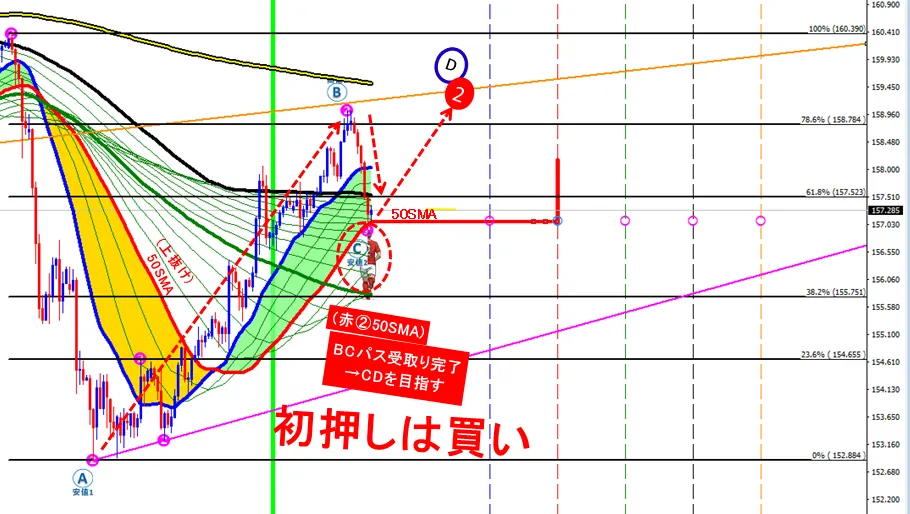
●Red② 50SMAis, as shown, from this week’s start on 9/21 (Mon) through the end of this week, rising to B,then retracing back to red 50SMA by the end of the week via B→C,
(Next week, red ②50SMA traders will enter long based on the adage “First Push is Buy” near red 50SMA aiming to rise to the D point beyond B, but expect to be stopped by the blue 20SMA; however, there is a possibility that the blue 20SMA breaks above and red B point is broken above. However,there is also a possibility that the blue 20SMA breaks above and the red B point moves higher.)
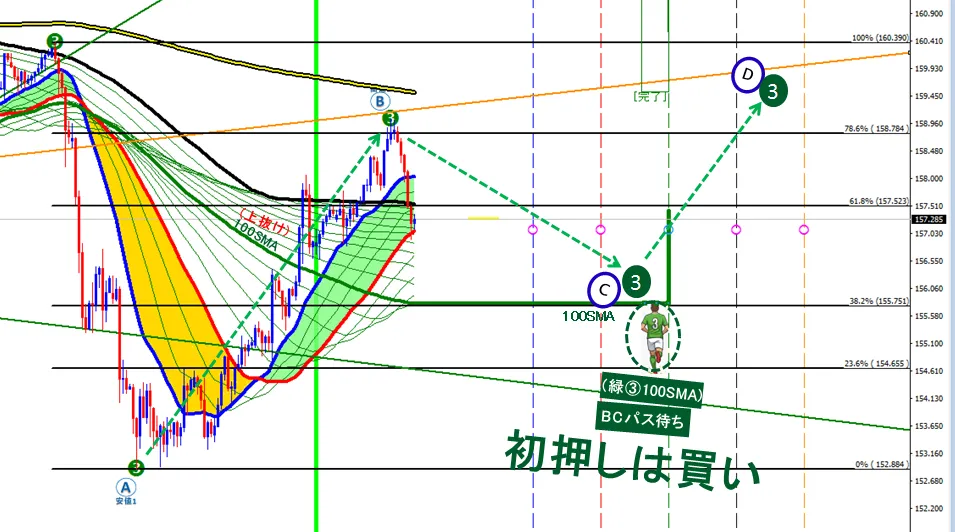
●Green③ 100SMAis, as shown, from this week’s start on 9/21 (Mon),overshooting and rising in the coming week has formed B, and the weekend finds us at B.
(From next week onward, green③ 100SMA traders will wait for price to drop from B to around green③100 and then enter long, using the maxim “First Push is Buy,” aiming for an ascent beyond D.
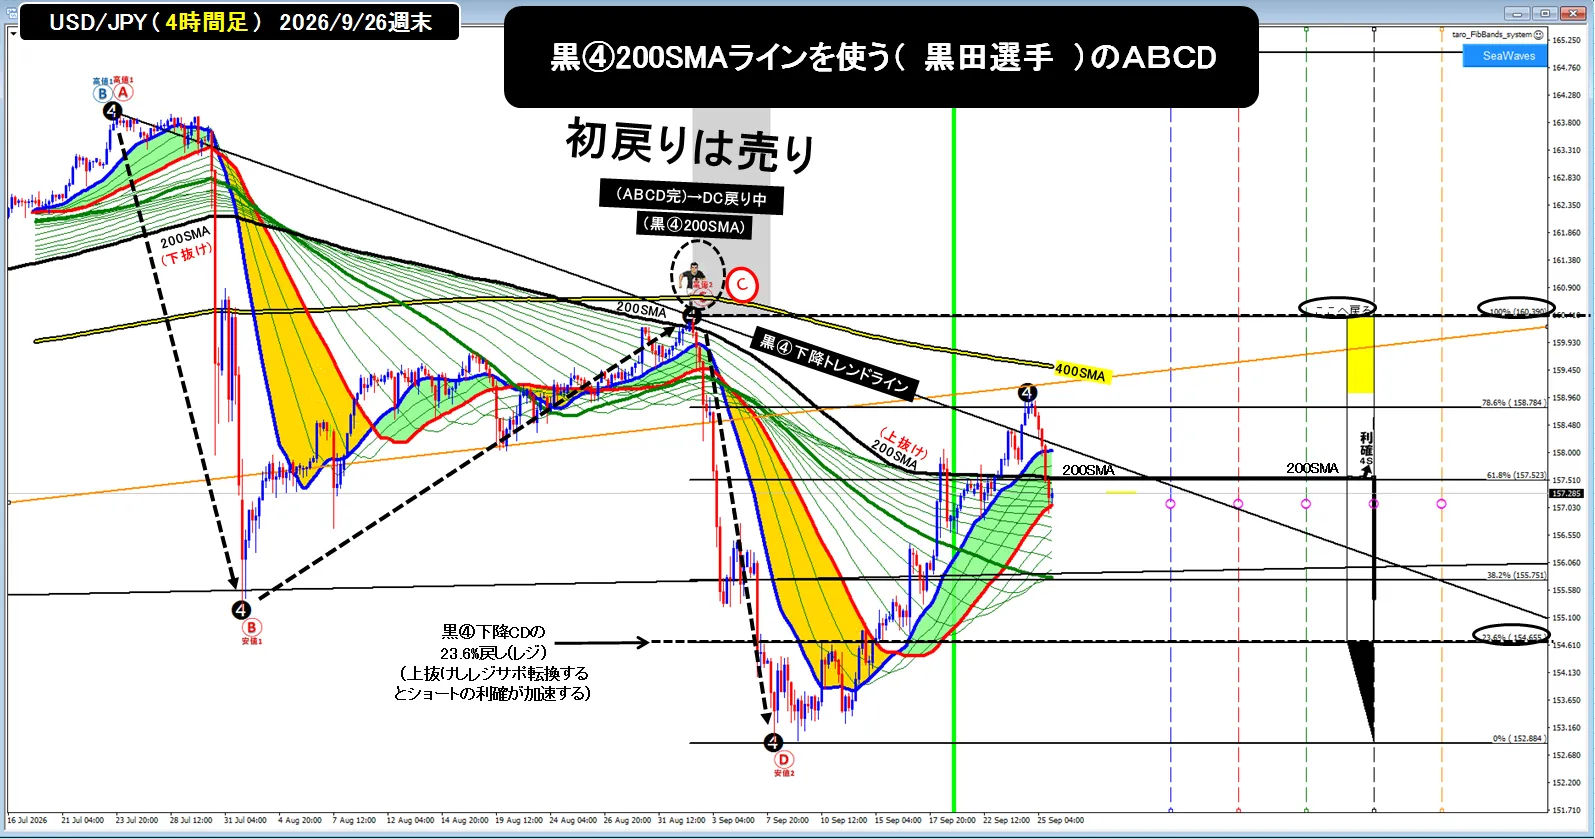
●Black④ 200SMAis, as shown, after the ABCD decline completes, accelerated profit-taking from the CD’s 23.6% retrace into a resistance-support turn, and after breaking above the Black 200SMA and the Black ④ downtrend line, it did not overshoot upward and closed below the Black 200SMA, ending the week at a position below the 200SMA, indicating no further upside movement.Note that profit-taking did not return to point C, and there are intermediate features such as a larger downward yellow 400SMA or a yellow rising trend line (return move) that may influence future moves.
(Next week, Black④ may be difficult to trade.)
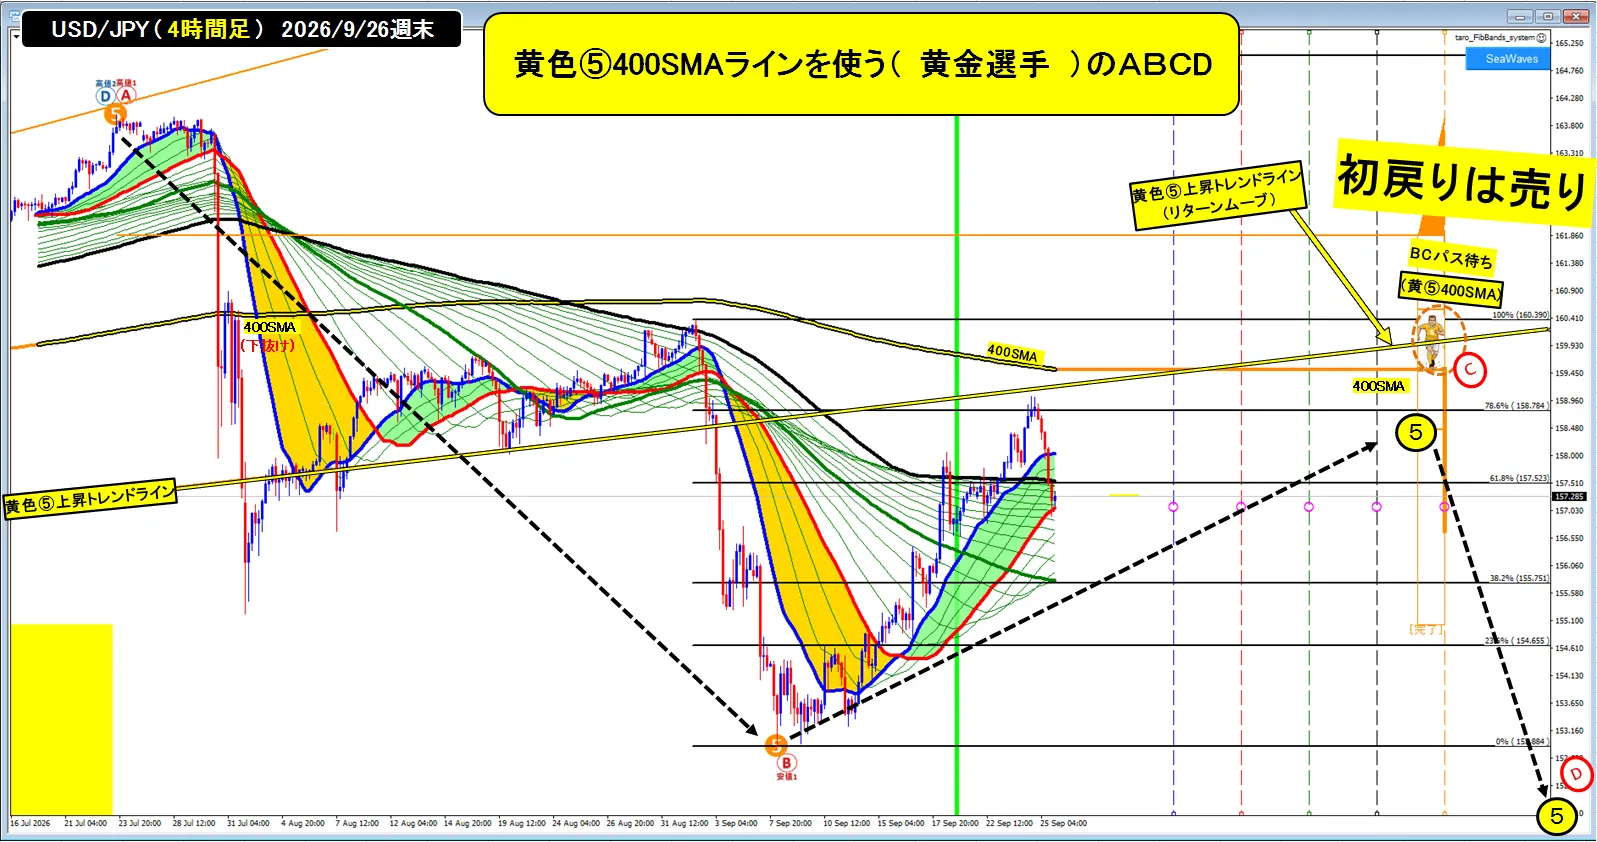
●Yellow⑤ 400SMAis, as shown, after forming point B, moving downward toward yellow 400SMA, with B→C ahead, indicating a return move toward yellow⑤’s upward trend line
(Upward to downward trend transformation is best thought of as creating a downward trend line of equal magnitude beneath the upward trend line; after the yellow⑤ reaches its high near the yellow⑤ 400SMA and then sells with “First Return is Sell,” breaking below B would complete the up-then-down trend, leading to a completed shift.)
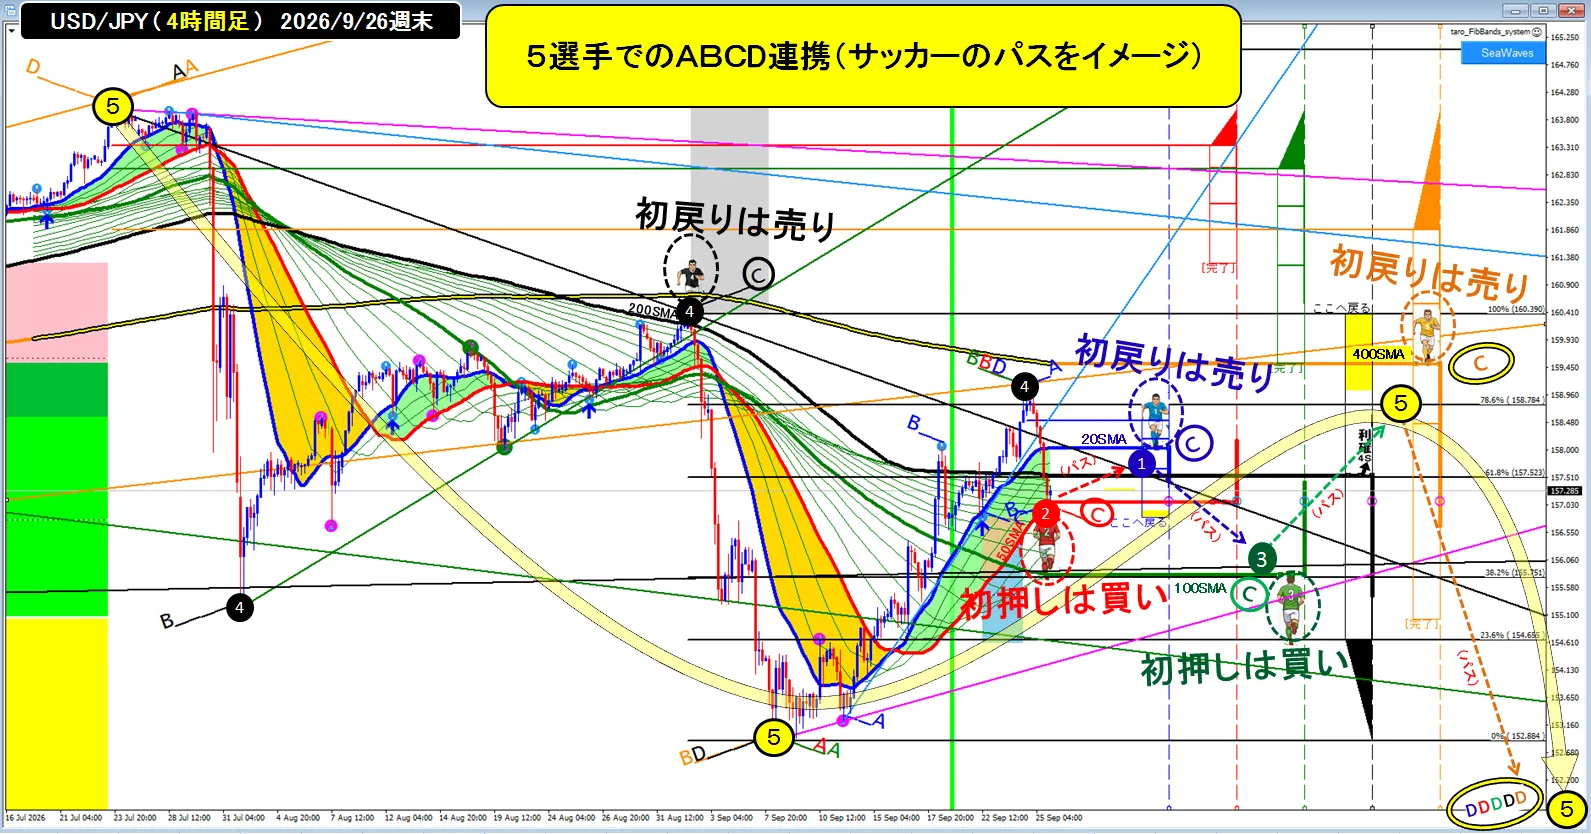
●Finallya chart showing all moving averages simultaneouslyis shown below.Plotting all five moving averages together reveals how they relate and makes the scenery drastically different. This week, the action shows blue① rising to BCD, profit-taking, and blue① declining back to C via AB, reaching red 50SMA at C via BC, and then approaching the weekend with that setup. Looking ahead, since everyone will be waiting at C for the next moves, if we assume everyone commits fully to the idea of “First Push is Buy” and “First Return is Sell,” then
first, in the early week, there will be a red 50SMA buy-through (first push buy), rising to a downward-turning blue 20SMA,
then the blue 20SMA’s “First Return is Sell” retracement will enter, breaking below red 50SMA to around green 100SMA, and
then the green 100SMA’s “First Push is Buy” retrace, entering long near yellow 400SMA, rising toward it,
and finally the yellow 400SMA’s “First Return is Sell” retrace will push a drop below yellow⑤ low, bringing about a rise from yellow⑤ 400SMA to complete the up-then-down trend reversal.
At Chart Point Cwhere thesoccer playeris positioned, if we view the chart as if every Japanese national team member is moving in coordinated action, it becomes evident that black ④ (Kuroda) passes the ball from C to create yellow ⑤ (Hikari) at point B, and from next week on, red ② (Aka) → blue ① (Ao) at C → green ③ (Midori) at C → yellow ⑤ (Hikari) at C, connecting passes in sequence in hopes of achieving the desired result for Japan.
<Finally>
●Simply modeling the five moving averages (20/50/100/200/400 SMA) on the 4-hour chart to capture the traders’ thinking behind “First Push is Buy” and “First Return is Sell” shows how varied their approaches can be.
●In reality, traders use charts spanning different time frames (annual, 3-month, 4-month, monthly through 1-minute, 10-second charts, etc.) and a wide range of moving averages; there are traders who trade with ideas beyond “First Push” or “First Return is Sell,” and price action can be driven by factors beyond traders’ actions. Nonetheless,if you study carefully, you can reasonably grasp each trader’s intentions.