
Chapter 4【Part 1】: Breaking Away from Cover Bands and the Trap of Excessive Optimization
I. The Sea of the Internet and the Limits of the “Copy Band”

2022, early spring.
In the stillness of midnight, a few weeks after forcing MetaEditor to output “Hello World”.
After finishing daytime rounds of sales, I would head to my study's PC desk without looking aside, every day.
However, for a programming beginner, the world of MQL4 is not so sweet that one can code a perfect trading logic from scratch.
The first thing I did, just after learning the syntax, was to gather “free open-source code” publicly available on overseas forums and MQL communities, cut and paste them to forge a single EA.
“If I borrow this EA’s entry function (OnTick) and combine it with that indicator’s判断, then… okay, it runs!”
It was nothing but a copy band—just playing the codes and phrases of a favorite artist exactly as they were.
Other people's RSI reversal code.
Golden cross判定 of moving averages found on the Internet.
textbook-style Bollinger Band reversal.
Connecting them like a patchwork and creating my own “pseudo-original EA,” I proudly started MT4’s “Strategy Tester.”
“Go ahead…! Show me your power on historical data!”
II. The Collapse of a Single Logic — The Limits of RSI —
Click the start button.
Candles on the rapidly advancing past charts. A green asset curve is drawn in real time on the graph tab at the bottom of the screen.
At first, it painted a clean upward trend.
“Alright…! It’s winning!”
But the moment the testing period entered 2020 market data, something changed within the screen.
A trend emerged, and the market began to move strongly in one direction.
【Single RSI logic from the Copy Band era (M5)】
・Conditions: RSI(14) > 70 for a reversal short, < 30 for a reversal long.
・Idea: A very common oscillator reversal aiming for counter-movement from overheating.
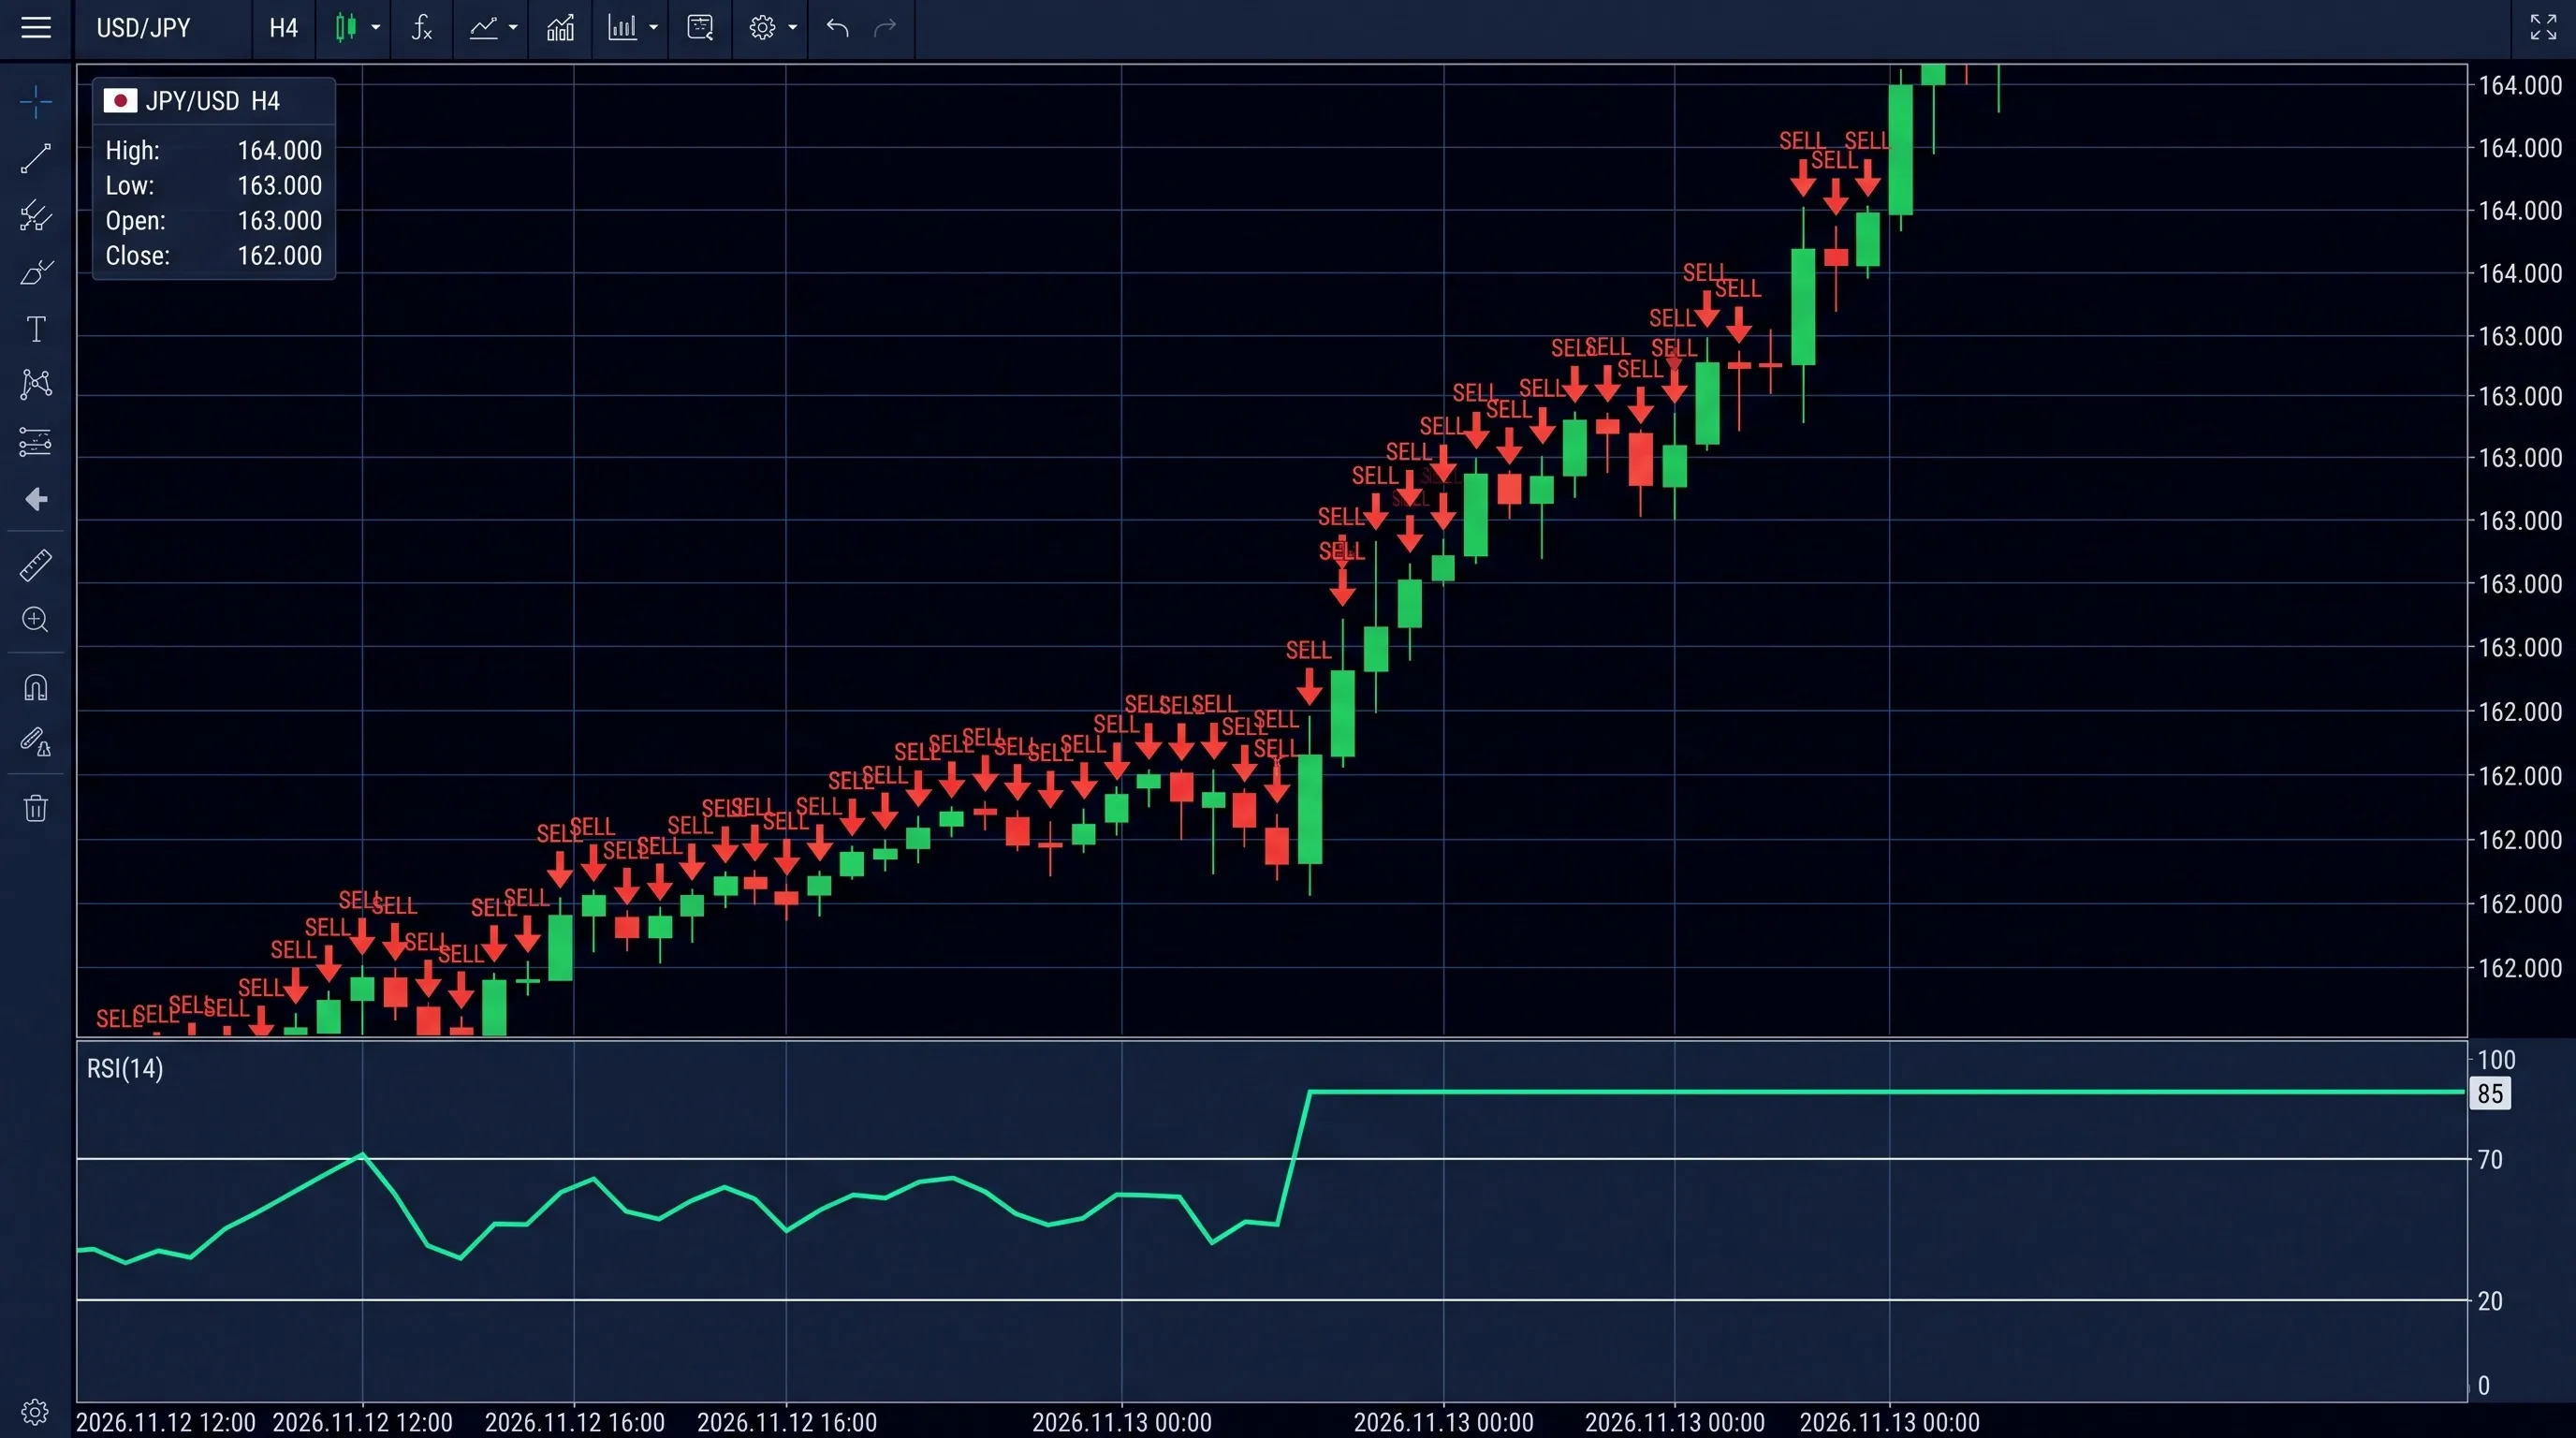
In a strong uptrend, RSI stuck at “70,” “80,” “85” and never fell.
The program obediently followed the blunt instruction “sell when overheated,” repeatedly taking reversal short positions one after another.
And then—.
“Hey, wait…! Why am I still selling in such a strong uptrend?!”
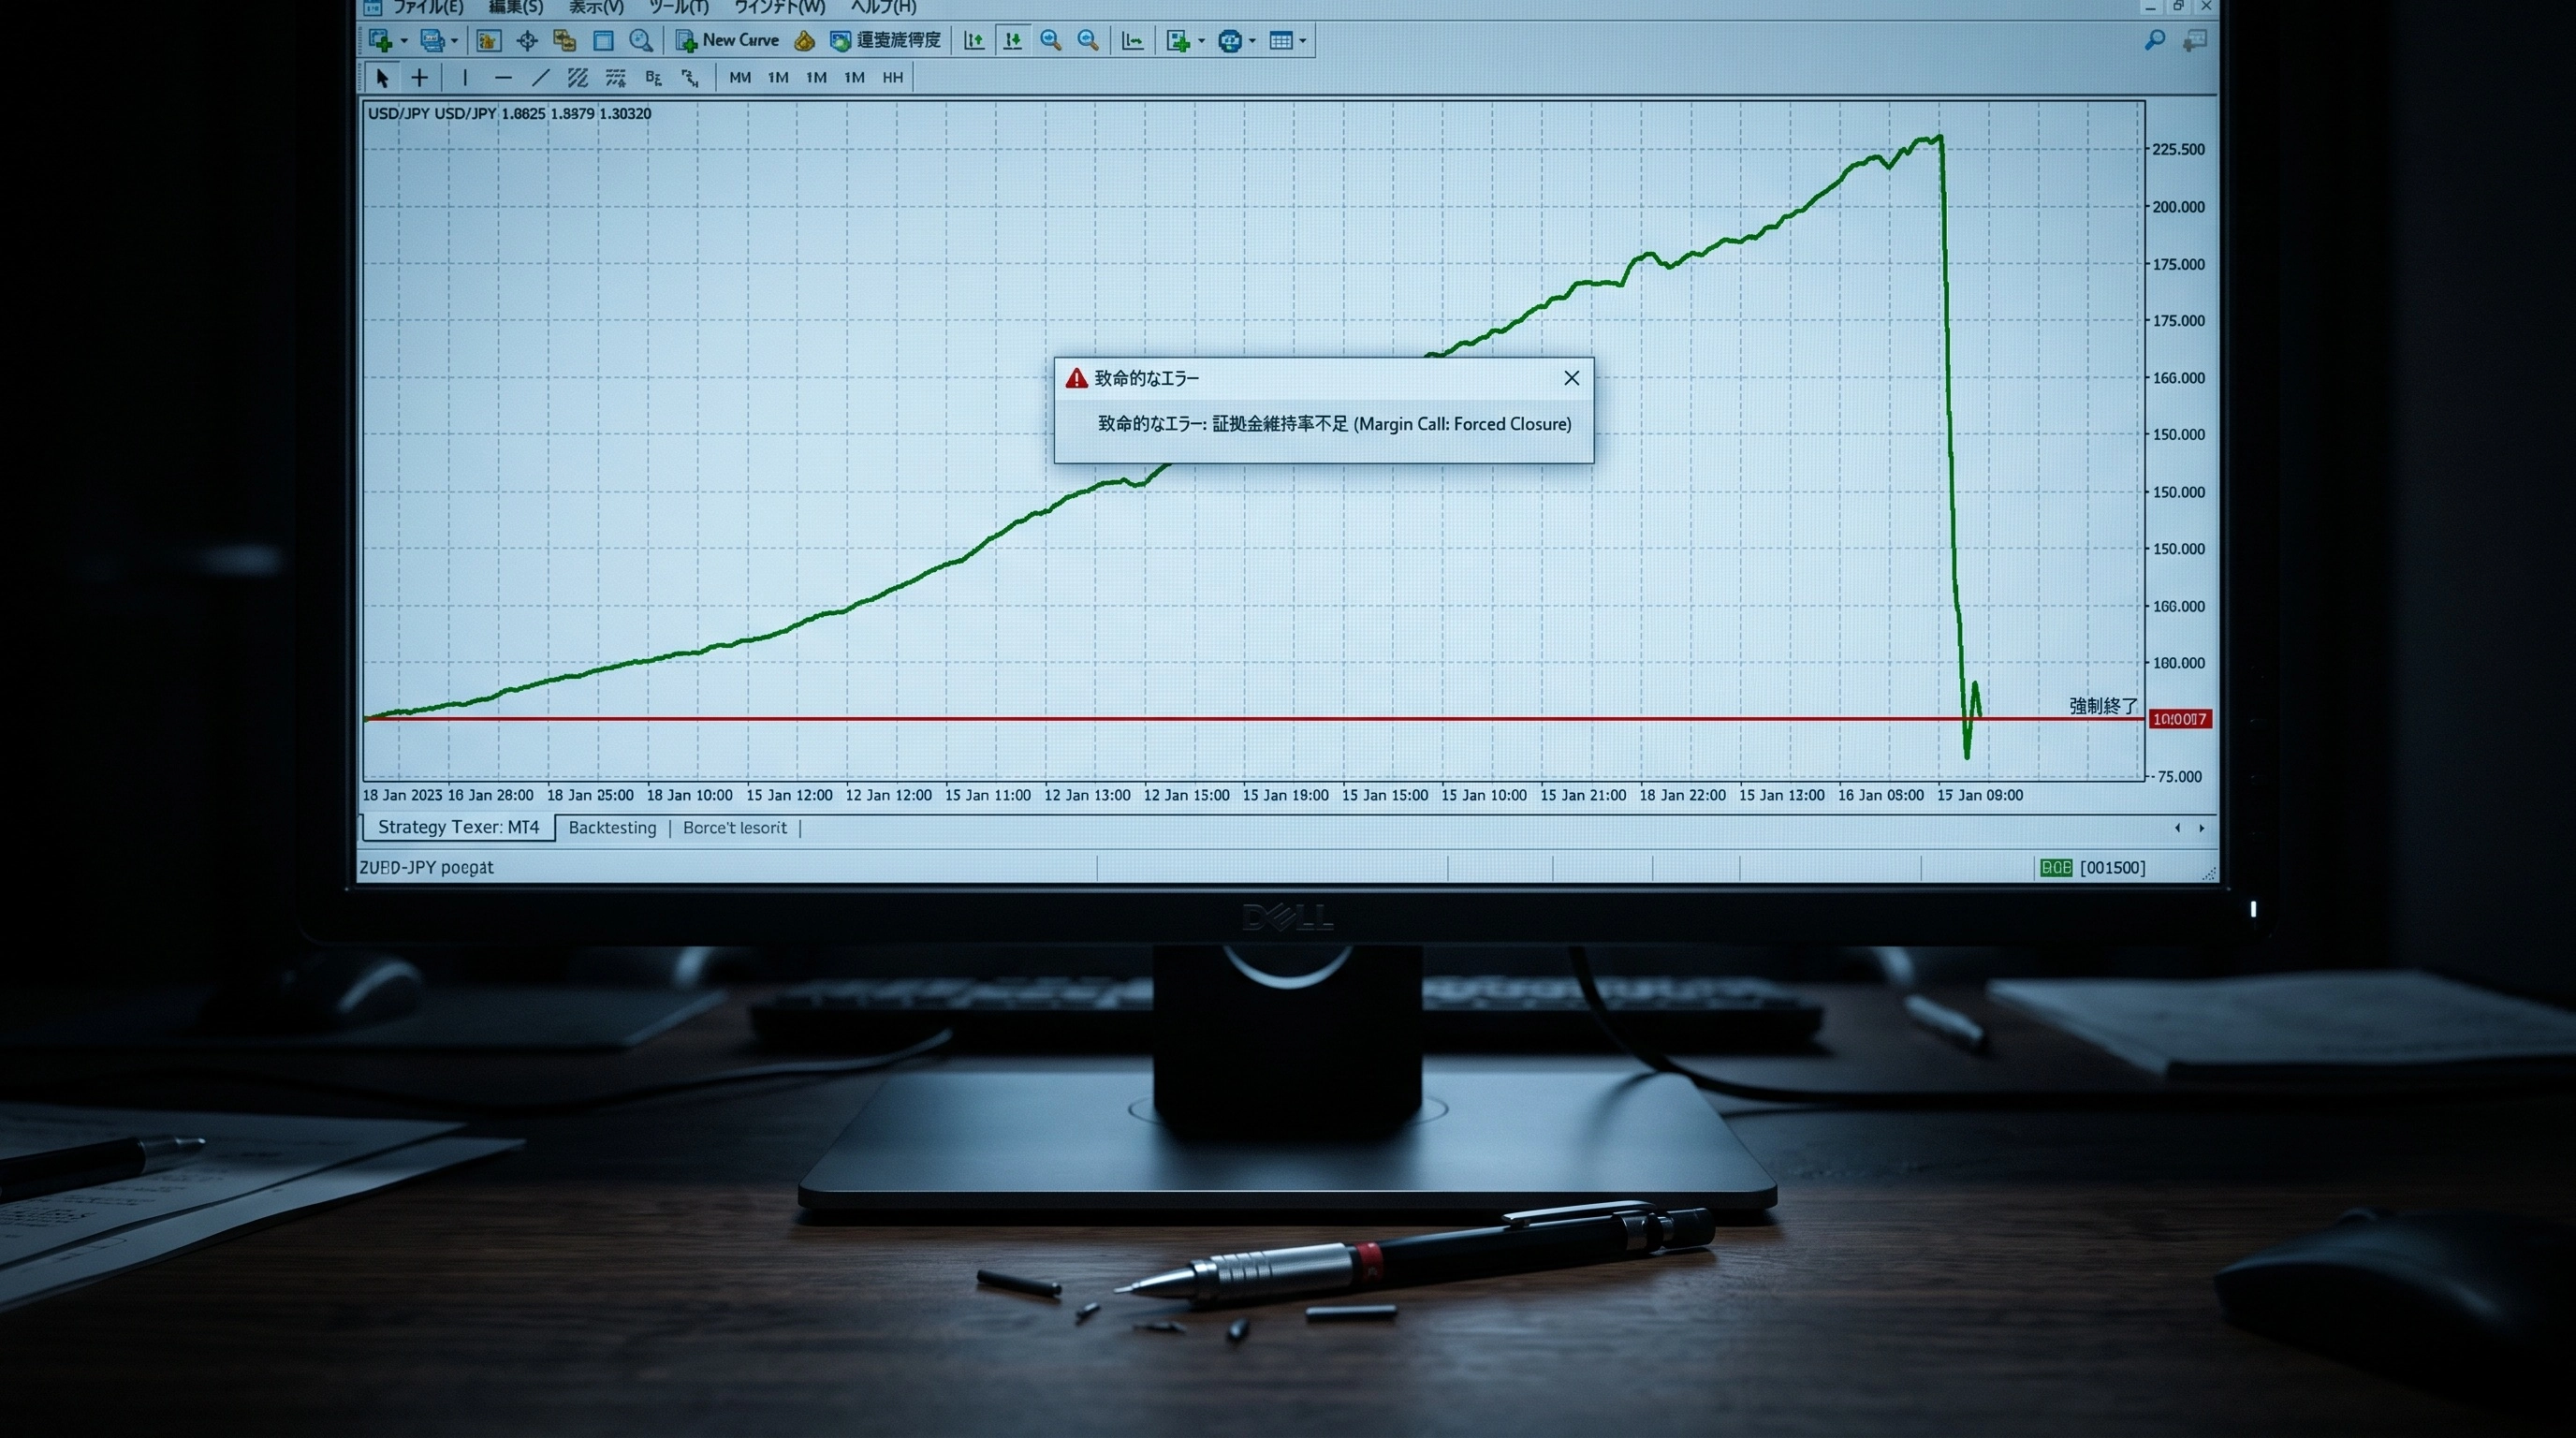
The asset curve on the graph plunged vertically like a roller coaster, and the backtest progress was forcibly stopped.
“Total loss…!?”
I was at a loss.
Common oscillator single-logic found on the Internet may win in ranges, but once a trend occurs, it collapses in an instant.
The market has two opposite faces: “range market” and “trending market.”
Trying to force everything onto a single indicator, a single logic, was a path to ruin in itself.
III. An Advantageous Year and the Sweet Trap of Parameter Tuning

Having parted ways with the copy-band era of collecting free online code, I immersed myself in the gritty development of building my own logic.
Yet, the most terrifyingly sweet trap awaited the developer who had just learned programming.
——Overfitting (curve fitting).
MT4’s Strategy Tester has an “Optimization” feature.
It makes the computer try all possible values for various EA parameters and automatically derives the values that maximize profit and minimize drawdown over the specified testing period.
I selected a relatively calm recent market period, set it in the tester, and kept hitting the optimize button.
“…Amazing! If I tune the parameters to these values, the asset curve will shoot up almost unbelievably!”
If there were losing trades, I tweaked the indicator values by a single step, and if temporary setbacks occurred, I altered the filter values as needed.
I forcibly fitted the numbers into that single calm year like puzzle pieces.
After several days of work, what appeared on the screen was a perfect backtest report for a flawless year.
・Win rate: 96.8%
・Net profit: +8.5 million yen
・Max DD: 3.2%
“Done…! Have I created the real Grail that makes assets rise in a straight line?!”
Staring at the beautiful, steadily rising green line on the screen, my heart pounded with excitement.
I hadn’t yet realized that it was merely a “showcase painting,” a graph painted to fit a very narrow market.