

[Developer's True Feelings] When you open the backtest, the first five numbers you should see — the anatomy of DD, number of trades, PF, win rate, and the validation period
Previously, I wrote about not judging an EA by profit alone.
So when you actually open the backtest screen, where should you look? This time is about that concrete discussion.
When you open the backtest report screen, honestly, I still find myself momentarily drawn to the number labeled "Final Profit."
However, the fingers move from there onward.DD, number of trades, PF, win rate, and the verification period — until you have checked these five things, you cannot deem the EA as "good."
This time, I will discuss these five numbers from a developer's perspective, sharing a realistic view of what I always confirm before evaluating profits on my own EAs or when checking new EAs.
① Maximum Drawdown (DD) — The deepest dip in funds
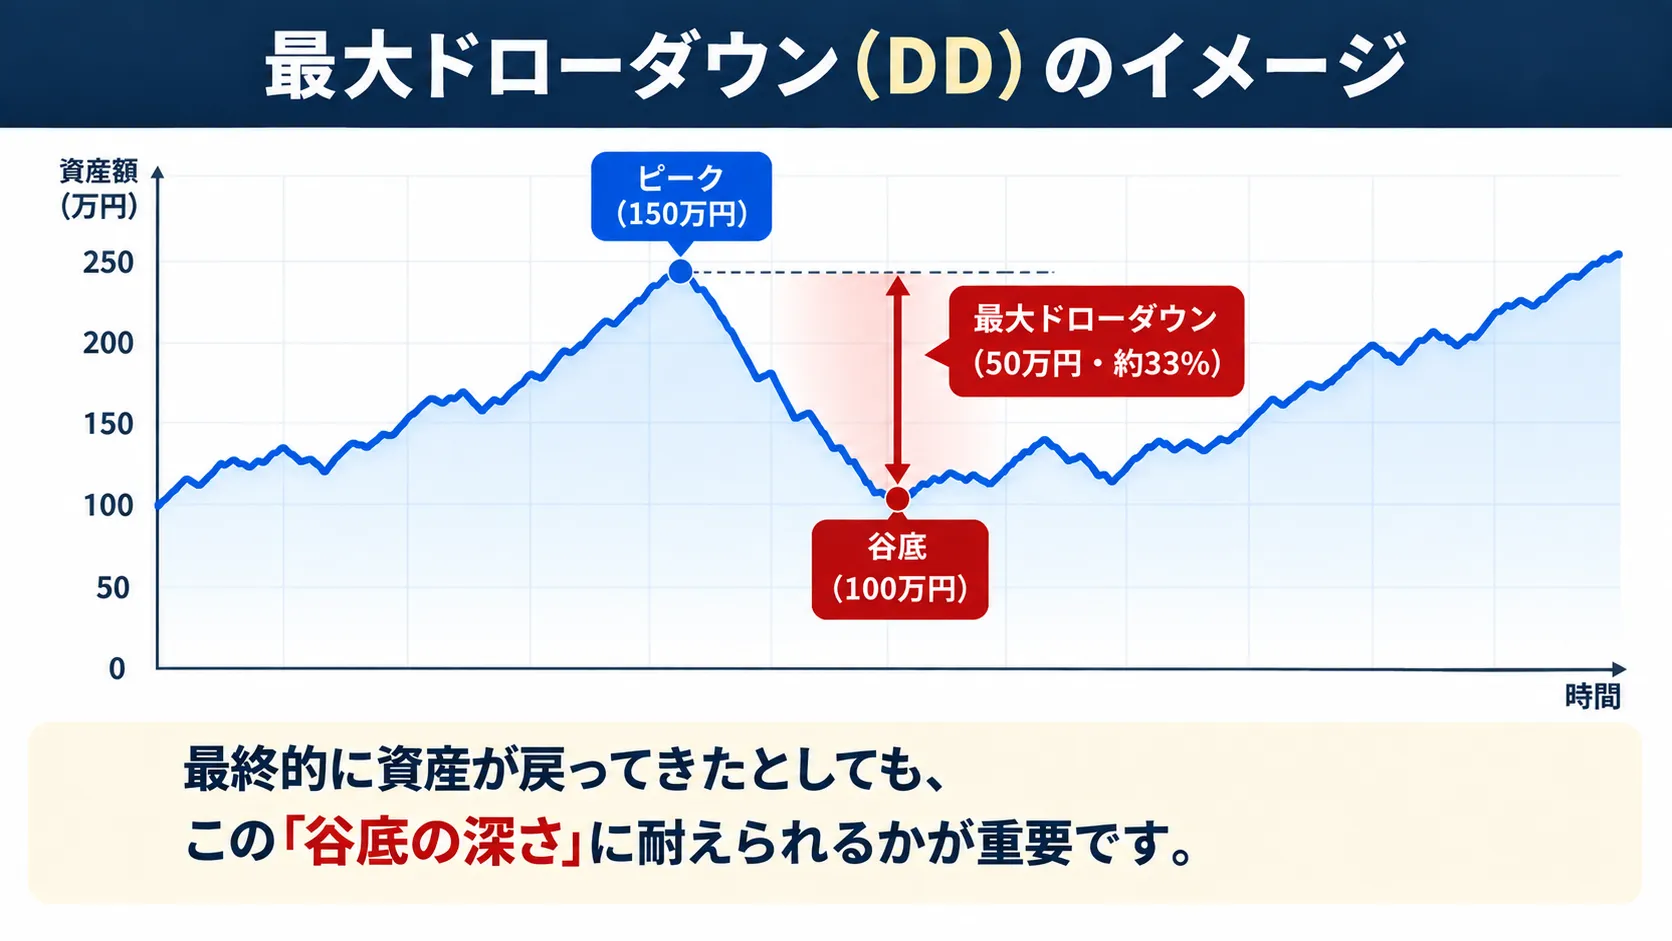
What I look at first is the maximum drawdown (DD). In simple terms, it shows how much the asset declined from its peak during operation.
For example, suppose you started with 1 million yen and ended up with 2 million yen (a +1 million yen gain). That alone seems a big success.
But what if at some point it rose to 1.5 million, then dropped to 1.0 million?
If you only look at the backtest graph, you might think "it recovered in the end, so OK."
In real trading, facing a 500,000 yen unrealized loss or capital decrease can shake your resolve, and few people remain calm enough to endure it.
If you can't stand it, you might manually cut losses or stop trading, and then the market often moves back...
By the way, there are two ways to calculate DD: "balance-based" which uses realized P/L, and "equity-based" which includes unrealized losses as well.
Penny-pinching EA tend to show large divergences between these numbers. The balance may look quiet, but the equity can swing violently.
I pay attention not only to the monetary amount of DD (e.g., xx million yen) but also to the relative DD, i.e., what percentage drop it represents of the account funds.
No matter how profitable an EA is, an EA that causes such a drop that you cannot sleep peacefully at night will not be sustainable for individual investors.
② Number of Trades — Do the data hold up as statistics?
Next, look at the "number of trades."
For example, suppose there is an EA with an outstanding record: win rate 80%, PF 2.5.
At first glance, this looks unbeatable, but what if this result came from only 10 trades over three years?
If 8 out of 10 trades were wins, you cannot rule out chance or luck.
Rolling a die 10 times and getting even numbers eight times does not mean "this die yields even numbers 80% of the time."
In my previous post, I mentioned that "adding conditions makes backtests look clean," but there is another side effect.
The more you narrow the conditions, the fewer trades there are.
If you overly constrain conditions, you can get a perfect-looking graph, but you may end up with an EA that trades only a few times a year.
However, for swing-type strategies with inherently low trading frequency, having few trades is not inherently bad.
In such cases, you simply need to extend the verification period to accumulate a larger sample size.
Honestly, this pattern of "few trades but excellent results" tripped me up a few times when I was starting development.
③ PF (Profit Factor) — Why you should doubt numbers that are too high
The most famous metric for EAs is PF (gross profit ÷ gross loss).
If PF is over 1.0, you’re in net profit, and a higher PF means you’re earning more efficiently.
"PF 1.3–1.5 is often cited as a good benchmark," but this is not an absolute standard.
Backtests occasionally produce abnormal numbers like "PF 5.0" or "PF over 10."
Of course, a high PF is not automatically dangerous.
However, when you see such numbers, you should instinctively suspect that there might be a hidden large unrealized loss somewhere or a bug in the exit rules.
Honestly, I once saw a N-range EA with PF 15 and froze for a moment.
I seriously thought, "This might be a great find."
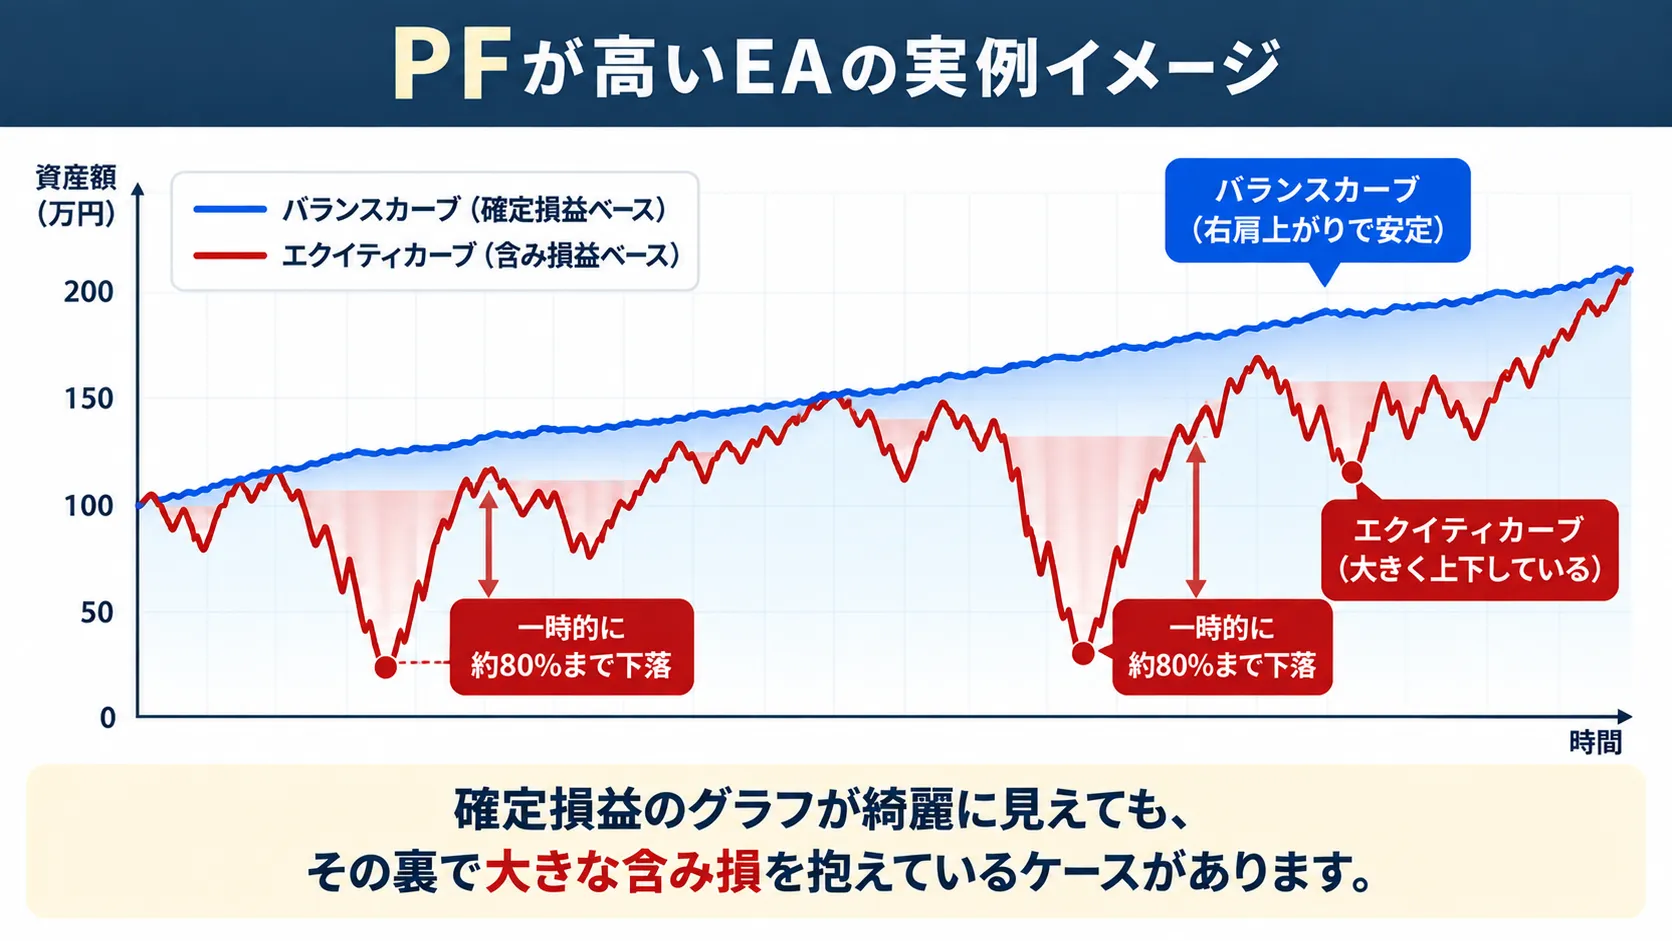
But when I output the equity curve (including unrealized losses) separately to verify,the balance curve showed a clean, rising trend while the equity curve sank to nearly 80% of the account balance multiple times.If you only look at realized P/L, you would have missed this part.
Why does this happen?
The explanation is that the strategy uses a "no cut loss" logic like averaging down or martingale-style, so the total losses become nearly zero in the denominator, causing PF to spike in calculations.
Yet the real profits on the screen may be hiding huge unrealized losses underneath.
When evaluating PF, what matters more is not the number itself but how that number was produced—since I saw that particular averaging-down EA, this has stuck with me.
④ Win Rate — "90% win rate" and "money growth" are not the same
Personally, I feel that beginners are most easily misled by win rate.
Hearing "win rate 90%" sounds very strong, but win rate is simply the proportion of winning trades, not how much money remains after trades.
- Pattern A (win rate 90%): 9 small wins totaling +90,000 yen, but one loss of -200,000 yen. => Net -110,000 yen
- Pattern B (win rate 40%): 6 losses totaling -60,000 yen, but 4 wins totaling +200,000 yen. => Net +140,000 yen
An extreme example, but this is the essence of trading. A high-win-rate EA might be designed with "big losses wiping out profits" or risk-reward imbalance.
Only by looking at the balance between average profit and average loss can you understand the meaning of win rate.
⑤ Verification Period — dissect three years of results into pieces
Lastly, the deeper look at the verification period.
For example, suppose backtest results show +2,000,000 yen over the past three years.
It may look upward-trending at first glance, but when you break the data down by year, you may see a completely different picture.
2024: +100,000 yen 2025: +100,000 yen 2026: +1,800,000 yen
In this case, it’s more likely that you didn’t earn over three years, but you hit an abnormal market environment in a specific few months of 2026.
It’s like a player who is usually a substitute but hits a miraculous grand slam once to raise batting average.
Furthermore, if you separate BUY and SELL results, you may discover that you heavily lost on sell trades, while buy trades riding a strong uptrend masked that loss.
This task is fairly dull: break data by year, by month, by buy/sell to verify performance across different market conditions.
It’s not flashy, but neglecting this has caused me to pay the price in the past.
Numbers are seen as a 3D landscape, not a point
If it were my old self, I would have jumped on PF 3.0 alone.
Now I look at how many trades produced that number, what kind of stop-loss rules generated it, and whether it depends on only a particular market.
Only after considering these aspects do I think, “this EA might be good.”
DD, number of trades, PF, win rate, and verification period do not hold meaning by themselves. Only in combination do you see the true nature of the EA.
In conclusion (next time preview)
Actually, I once faced a painful lesson with an EA that cleared all five criteria. I plan to write about that next time.