
How to attack? Japan has Silver Week. But the moves are big.
2026 Latest Edition!!
You can watch the interview VTR with CEO Hayakawa of Gogojan and me here
This is an announcement of a new product!!
↓↓↓

By the way, knowing this method
New Billionaire Trader's Scalping: Volume Plus
FX trading like no ordinary pair trading
If you work on this, my article in Investment Navigator every day about reversal moments will become clearer in your mind and you can devote yourself to trading.
Good evening, everyone.
The USD/JPY price range up to today is about 1 yen.
Considering it’s a holiday Monday, I think it’s moving.
As for volatility, it’s a bit subtle.
But this creeping movement often happens after a holiday or after a big move, where it goes the opposite direction.
Remember that this is common, and when that day comes, picture scenarios with support/resistance flipping and be mindful of the Billionaire Trader lines.
My trading is short-term, about an hour from scalping.
Rather than predicting price moves days ahead, I forecast moves over minutes to about an hour, so there are misses, but as you get used to it, the direction becomes more reliable.
When you stop making mistakes, use the “Billionaire Trader Line” as a base to catch breakouts and pullbacks, turning them into profitable trades.
If you look at the Billionaire Trader chart, you won’t often be wrong about up or down, so focus on the reversal points I always mention and trade using the Billionaire Trader Chart and Billionaire Trader Range.
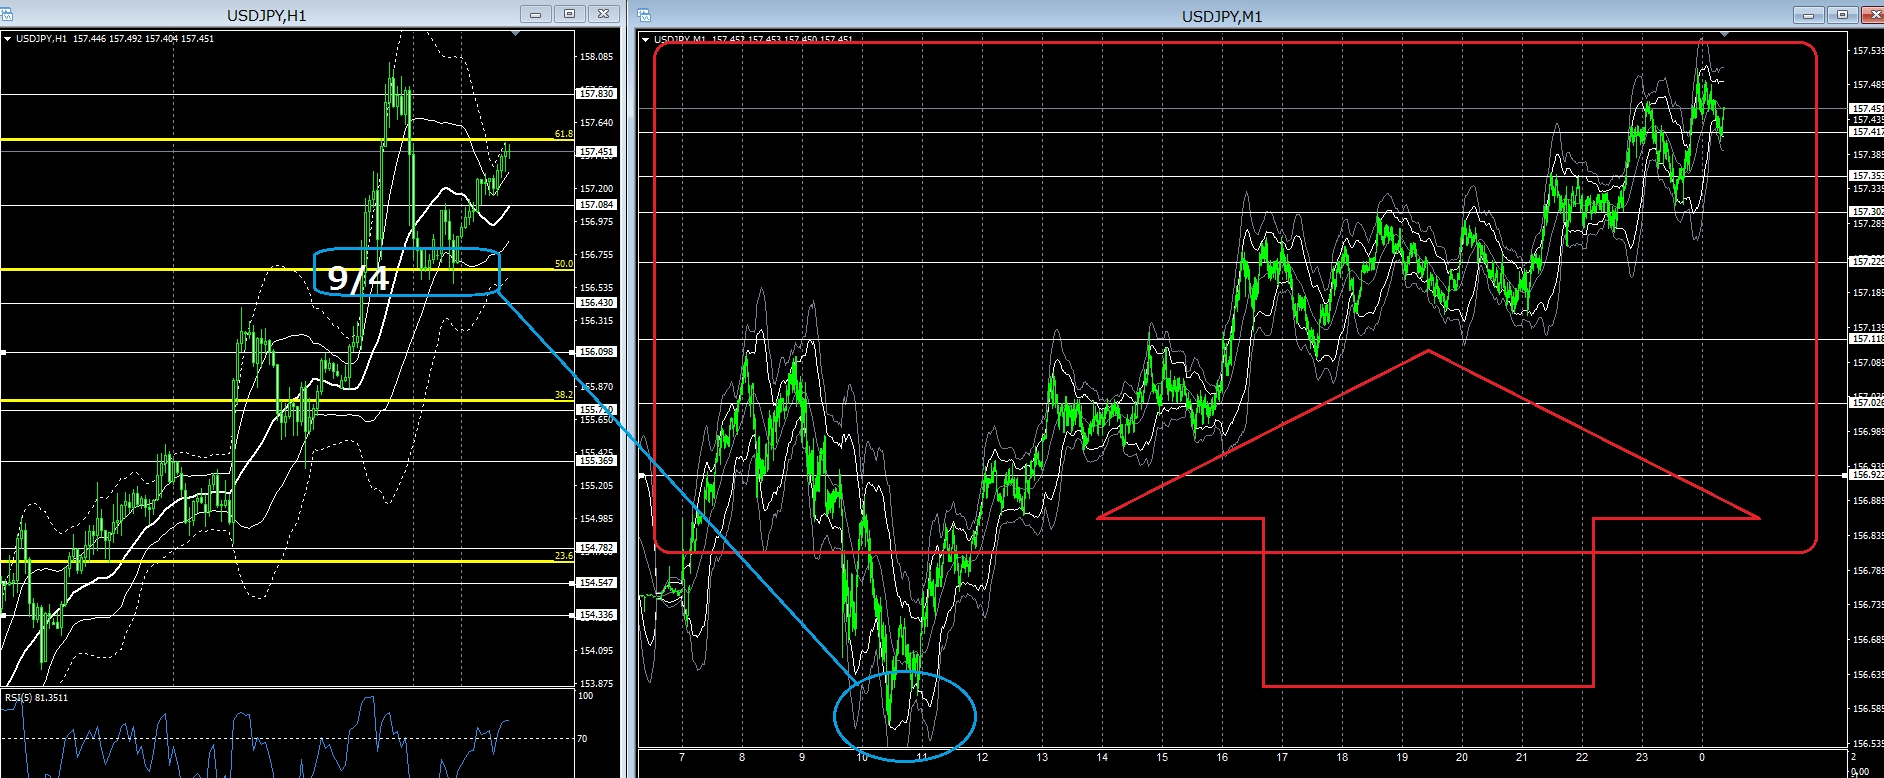
Today’s USD/JPY 1-hour and 1-minute chart
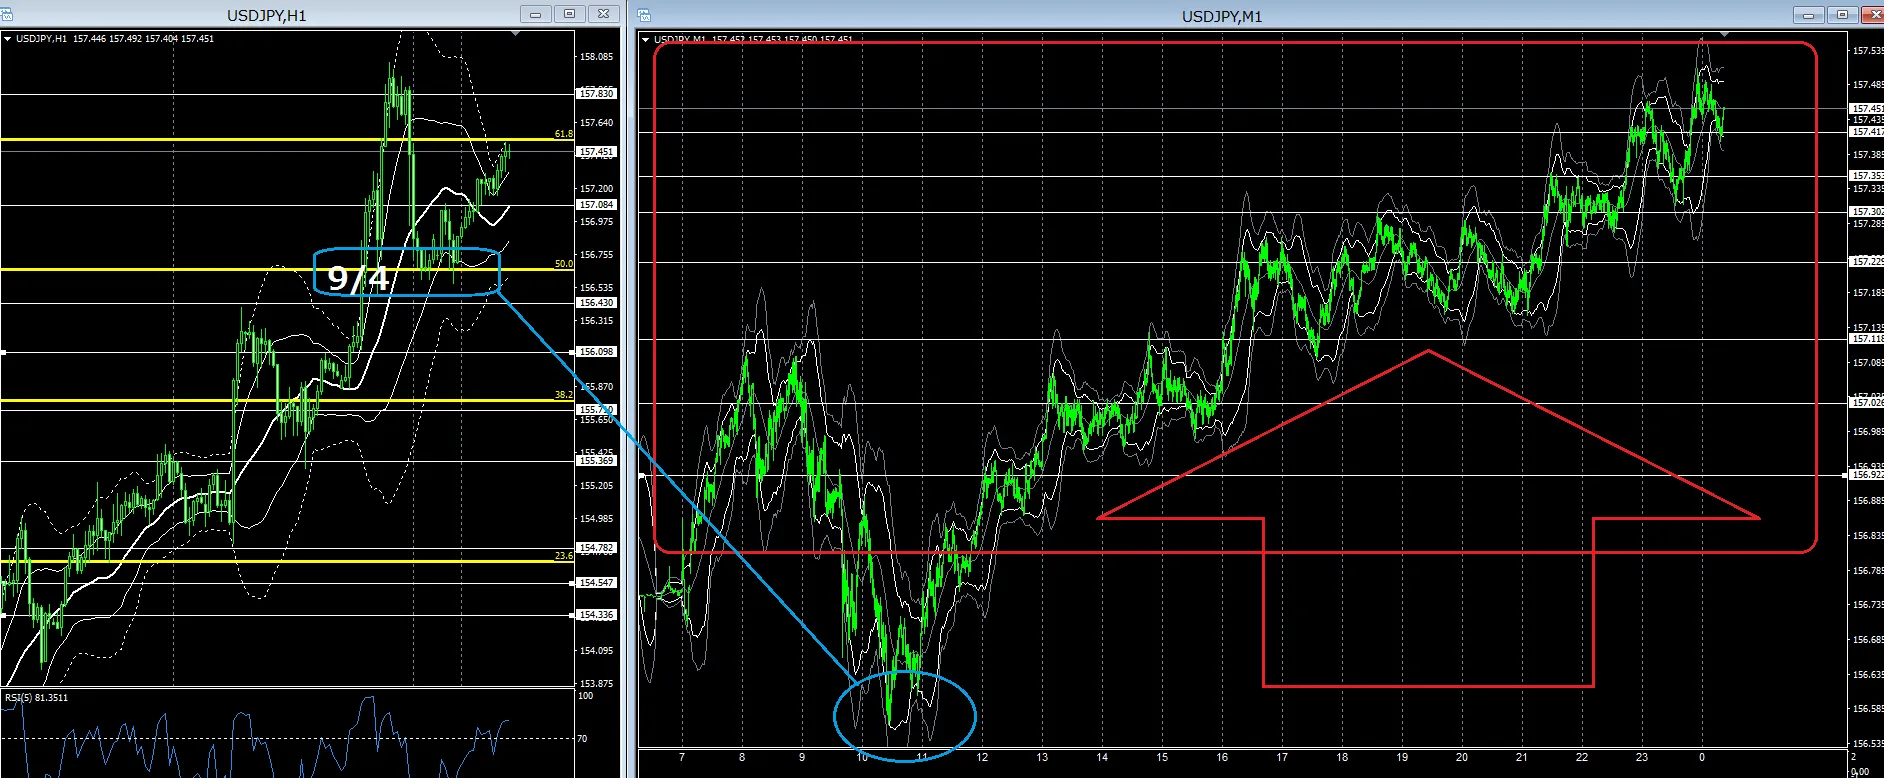
The blue □ in the 1-hour chart marks a price area where support and resistance have swapped.
If you go back one hour, compare September 4 with today, and the answer becomes clear.
Looking at that moment on a 1-minute chart, it turned after hitting the low following Tokyo’s open this morning.
That is the blue circle area.
While this is happening, the Billionaire Trader Chart gives a sell-to-buy reversal signal.
The white multiple horizontal lines indicate the long Billionaire Trader Line.
From just after 12 o’clock, the standard trade is to follow volume from this Billionaire Trader Line and take an L position, but today volatility was low, so it’s rare to have clearly visible volume.
In such a case, you can aim for a breakout where the most recent high overlaps with the Billionaire Trader Line, or take a position that breaks below the Billionaire Trader Line to lock in profits.
Positions using the Billionaire Trader Line
・Breakout
・Pullback/Retest
There are only two options, so if you’re unsure, pick one, and if you’re feeling aggressive, do both and main whichever one performs better, trading with your intuition.
I took a breakout L position after 1 p.m., but it pulled back too much and I cut, then immediately re-entered the L position, setting a stop around 1,5692, and waited, and luckily in the 1 p.m. period it surpassed the high and I booked profit, turning positive.
After 4 p.m., I aimed for the breakout around 1,5709 where a buildup was forming, went long, and booked profit within a few minutes.
I entered a few long positions around 1,5728 during the NY session as the range-bound price moved, then finished for the day.
Today, I had several instances of nearly breaching with no loss instead of taking a loss.
In the end, I didn’t need to re-enter, but if the pullback is deep, you can turn red, so I stayed cautious and traded in small increments.
In the 1-hour chart, it looks like it’s aiming for the recent high, so if the US-Japan rate hikes lead to further USD/JPY weakness, it might easily exceed the recent high?
That could be the case.
Tomorrow is also a holiday, and Japan has no data, so the market may drift higher slowly.
Today as well, thank you for your support.
If you are a trader who wants to succeed in trading or make a living from trading, this is the product I recommend, and it’s something you can learn on your own: this trading technique is here below
You can verify the trade histories of the super traders and the FX methods that were discovered