

Line analysis points and tips 【Line Analysis Basic Course #9】
Hello! This is SAKU!
From the previousWe have explained the basics of line analysis—horizontal lines, trend lines, and channels. This time, I would like to write about tips for the key points and potential tricky parts in line analysis!
The Role of Line Analysis
Linesare simply tools to capture price movement and to make the progression of buying/selling interest easier to understand. It is dangerous to think that a price will necessarily rebound just because it reached a line, or to enter solely on the basis that a line was reached..
Look at the line as a turning point, and watch for any movement that might occur,and act based on the fact of price movement (that the line is being watched) and the subsequent price action and expectations.Keep this in mind.
What matters more is how the price reacts to that line, rather than drawing the line itself.
Lines can be powerful tools, but they are not万能. Don’t overtrust them.
Possible Movements Near Lines
Movements that can be expected near a line include breaking the line, a false breakout, a rebound from the line, and range-bound behavior near the line, among others.
It resembles the diagram below.
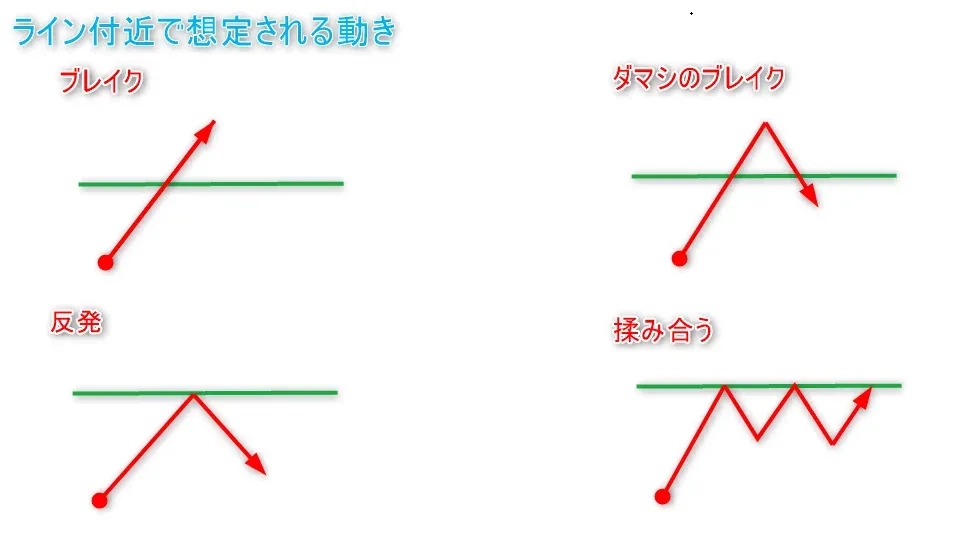
The figure is explained with a horizontal line, but similar movements are expected with other lines!
Let’s Follow the Trend
Trend following (entering in the direction of the trend)is fundamental.
During an uptrend, generally buy. During a downtrend, generally sell. Avoid meaningless counter-trend moves.
You should also clearly grasp the trend on higher timeframes..
Common Sense in Line Analysis
・I'm unsure where to draw the line
There is no single correct place to draw a line; people draw lines in various places, butdraw with your own intent (the price movement you want to capture, the justification, the expectations, etc.)in mind.
For example, if you draw a line at a support low, be mindful that it is meant as an indication of trend end or continuation.
It might be helpful to color-code the lines or distinguish solid and dashed lines depending on where you drew them.
Also, after entering, if the market deviates from your initial expectation,boldly cut lossesand move on.
・Lines become so many that the chart looks dirty
Drawing too many lines can make the chart hard to read and obscure the movements you actually want to see, causing you to lose sight of your original plan.
For horizontals, it’s good to draw roughly two or three lines above and below the current price movement.
Make appropriate adjustments, additions, or removals to avoid a messy chart.
・I want to extend the horizontal line only to the right, not across the entire screen
In MT4 and MT5, you can draw a line using a trend line that extends only to the right.
Adjust the trend line to be horizontal and draw from the high/low price levels.
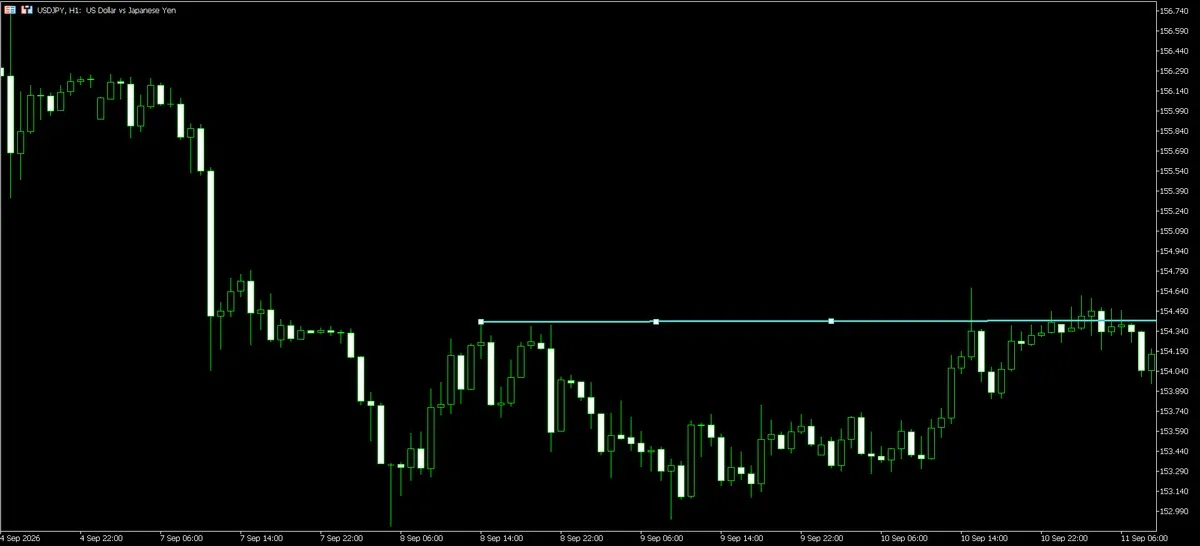
By the way, I often draw horizontals at the current pullback low or return high using this method.
This makes it easier to identify which high/low is the current pullback low or return high.
・I enter on a line break and get lot of false signals
Beginners tend to enter on a break, i.e., breakout entries, but to be blunt, that’s difficult.
You need to understand the context leading up to the breakout; without it, you’ll jump in prematurely and get hit by many false breakouts.
Initially, a recommended strategy is breakout → wait for a return move → enter expecting a rebound (the so-called roll reversal method).
Enter after confirming the trade has been resolved.That’s the idea.
Waiting for a good chanceis also a valid strategy.
Rest the market, sell, buy, rest again.
Also, please refer to thisarticle on judging line breaksas well!
So, this time I wrote about the points and tips of line analysis!
This applies not only to horizontals but to line analysis in general, so please revisit this article from time to time!
If you found this article helpful, please give it a like or a♡; it encourages me!
For those who want to learn more practical and advanced line analysis from the basics, click here
→MTF Multi-Time Frame Analysis: The Key (A free trial version is also available)

【Limited-time opening campaign】 MMS Trading Encyclopedia— The truth behind the "structural traps" that individual investors fall into and market microstructure analysis of the footprints of large players — (A free trial version is also available)