
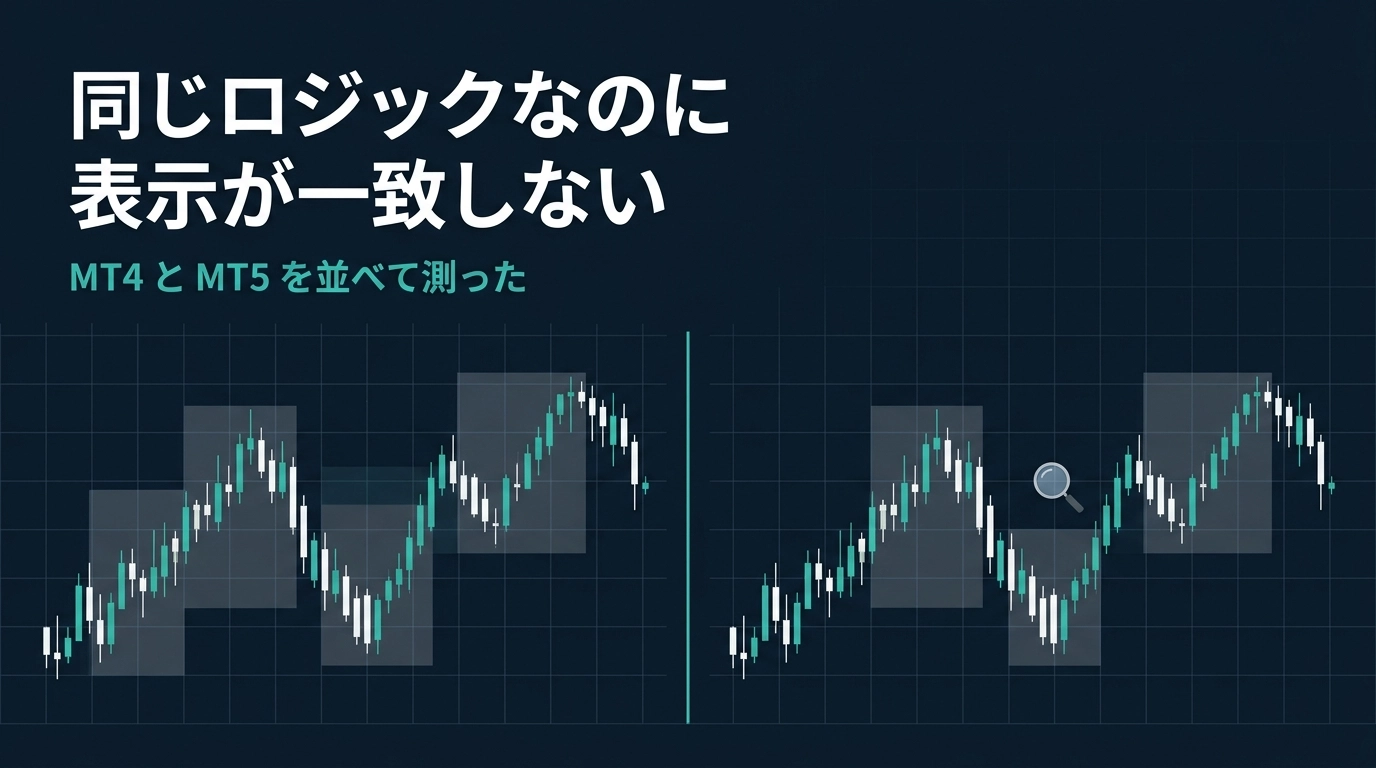
When I moved an MT4 indicator to MT5, the display was different — why it doesn't match despite using the same logic, and its actual measured data
Hello. I’m lab.aiueo, developing MT4/MT5 indicators.
When porting my self-made indicators from MT4 to MT5, even with the same instrument and the same timeframe, the display did not match, and I burned half a day.
Once I understood the cause, it was simple, but if you don’t know, you might think you failed the porting.
This is a useful story for anyone moving to MT5, so I’ll share the measured data as well.
MT4 ends
The end of MT4 provision by domestic brokers is progressing as part of a real schedule.
- JFX … service ends on August 19, 2026
- OANDA Securities … service ends with the trading end on November 27, 2026
In overseas brokers, MT4 is still usable, and it doesn’t disappear all at once.
However, we have moved from “someday” to a stage of considering “when to move.”
So the issue becomes what to do with the tools you are currently using.
Ported, lined up, and fixed
I ported my own SMC indicator to MT5.
I did not modify the judgment logic at all; I only replaced MT4-specific phrasing with MT5 equivalents.
Once finished, I lined MT4 and MT5 side by side to display the same instrument and the same timeframe.
The display differed.
The number of zones differed.
The positions were slightly offset.
A block that exists on one side did not exist on the other.
I reviewed the code for half a day.
To start with, the porting itself wasn’t wrong.
The cause is “looking at a different server”
Even with the same broker, MT4 and MT5 receive prices from different servers.
For example, with 〇〇〇〇〇 FX, the data storage destinations were as follows.
・MT4 …〇〇〇〇〇FX-02/〇〇〇〇〇FX-05・MT5 …〇〇〇〇〇FX-MT5-01
They are different entities.
Additionally, MT5 actually retains real ticks, whereas MT4 builds higher timeframes from the 1-minute bars.
This difference also exists.
As a result, even the same candle at the same timestamp can have slightly different high and low prices.
How different, counted
Since merely guessing wouldn’t help, I wrote out the same items from both and cross-checked. This is for GBPUSD H1.
| Item | MT4 | MT5 |
|---|---|---|
| Parameter settings | Match | Match |
| Candle times | Match | Match |
| Swing detection count | 22 | 22 |
| Structure (BOS/CHoCH) | 6 | 6 |
| Order Block | 6 | 6 |
| Breaker Block | 2 | 2 |
The framework all matched. Then where did it differ? It was in the price itself.
When comparing the 134 prices that appeared on both sides, 16 of them (about 12%) had discrepancies.
Low   MT4=1.35195   MT5=1.35153   ← 4.2 pips
High  MT4=1.34778   MT5=1.34794   ← 1.6 pips
High  MT4=1.34657   MT5=1.34658   ← 0.1 pips
Most of the discrepancies are 0.1 pip, a 1-point difference in 5-digit pricing.
I also measured another instrument and timeframe (USDCHF H4). Of 140 common points, 12 points (8.6%) differed, with a maximum of 2.8 pips.
Why 0.1 pip can look very different
You might think this is just a rounding error. However, most SMC-type judgments are made by threshold comparisons.
Did the high exceed the swing high?
Did the close exceed the most recent high plus a buffer?
Whether it was exceeded or not. True or false. A 0.1 pip difference can flip this answer.
And reversals cascade. If one structure break increases, the preceding candle is registered as an Order Block. If that OB is later negated, it becomes a Breaker Block. The one-point difference at the entrance translates to a visible difference of “one more zone appears/disappears” at the exit.
This cannot be fixed. And it isn’t something to fix
Since the cause lies in price data itself, there is nothing the indicator side can or should do. Each platform simply calculates correctly from prices received on its own servers.
This isn’t limited to my product. Any indicator that makes judgments based on thresholds shares this property. People using both MT4 and MT5 should know this premise to reduce unnecessary worry.
What this article’s product does not do
Let me say this first.
It does not provide trading signals. Entry arrows are not displayed.
Win rate or backtest results are not shown or promoted. There are no numbers on this page or product page.
It is a tool to assist analysis for drawing SMC elements. The decision of where to enter is up to the user.
What I will answer next
Up to here, these are the prerequisites you should know when moving to MT5. From here, I’ll describe the contents of the ported product SMC-Radar for MT5.
- What appears on screen (list of judgment terms)
- How the drawn zones are automatically cleared
- What alerts inform and how
- Practical usage steps
- Environment and price
- During porting verification, a pre-existing MT4 bug was found
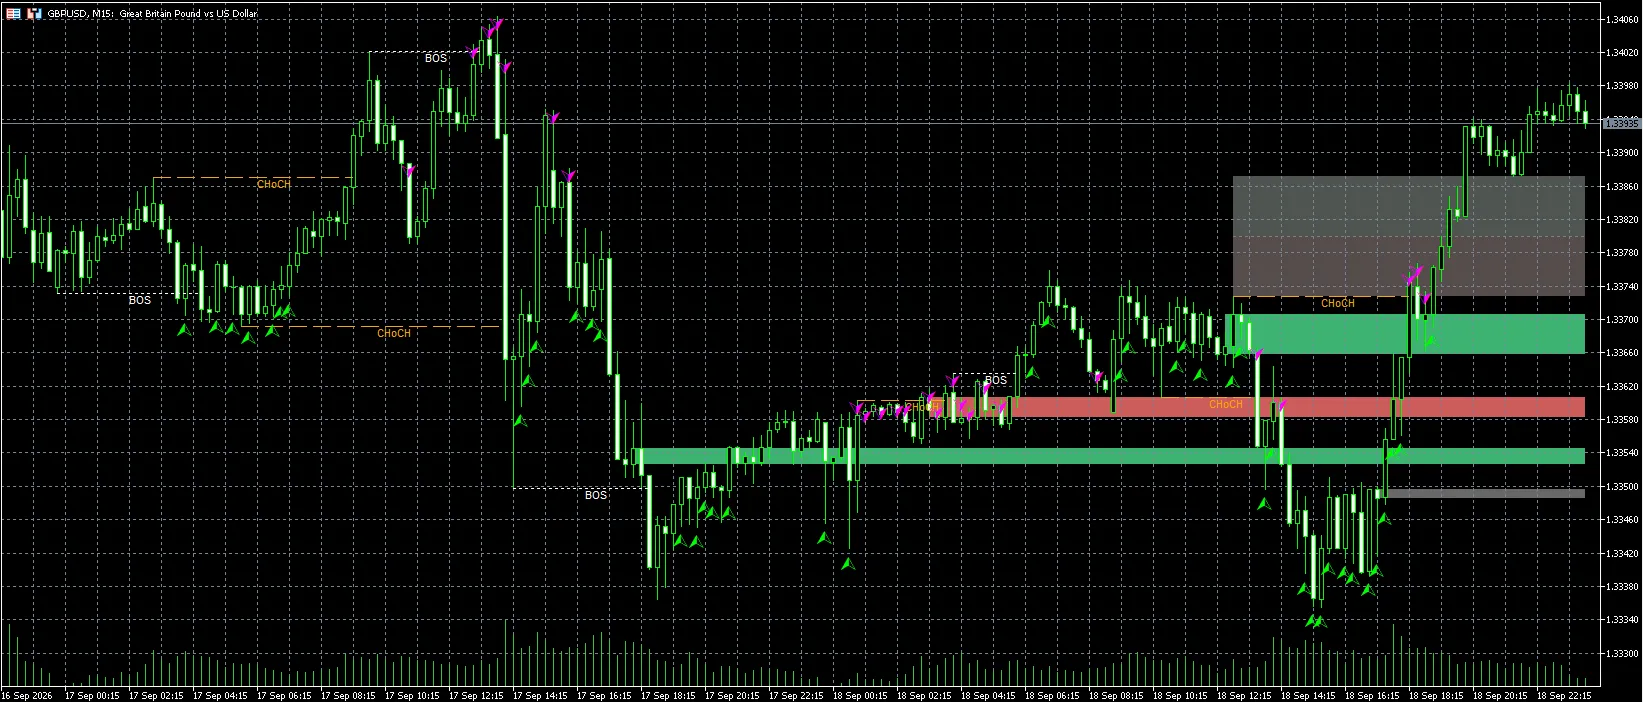
SMC-Radar for MT5 contents
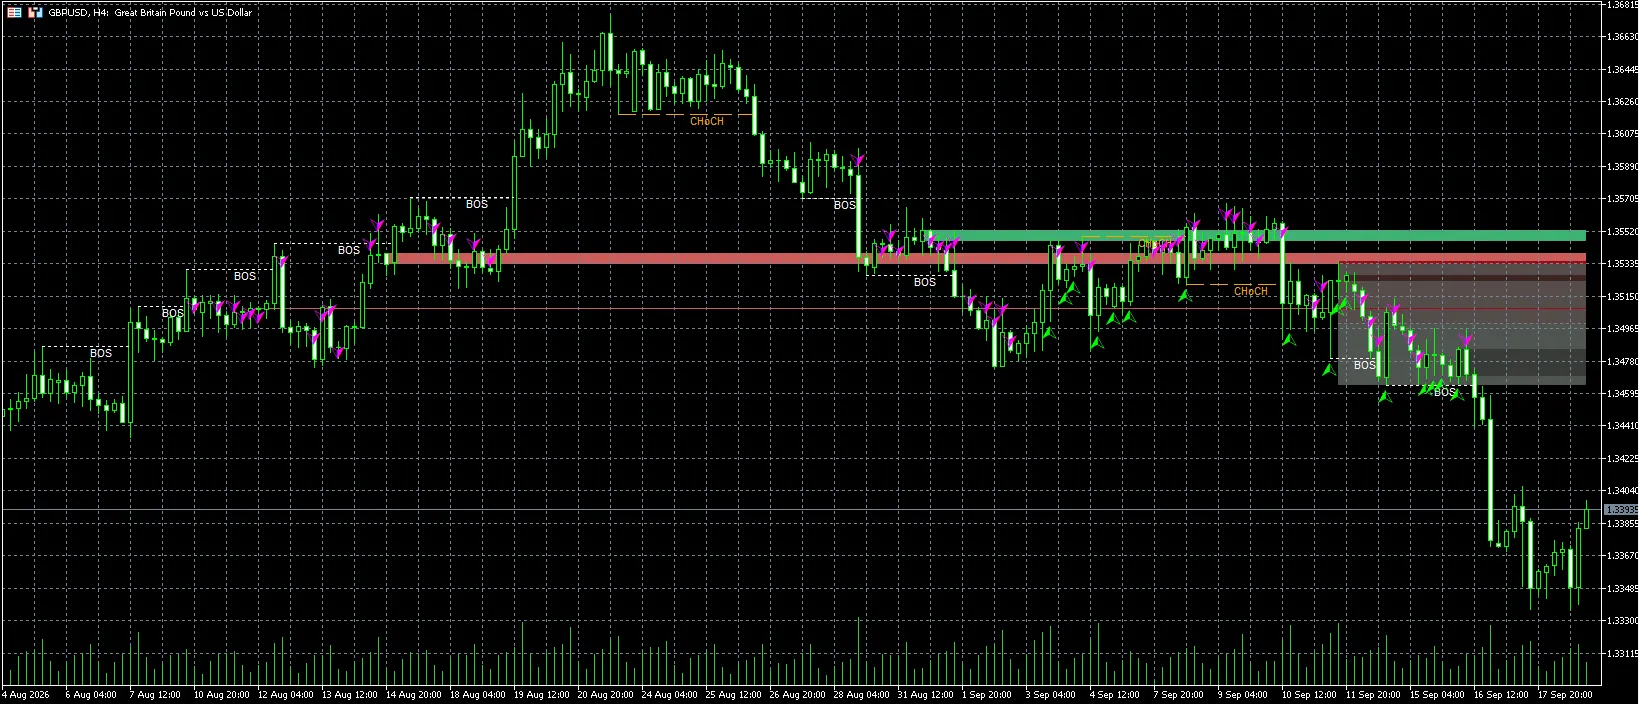
Just by placing it on a chart, it automatically draws the six main SMC elements continuously. You don’t need to draw lines manually. Changing timeframes doesn’t require redrawing.
What appears on screen
| Display | Official name | Meaning |
|---|---|---|
| BOS | Break of Structure | Exceeded the most recent high/low with the close. Signal of trend continuation |
| CHoCH | Change of Character | A structure break in the opposite direction. Sign of reversal |
| OB | Order Block | The last foot in the opposite direction just before the break. Price zone where orders concentrated |
| FVG | Fair Value Gap | Price gap region formed across three candles |
| Breaker | Breaker Block | An OB that negated acts as a reversal band in the opposite direction |
| Premium / Discount | ― | Upper half of the recent range is overbought, lower half is oversold |
| Sweep | Liquidity Sweep | A move that temporarily breaks highs/lows and then returns. Liquidity hunt |
Drawing it isn’t the end
I believe the most effective aspect of this product is actually cleaning up after drawing, rather than the drawing itself.
If you draw SMC by hand, the chart becomes cluttered. Zones that are no longer valid keep lingering, and you can’t tell which ones are active.
SMC-Radar continuously updates the drawn zones to match price movement.
| State | Appearance | Meaning |
|---|---|---|
| Active | Specified color (blue/red, etc.) | Zones that are alive but price has not reached yet |
| Reached | Dark gray | Price reached the center. Priority decreases after reaction |
| Disabled | Removed (default) / light gray | Close price pierced, evidence negated |
By default, negated zones disappear from the screen.
In other words, what remains on the chart is the current supporting evidence. “Nothing displayed = skip moment” is a valid interpretation.
An Order Block pierced at the close doesn’t simply disappear; it is re-registered as a Breaker Block in the opposite direction. The support belt becomes a resistance belt, and you can apply the concept as-is.
No need to pin to the chart
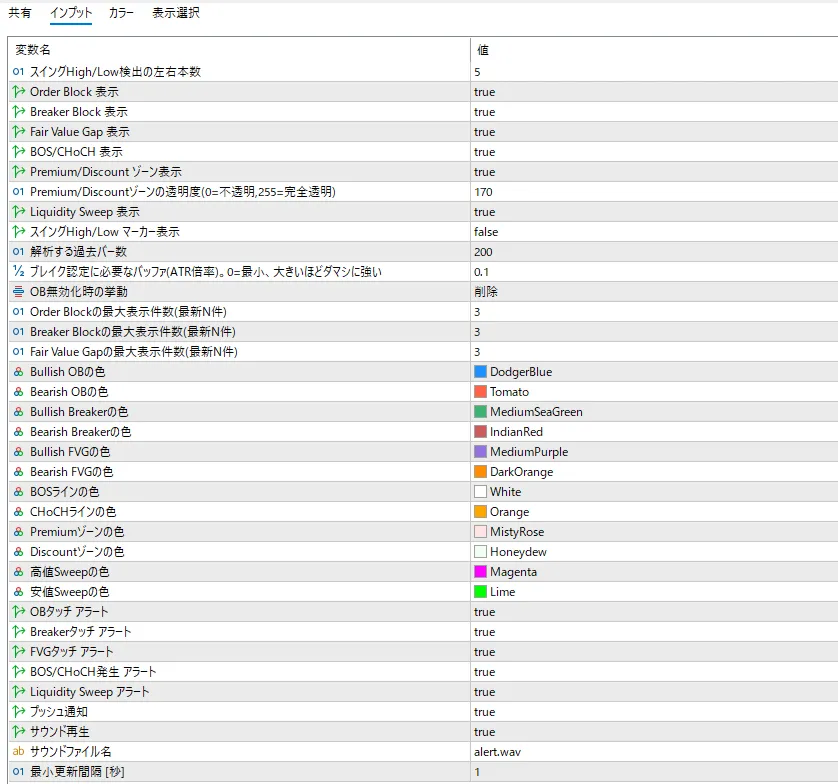
It notifies you of five kinds of events via alerts. It supports pop-ups, push notifications to smartphones, and sounds.
- OB touch
- Breaker touch
- FVG touch
- BOS / CHoCH occurrence
- Liquidity Sweep
Messages arrive in this form.
[SMC] GBPUSD H1: Bullish OB Touch (1.35120-1.35060)Which instrument, which timeframe, and what happened. It includes the price range. If you attach it to multiple timeframes, you’ll receive notifications from each.
Notifications for the same zone and the same candle occur only once, so you won’t get alerts if price moves back and forth inside the zone.
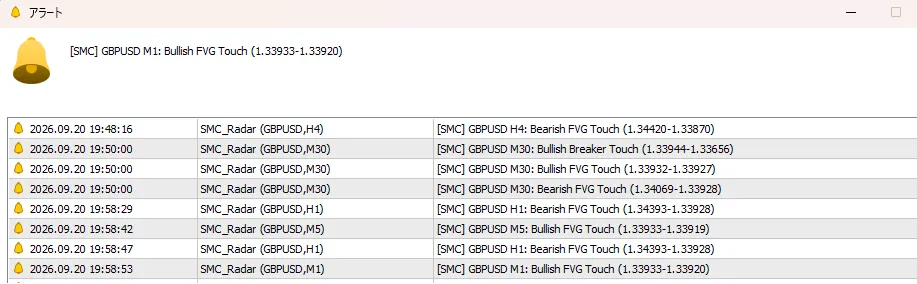
All settings are in Japanese
There are 36 parameters. All displayed in Japanese.
On/off for each element, maximum number of displays, colors, alert types. You can adjust them all. If you feel there are too many zones, lower the maximum displays for Order Block / Breaker / FVG to 1–2 so only the latest ones remain.
Usage flow
This is how I use it.
1. See the terrain on a higher timeframe Open H4 or H1 and identify where large zones are. If the most recent CHoCH has appeared, that is a candidate for a change in flow.
2. Wait for proximity to zones You don’t need to cling to the chart. If OB touch alerts are enabled, you’ll be notified on arrival.
3. Confirm on lower timeframes After you receive a notification, switch to M30 or M15 and see what is happening in that zone. If a Sweep arrow appears and CHoCH occurs right after, it means the justification is solid.
4. If the justification disappears, skip it While you’re waiting, if the zone disappears or turns gray, that justification has collapsed. Move on and wait for the next one.
Operational environment
| Item | Content |
|---|---|
| Supported platform | MetaTrader 5 (Build 2485 or later) |
| Supported currency pairs | All pairs (including GOLD, indices, etc.) |
| Supported timeframes | All timeframes (recommended: M15 / M30 / H1 / H4) |
| DLL usage | None |
| External indicators | Not required |
Since it does not use DLLs, it works regardless of broker. q
Why I made it — MT4 is ending
The trigger was the end of MT4 provisioning by domestic brokers.
JFX ends MT4 on August 19, 2026, and OANDA Securities on November 27, 2026. Others are following suit, and moving to MT5 has become the industry-wide trend in Japan.
I develop indicators for MT4 and also sell SMC-Radar. I thought it would be troubling if, when users move to MT5, they could not use the same tool.
So I started the porting, but after making it I realized several things. This article’s item about “display not matching” is one of them.
Additionally, during the porting verification, a bug that was present in MT4 from the start was found.
There was a problem with how the Premium / Discount zones’ colors were specified; they were displayed in a color different from the one set. Also, a parameter to adjust opacity did not work regardless of what was input. The cause was that the internal interpretation of the color specification differed from what was expected.
If I hadn’t ported and lined them up for comparison, I probably wouldn’t have noticed. The MT4 version was also fixed in Ver 1.04 and has already been distributed. Existing buyers have received it as well.
Porting felt like “rebuilding the same thing,” but in reality it was also an opportunity to review existing products.
Sales information
SMC-Radar for MT5 / 3,980 yen (one-time purchase)
*Discounted price may apply as part of a launch campaign. Please check the sales page for the latest price.
https://www.gogojungle.co.jp/tools/indicators/86667
To those who already have the MT4 version. The judgment logic and parameter configuration are the same. However, as described in this article, the display does not match completely. Please note that you would need to purchase as a separate product.
Disclaimer
This product is an analysis support tool that draws each element of the Smart Money Concept on a chart. It does not provide trading signals, investment advice, or guarantee investment performance.
The drawn content is mechanically calculated from past and current prices and does not predict future price movements. The developer is not responsible for any damages arising from trades made using this product. Please make investment decisions at your own risk.