
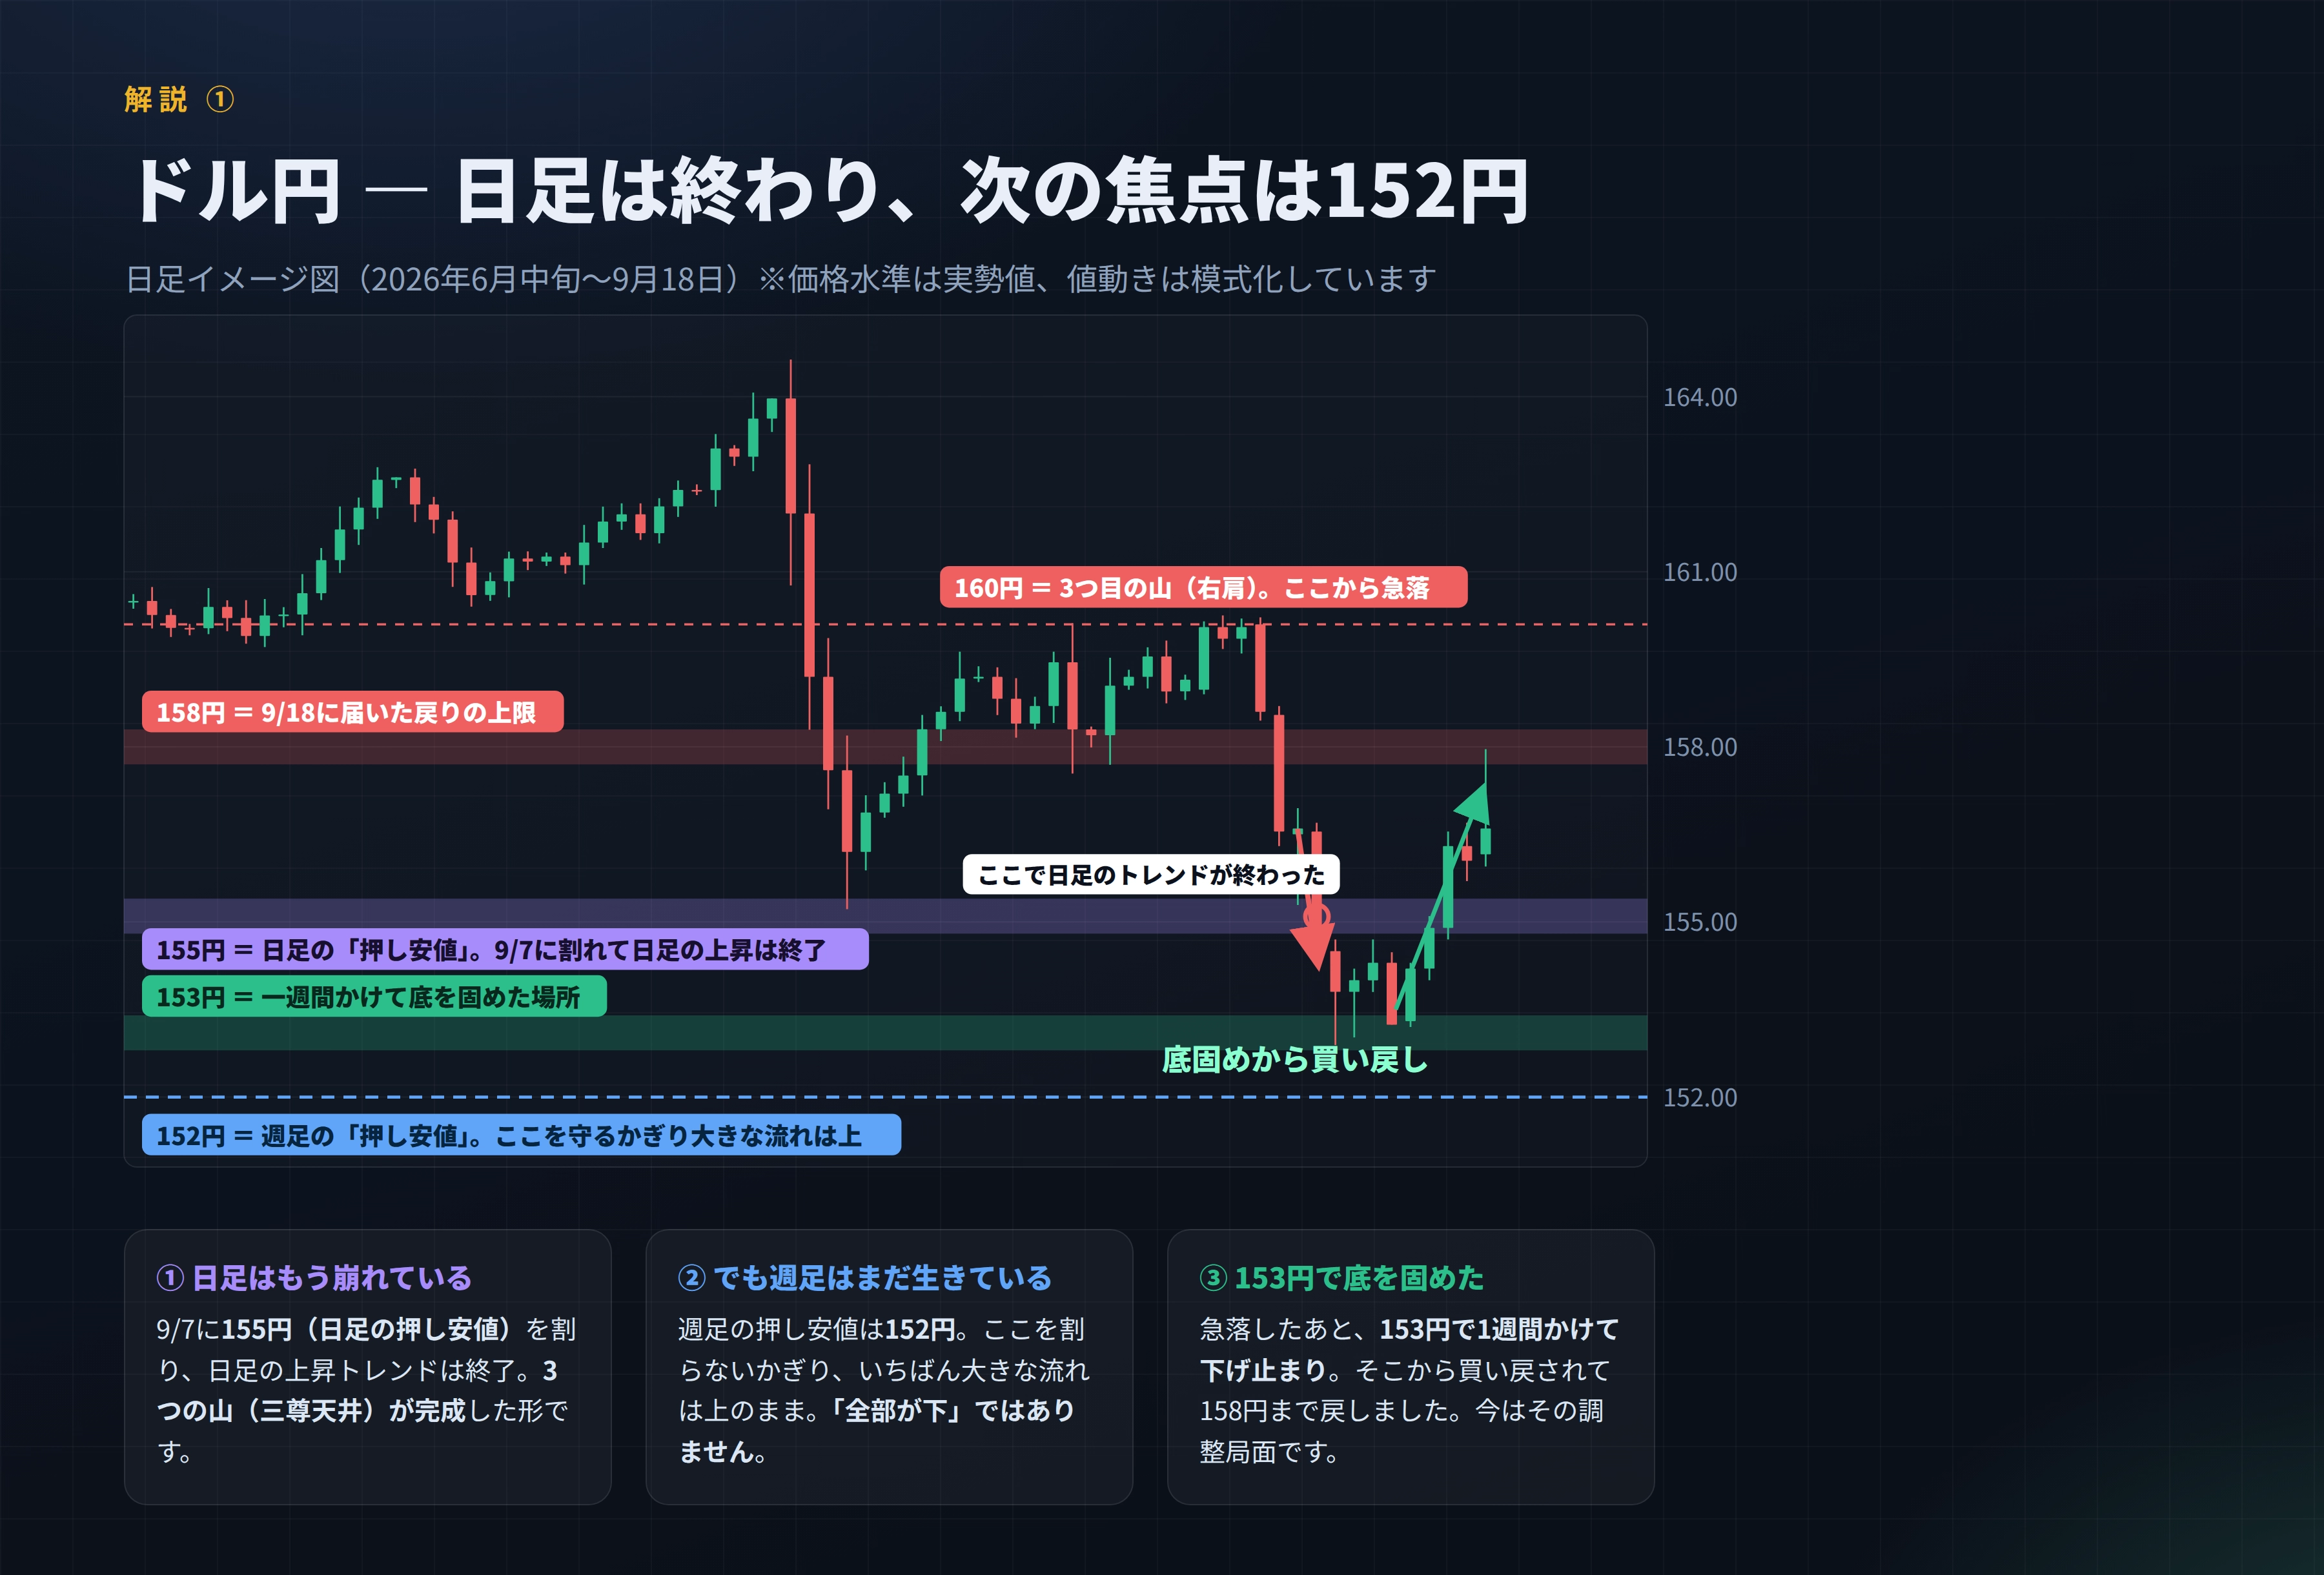
The daily uptrend is already over. But the weekly is still alive. The boundary is 152 yen.
The daily uptrend has already ended.
But the weekly chart is still alive. The boundary is 152 yen.
Organize the current position
Movement up to now
June–July: form three peaks around 160–164 yen (a head-and-shoulders top)
↓
Sept 1–2: the third peak (right shoulder) hits 160 yen and a sharp drop begins
↓
Sept 7: breaks below 155 yen
Sept 8–11: consolidates at a bottom for a week around 153 yen
Sept 16: at FOMC, breaks above 155 yen
Sept 18: after the Bank of Japan rate hike, recovers to 157.96 yen (near 158)
Current price position
160.0 yen: the third peak (right shoulder). Starting point of the sharp drop
158.0 yen: upper limit of the rebound reached on 9/18
156.6 yen: current position (9/18 close)
155.0 yen: daily chart “support floor” that was broken on 9/7
153.0 yen: bottom formed over a week
152.0 yen: weekly chart “support floor” not yet broken
Determine trend direction by the “support floor” — this is the core
What is a “support floor”
In an uptrend,
the lowest price reached just before the price makes a new high
This acts as a stepping stone as the price rises.
● Higher high
Why is this important
Because you can determine whether the trend is continuing or ended with a single line, not by intuition.
If not broken → continuation
If broken → end
★ There is no ambiguity. This is the biggest advantage.
Rather than thinking “somehow weak” or “due to drop soon”,
draw one line, and you can decide just by watching.
There are different support floors for each time frame
This is a common stumbling point for beginners.
[Daily chart support floor] 155 yen
→ Broken on 9/7. Daily uptrend ended
[Weekly chart support floor] 152 yen
→ Not yet broken. The larger trend remains up
★ “Daily has broken, but weekly is still up”
= Not everything turned down
Charts are nested.
When a smaller time-frame breaks, larger time-frames can still be alive
— this is a normal state.
So our current strategy becomes
Since the daily chart has broken, the base approach is “rebound selling.”
But the weekly chart is still upward.
→ Chasing lower prices to sell is risky
★ Sell on the rebound
★ Or, if the 153 yen bottom holds, aim to buy back
Either of these options.
This Week’s Scenario
■ Upper scenario
If last week's low is defended, using the 153 yen bottom as a base,
we could see buying back up toward around 155 yen.
※ Since 155 yen was briefly broken,
we will see whether it serves as a resistance above.
■ Lower scenario
If the rebound selling continues, we could see the price extend down to 152 yen (weekly support)
expanding the downside.
※ If this level is broken, the weekly uptrend would end.
Then all timeframes would be in a down state.
■This Week’s Points to Watch
・Japan has a long weekend from 9/21–23. Participation decreases and prices can jump
・BoJ rate check occurs, so intervention risk remains
→ Keep positions smaller
Prices to remember
160.00 yen …… The third peak (right shoulder). Starting point of the sharp drop
158.00 yen …… Rebound upper limit reached on 9/18
156.60 yen …… 9/18 close (current position)
155.00 yen …… Daily support floor. Broken on 9/7
153.00 yen …… Bottom formed over a week
152.00 yen …… Weekly support floor. Last line of defense
Summary of chart patterns that emerged over this past month
Here is a整理 of terms introduced in the previous explanations.
【Head and shoulders top】
Three peaks with the middle being the highest. A topping signal.
Complete only after breaking the neckline.
【Bull trap】
Move that appears to break up but then falls.
Look at whether it actually breaks or holds.
【Resist–Support reversal】
A broken top becomes the bottom next (and vice versa).
【Push low / Pullback high】
Lines used to judge whether the trend is continuing.
If broken, it ends — a simple criterion.
【Expansion and contraction】
Markets alternate between large move periods and quiet periods.
The aim is the start of a move; do not chase the end.
★ All are tools to decide where to judge a point.
Rather than memorizing shapes, learn where the判断 points are for each shape,
and you will be able to apply it in practice.