
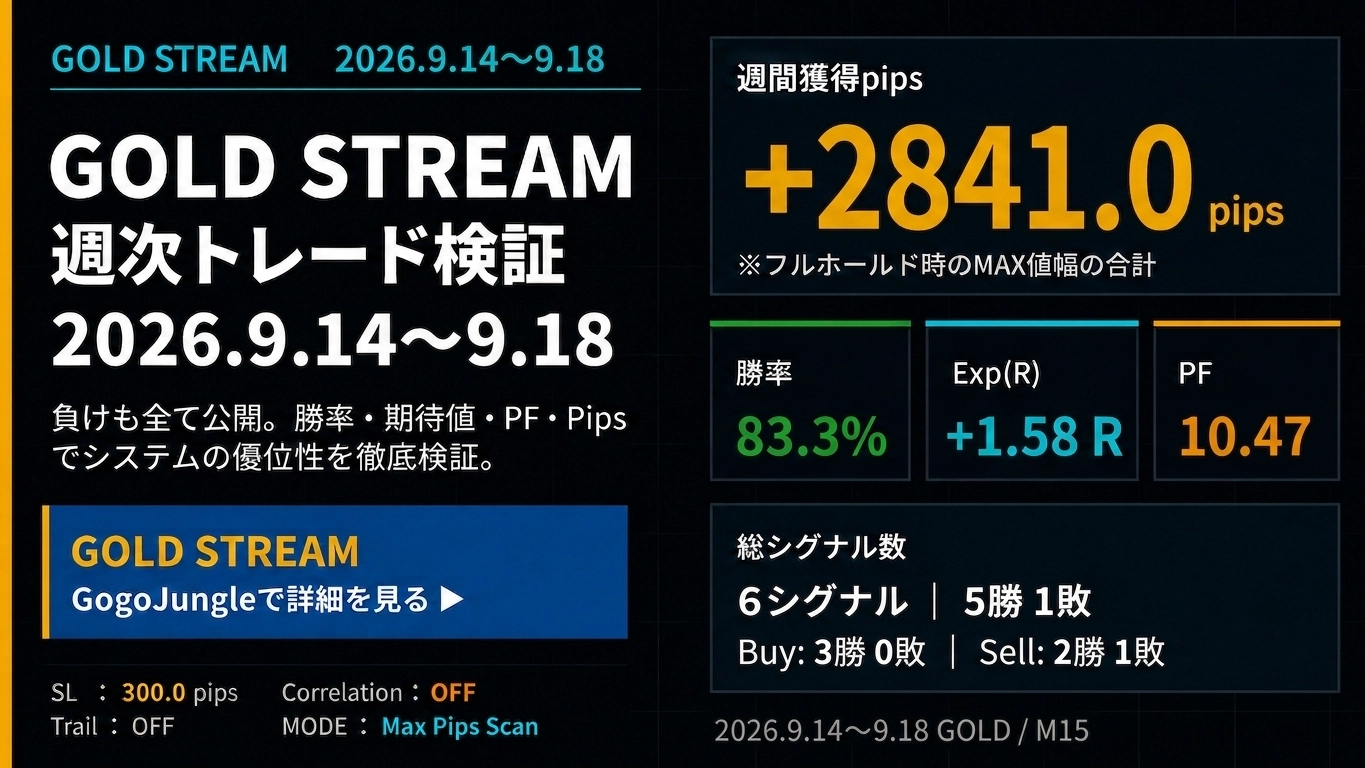
+2841pips【Weekly Trade Verification & Distribution History】GOLD Day Trade Specialization Type 「GOLD STREAMv2」2026.9.14~9.18
+2841pips【Weekly Trade Verification & Distribution History】
GOLD Day Trading Focused "GOLD STREAM v2" 2026.9.14~9.18
Check GOLD’s price movements, strength, and correlations, and verify signal accuracy, range, and expected value weekly. Not only win rate, but also PF, Exp(R), and 5-day ADR comparisons are used to evaluate this trading environment.
① GOLD Market Analysis
1. Price Movements
From September 14 to 18, the GOLD market experienced extremely high volatility due to early-week inflation concerns amid tightening and a rapid pullback into the weekend as buyers returned. On the 14th, amid inflation vigilance from rising oil prices, it briefly fell to $4,293. After the FOMC on the 16th, as expected by the market, a 0.25% rate hike was unanimously decided 12–0, and following the dot plot’s hawkish tilt, it slid to around $4,310.
However, from the latter half of the week into the 17th–18th, as rate hike expectations passed, the rebound accelerated. By the 18th, it briefly recovered to the $4,437 range, ending the week with strong gains of over 0.7% with a long lower shadow.
2. Demand/Supply & Investment Factors
On the supply side, structural gold buying by central banks and institutional investors continues, acting as a strong cushion during short-term rate increases. After the FOMC, as U.S. long-term rates cooled, physical demand for inflation hedging immediately picked up.
On the other hand, while price action remains high, jewelry demand in Asia shows some restraint, but global geopolitical risks and fiscal concerns have driven strong safe-haven demand overall.
3. Investment Trends
Gold ETF inflows surged as the market digested the pre-FOMC pullback as a transient event, rising toward the weekend. Notably, large North American and European funds increased portfolio allocations, and long positions in COMEX gold futures expanded among hedge funds.
A brief “rumor sells, fact buys” environment appeared due to rate-hike news, and a strong up-move momentum formed as short-covering by speculative traders near the bottom coincided.
4. Overall Assessment
This week GOLD experienced extreme volatility exceeding 1000 pips due to the oversized event of the FOMC. The V-shaped recovery from pre-event decline to post-event rebound presented a high-difficulty environment that sifted out emotionally driven traders.
Nevertheless, if one employs clear trading rules and recognizes the environment using indicators with statistical edge, such high volatility can transform into excellent profit opportunities.
⑤ SILVER / COPPER Market Conditions
SILVER
SILVER fell in early week due to rate-hike concerns but showed a strong V-shaped recovery in step with GOLD’s rebound. Investment demand for precious metals and solid industrial demand (e.g., solar) supported the downside strongly.
COPPER
COPPER trended softer in the early week on fears of a global slowdown from monetary tightening, but supply concerns and electrification demand for AI and data centers supported it, narrowing the declines into a range near the weekend.
② GOLD STREAM v2 Weekly Trade Verification
Weekly Verification Result
③ GOLD STREAM v2 Distribution History
Weekly Signal Distribution History
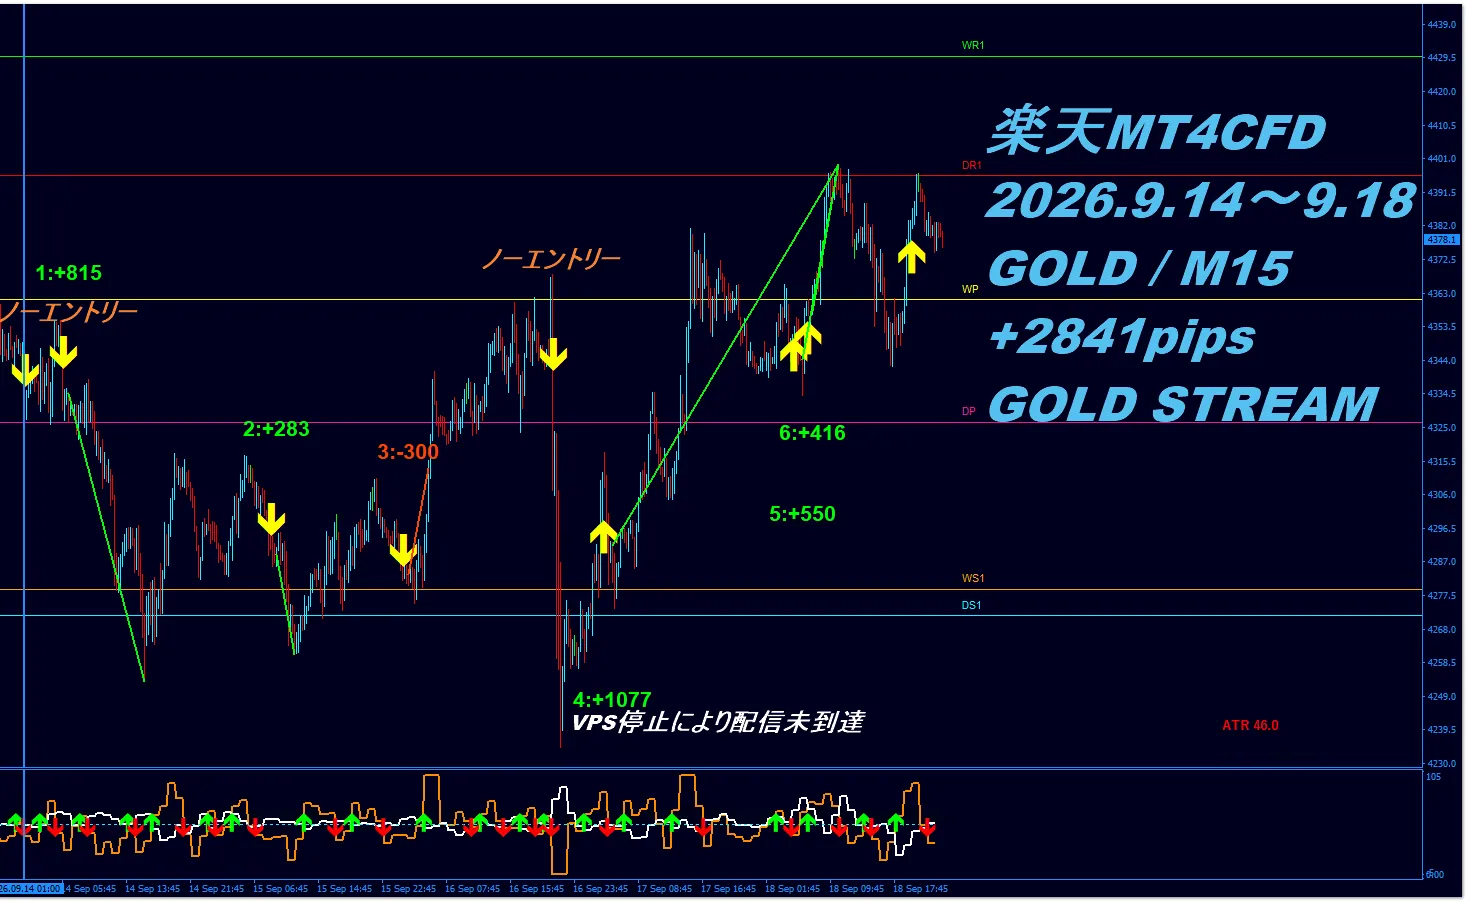
(9.17 / 4: +1077 VPS stop caused delivery not reached)

④ Weekly Verification AI Evaluation
This time5-day ADR 1047 pipsa very large range occurred, turning from a sharp decline to a sharp rebound, forming a 180-degree shift in the market environment. We evaluate not only signal activation but also win rate, PF, expected value, and range efficiency in a comprehensive manner.
■ Signal Judgment and Entry Precision
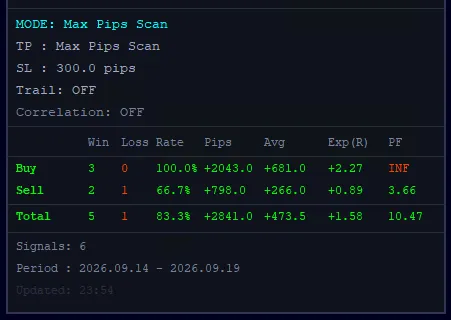
In the verification panel records, among a total of 6 signals5 wins, 1 loss, win rate 83.3%The breakdown: Buy signals 3 wins 0 losses (100%), Sell signals 2 wins 1 loss (66.7%). Note there were two no-entry judgments due to correlation mismatches, eliminating unnecessary entries in high-risk situations.
Total maximum price range captured was+2841 pipsand the average range was+473.5 pipsproviding an impressive record. The accumulated width over 5 days ADR 1047 pips was about 2.7 times, efficiently capturing the volatility, demonstrating a detection of volatility.
In addition to the high accuracy of 83.3% win rate, the profit factor (PF) is an astonishing10.47(Sell alone 3.66, Buy INF). The Exp(R) per risk unit (SL 300 pips) is shown asExp(R) +1.58Rdemonstrating overwhelming positive edge and profitability.
■ Results by Win Rate, PF, Exp(R)
Win Rate 83.3%This is exceptionally high performance in a highly volatile week. Even the sole loss was contained within the -300 pips limit, and winning trades captured large swings: 1: +815 pips, 2: +283 pips, 4: +1077 pips, 5: +550 pips, 6: +416 pips.
As a result, thePF 10.47indicates total profits exceeding ten times total losses, illustrating excellent risk-reward. AlsoExp(R) +1.58Rmeans each trade can expect 1.58 times the risk amount in profit, indicating a highly effective trading logic.
Note: Signal 4 (+1077 pips) was not delivered due to VPS stop, but the indicator’s calculation algorithm correctly captured a long position at the bottom price.
■ Strength/Correlation Analysis Evaluation
In the post-FOMC directional shift, the strength indicator shown in the sub-window (GOLD_STRENGTH) functioned as an excellent signal filter.
The two no-entry judgments on the chart were precisely filtering decisions responding to correlation mismatches, thoroughly avoiding entry in high risk situations. It quickly detected strength changes during trend reversal phases, underpinning the rapid rebound waves (+1077 pips, +550 pips).
■ MAX Pips Scan & SL
This chart isMODE: Max Pips Scan / Correlation: OFF.
The displayed pips are the MAX values when price movements after signal generation are fully heldas MAX values. Therefore, +2841 pips does not represent actual filled profit.
Also, the stop loss (SL) decision is based onthe 4-hour chart (fixed 300.0 pips). It is not a rushed SL decision based on short-term noise on the M15 chart.
■ GOLD Market Difficulty
★★★★★ 5 / 5
In addition to an ADR of 1047 pips, the market was volatile, moving from a decline to new highs after the FOMC event. This is an extremely challenging environment often leading to back-and-forth moves for discretionary traders, rated as difficulty 5.
■ Evaluation of GOLD STREAM Weekly Trade Verification
★★★★★ 5 / 5
Rated the最高評価 “★5.” Amid a turbulent market, it producedWin rate 83.3%・PF 10.47・Exp(R) +1.58R・Total +2841 pipsan astonishing figure.
The combination of two no-entry risk-avoidances and high accuracy in catching trend reversals fused to demonstrate the tool’s overwhelming edge, making this a week that proved its advantage perfectly.
■ AI Overall Commentary
This week's verification results (5–1, +2841 pips, PF 10.47) prove that, even in a highly volatile market, profits can be greatly amplified by correctly following robust strength and signals.
In the gold market, ADR over 1000 pips poses the most dangerous risk in reliance on intuition or unbacked contrarian bets. What is needed for professional trading is an objective, overwhelming standard to capture the market waves.
If you want to transform a turbulent gold market into the "greatest opportunity" rather than fear, consider making GOLD STREAM v2 your partner and experience the decisive advantage in trading.
Verification Data Evidence
Are you unsure about GOLD entry?
“It’s going up, but I’m not sure if I should enter now.”
“I can’t determine where to enter.”
“The price is too volatile; entry is scary.”
In markets with large price moves like GOLD, it is important not to chase just by feel, but to have criteria to enter or refrain bychecking win rate, PF, expected value, strength, and correlation.
GOLD STREAM v2 specializes in GOLD day trading and supports entry decisions by confirming market strength and correlations.
View GOLD STREAM v2 product page Ask a QuestionRelated Articles
If you want to learn more about trading philosophy and GOLD trading, see here.
The verification results and figures shown in this article are reference information based on back-tested data from past market conditions and do not guarantee future profits or identical results.
Pips and P/L data shown are based on the maximum price movement achieved after entry signals (MAX value) under a fixed stop-loss setting. These are MAX values assuming full holding of post-signal movements and do not represent actual filled profits or real trading results.
Actual profit and loss depend on entry/exit timing, spreads, slippage, trading costs, execution environment, position size, take-profit/SL decisions, and market conditions. The SL decision is based on the 4-hour chart and may vary with actual operating conditions.
Additionally, due to differences in trading conditions and price delivery across brokers, you may see differences in real prices, pips, P/L, and execution results depending on the broker/platform used. Therefore, there may be discrepancies between published data and actual performance.
This data is a reference for validating GOLD STREAM v2 signal advantages and market analysis accuracy. Final investment and trading decisions should be made by yourself considering your financial status, risk tolerance, and trading environment, and at your own risk.