

CS WORKOUT is like this.
This is how it feels.
but to notice your own judgment gaps by yourself.
I’ll introduce one WORKOUT that I actually did at OPEN GYM.
“What exactly is CS WORKOUT about?”
Rather than listing explanations,it’s faster to see one actual interactioninstead of explaining.
This time, we will take the free community “CS WORKOUT|OPEN GYM” that公开edWORKOUT 001and reconstruct it as a teaching material as is.
This is not about pretending to be actual participants. To clearly show how a typical participant would think, the operators respond as “demo attendees.”
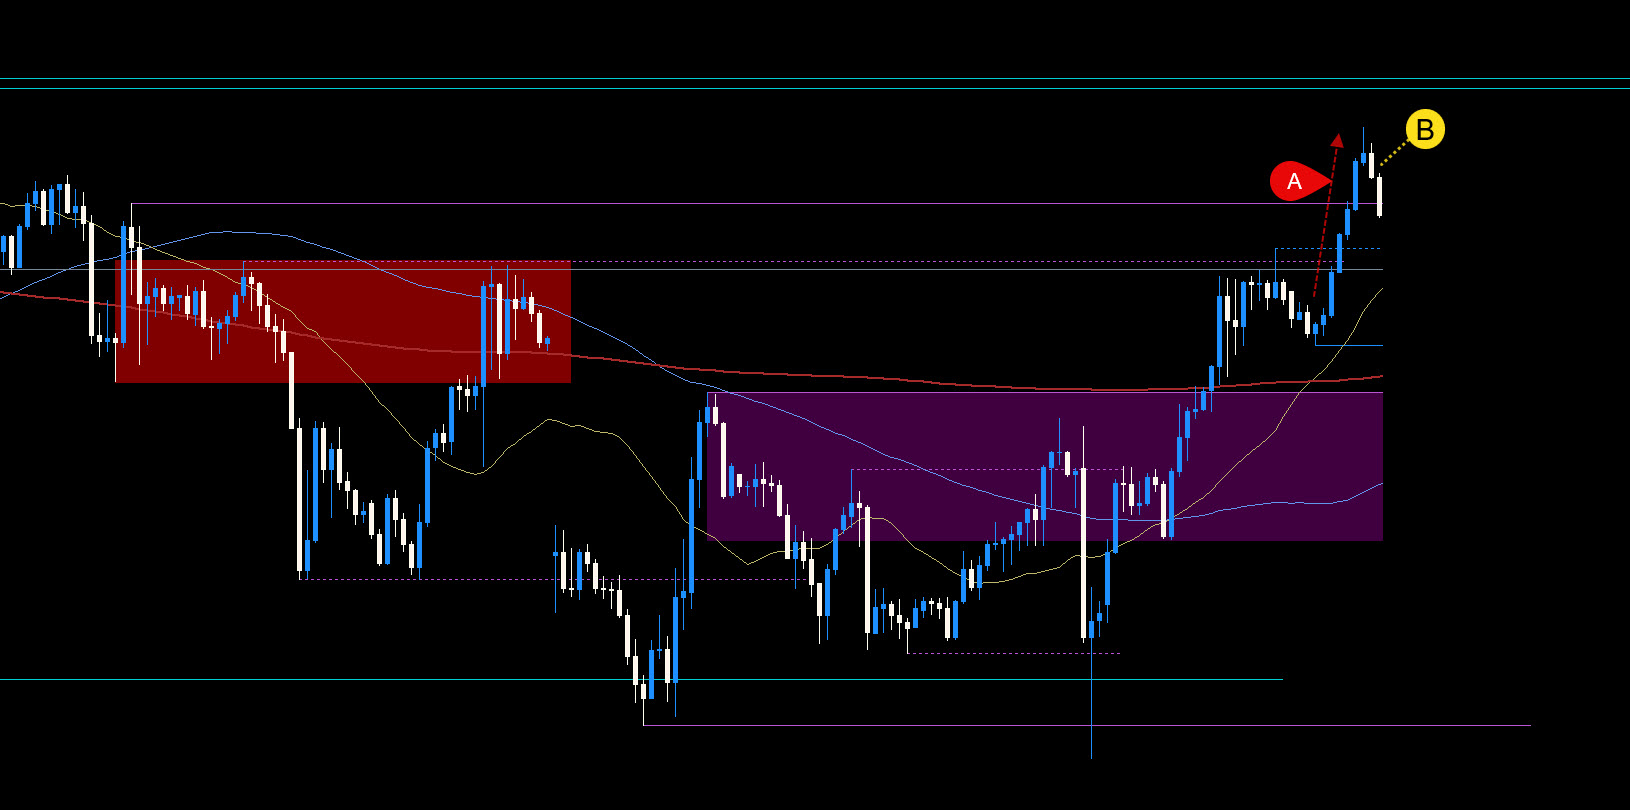

Subsequently, a bearish candlestick is confirmed on one candle, forming a second one.
Now, forget the time axis display and take a look again.
If this were a 1-minute chart, would you buy from the middle of this second bearish candle?
Also, if you wouldn’t buy,what would be the biggest reason?
Put it into words.

The main reason is,it still seems to be too shallow a push.
Looking at the overall rise, I’d like it to pull back a bit deeper.
At least around the base of A, if possible, even near half of the entire rise that’s bigger, I’d feel it easier to buy.
Now then, keep the feeling“it’s still too shallow. I don’t want to buy here.”as it is, in your memory.
Now we will sharply lower the time axis.
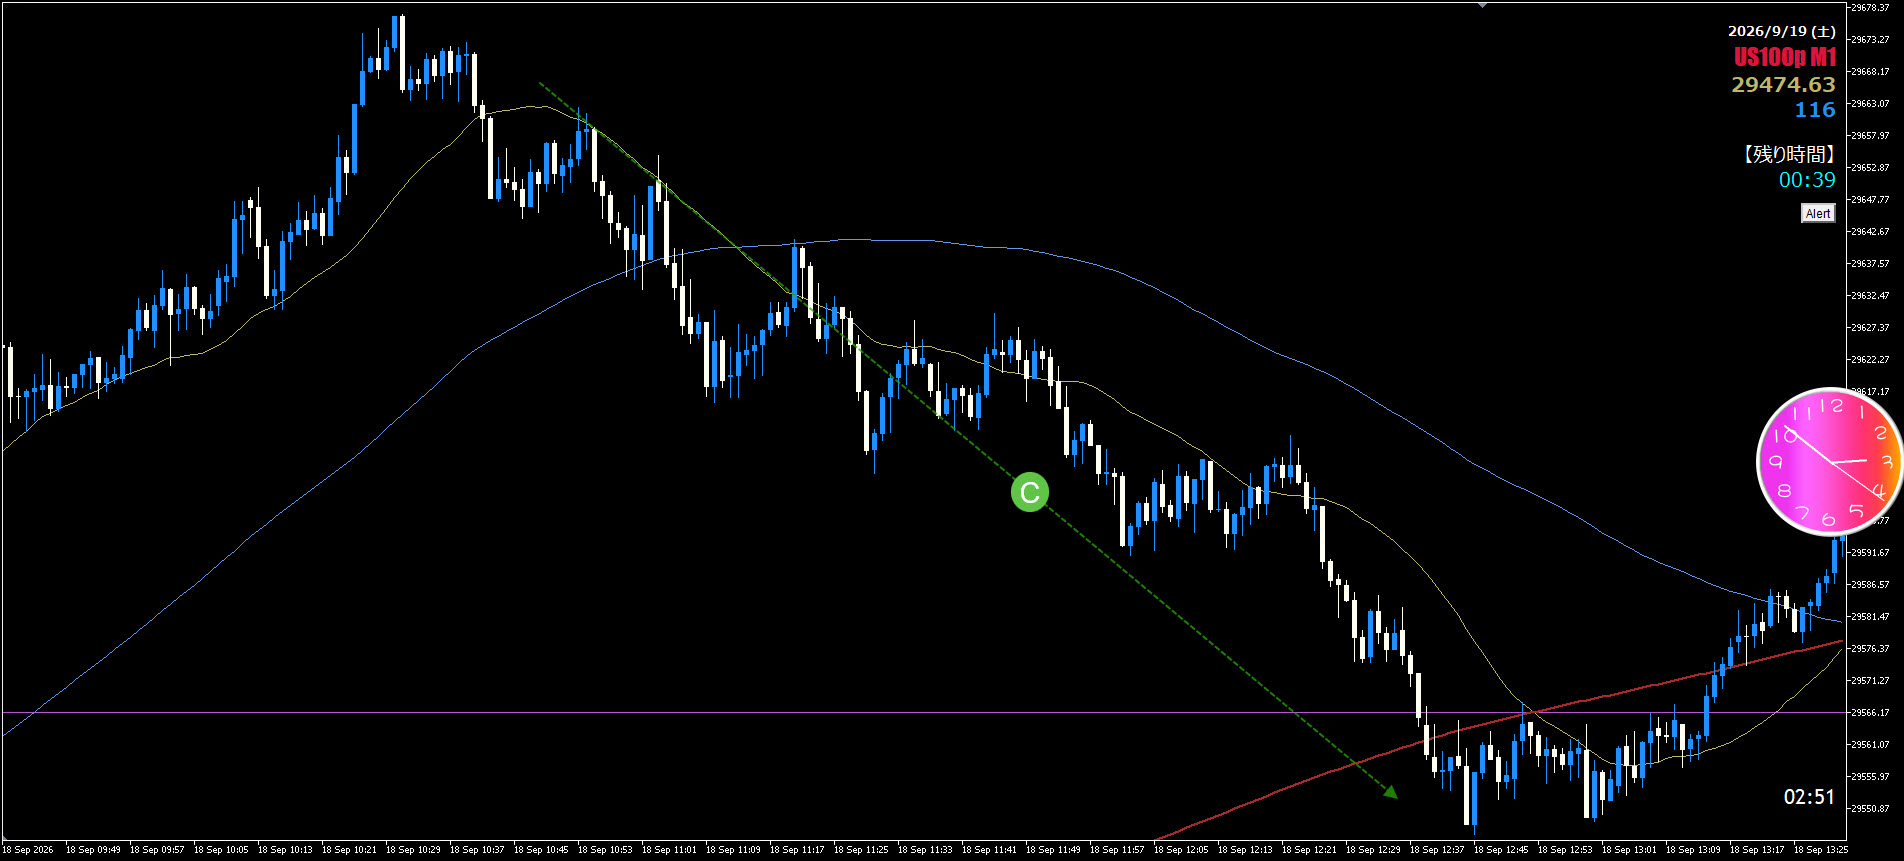
This situation is the process that formed the two bearish candles on the previous hourly chart.
Here, after the M1 continues to fall, there are signs that it may stop decline, and if it proceeds further, a short-term downtrend may appear to have reversed.
On M1, if you see a signal like “stopping” or “the downtrend has reversed,” would you buy from here?
Compare this with your earlier judgment when you thought H1 was a 1-minute chart and“it’s still too shallow”.
I see.
If you were only looking at M1, with the downtrend reversing, you might start thinking of buying.
But, when you only looked at H1 earlier, you judged“it’s still too shallow, so I don’t want to buy.”.
In that sense, buying just because M1 paused a little or reversed is not consistent with your previous decision.
On H1, you still have not reached the position you wanted to buy at.
Read how it connects to where it’s happening on higher timeframes.
This time, the most important thing I want you to think about is here.
M1 downtrend reversed.
Signs of a stop in the decline appeared.
That, by itself, is a fact that happened.
But lowering the timeframe doesn’t erase the chart pattern or current position that you could see on H1.
Even the same “reversal,”its meaning changes depending on where that reversal occurred.
When looking at a chart,
“What happened?”
is not the only question;
“Where did it happen?”
think in a bundled way.
From the start in this scenario,
you could also have written an answer like,“Do not buy just by watching M1’s reversal.”.
What we did this time is the opposite.
First, look at H1, and have yourself decide
Then lower the timeframe.
Only then can you re-examine“Huh? Is my previous judgment still in agreement with my current judgment?”.
Phenomena on a chart do not have meaning on their own.
Even with the same “reversal,” its meaning depends on whether it occurred within a deep pull on higher timeframes or at a shallow level right after an uptrend.
Depending on position and context, the meaning of that information changes.
What CS WORKOUT aims to cultivate is not to trust anyone’s answers, butto see for yourself, ask yourself, and verify the consistency of your own judgments.
OPEN GYM is available for free participation.
Through WORKOUT, Q&A, and mini-explanations,
we practice not “memorizing the answers” but“reading charts by yourself.”
We aim to create people who can read charts.