
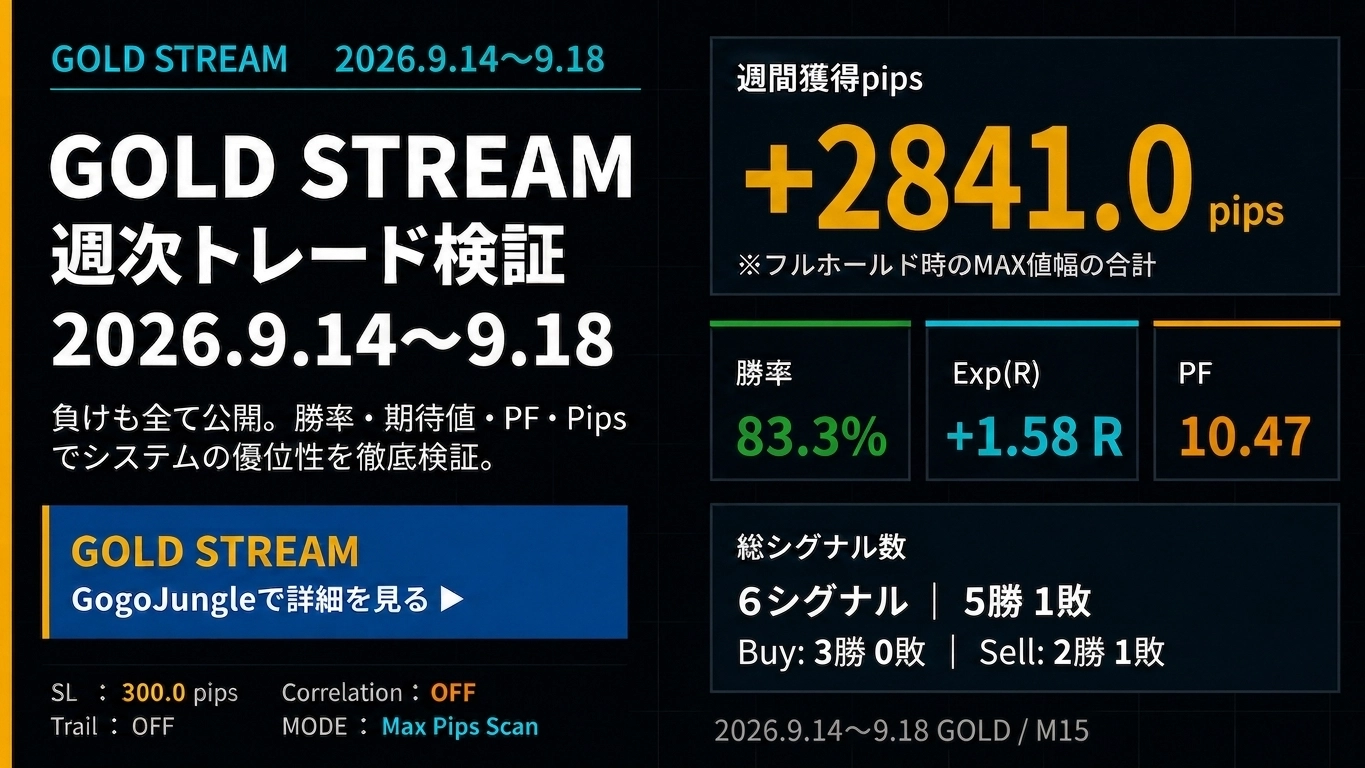
+2841 pips 【Weekly Trade Verification & Distribution History】Gold Day Trading Specialized Type 「GOLD STREAM v2」2026.9.14~9.18
+2841pips【Weekly Trade Verification & Distribution History】
GOLD Day Trading Focused "GOLD STREAMv2" 2026.9.14~9.18
Check GOLD’s price movement, strength, and correlation; verify signal accuracy, range, and expected value weekly. Not only success rate, but also PF, Exp(R), and 5-day ADR comparisons are used to evaluate this trading environment.
① GOLD Market Analysis
1. Price Movement
From September 14 to 18, GOLD market saw very high volatility due to early-week inflation worries from tight monetary policy, followed by rapid pullback into the weekend. On the 14th early in the week, due to inflation concerns amid rising oil, price briefly fell to $4,293. After the FOMC on the 16th, as expected, a 0.25% rate hike was unanimously decided 12-0, and the dot plot’s hawkish tilt caused a drop to around $4,310.
However, from the 17th to 18th, gains accelerated as rate hike expectations passed; on the 18th price rebounded to the $4,437 area briefly, ending the week with a strong upside move and a weekly gain exceeding 0.7% with a long lower shadow.
2. Demand/Supply & Investment Factors
On the supply side, structural gold purchases by central banks and institutional investors continue, providing a strong cushion during short-term rate hikes. After the FOMC, as U.S. long-term rates adjusted, physical demand for inflation hedging immediately picked up.
Meanwhile, high-price movement persists, leading to some restraint in physical demand for jewelry, especially in Asia, but safe-haven demand driven by global geopolitical risks and fiscal concerns continues to pull overall market higher.
3. Investment Trends
Funds flowed into GOLD ETFs, absorbing the earlier pre-FOMC selling as a temporary dip, and surged toward the weekend. Notably, portfolio inclusion by major North American and European funds increased, and long positions among hedge funds in the COMEX gold futures market expanded.
A temporary rumor-driven sell-off and eventual buyback created a clear event-driven rally, with short-covering among technicians near the low end contributing to strong upside momentum.
4. Overall Evaluation
This week GOLD experienced extremely high volatility, exceeding 1000 pips, with a V-shaped recovery around the FOMC event. The initial decline before the event and the sharp rebound afterward created a challenging environment that tests emotional trading.
However, with clear trading rules and indicators showing statistical superiority, this high volatility became an excellent opportunity for profits.
⑤ SILVER / COPPER Market Conditions
SILVER
SILVER dropped in the week’s first half due to rate-hike concerns but staged a strong V-shaped recovery in line with gold’s rebound. Investment demand for precious metals and steady industrial demand (e.g., solar) provided solid support at the bottom.
COPPER
COPPER showed softer movements in the early week due to global slowdown fears from monetary tightening, but supported by supply concerns and demand from AI/data center electrification, trimming losses toward the weekend into range-bound movement.
② GOLD STREAM v2 Weekly Trade Verification
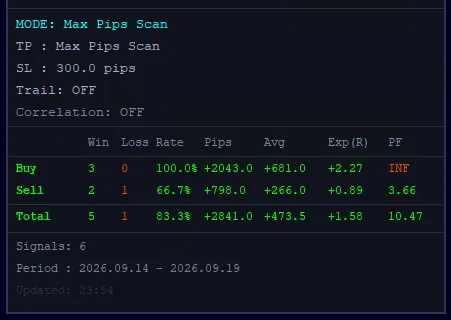
Weekly verification results
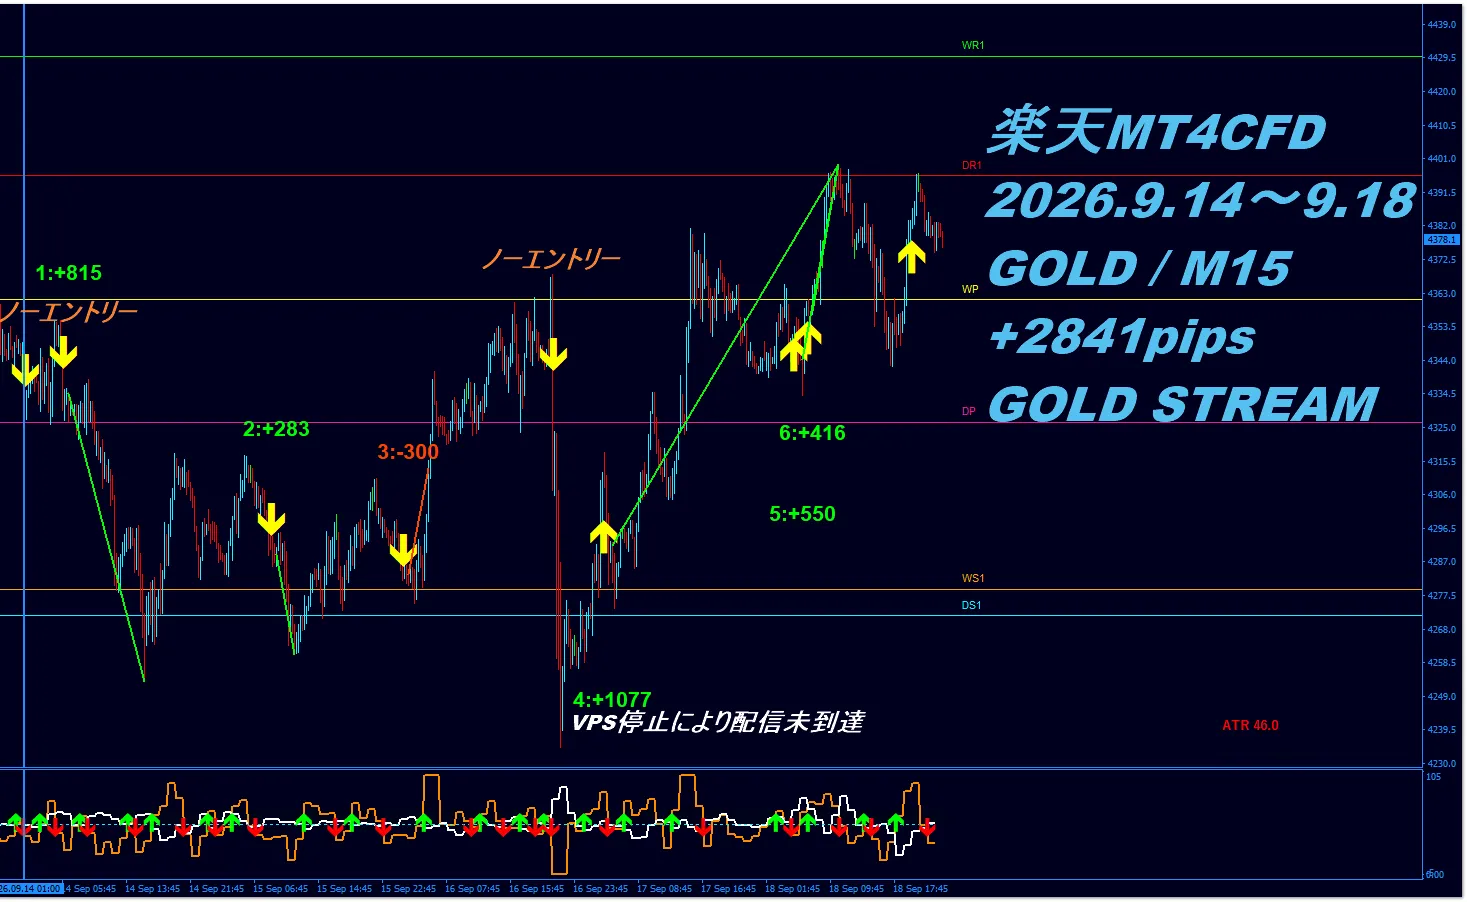
③ GOLD STREAM v2 Distribution History
Weekly signal distribution history
(9.17 / 4: +1077 VPS stopped, distribution not delivered )

④ Weekly Verification AI Evaluation
This time5-day ADR 1047pipspresented a massive range, with a transition from a drop to a sharp rebound, transforming the market into a 180-degree turn. We evaluate not only signal activation but also win rate, PF, expected value, and range efficiency.
■ Signal Judgment and Entry Precision
In the verification panel records, out of 6 total signals5 wins, 1 loss; win rate 83.3%. Buy signals were 3-0 (100.0%), Sell signals were 2-1 (66.7%). Also, two no-entry judgments visible on the chart were decisions to pass due to correlation mismatches, avoiding unnecessary entries in high-risk situations.
Total maximum price movement captured: +2841pips; average range: +473.5pips, an impressive record. The accumulated range for 5-day ADR 1047pips was about 2.7 times larger, efficiently capturing volatility and showing a robust verification result.
In addition to the high accuracy of 83.3% win rate, the Profit Factor (PF) was an amazing10.47 (Sell alone 3.66, Buy INF). The Exp(R) representing expected value per risk of 1:1,000 pips is shown asExp(R) +1.58R, proving powerful positive edge and profitability.
■ Results by Win Rate, PF, Exp(R)
Win rate 83.3% is exceptionally high given the volatile market this week. The single loss was contained within the -300 pips limit, and winning trades captured large moves: 1: +815pips, 2: +283pips, 4: +1077pips, 5: +550pips, 6: +416pips.
As a result, PF 10.47 means total profits exceeded total losses by more than ten times, indicating an outstanding risk-reward profile. Exp(R) +1.58R shows each trade could deliver 1.58 times the risk amount of profit, a highly favorable trading logic.
■ Strength/Correlation Analysis Assessment
In the direction-shift around the FOMC, the strength indicator shown in the subwindow (GOLD_STRENGTH) served as an excellent signal filter.
Two no-entry judgments on the chart were due to correlation mismatches, representing accurate filter-based pass decisions that eliminated unnecessary entries in reverse-risk situations. It also quickly captured the strength change during trend reversal from sell to buy, underpinning the initial rebound wave (+1077pips, +550pips).
■ MAX Pips Scan & SL
This chart usesMODE: Max Pips Scan / Correlation: OFF.
The displayed pips represent the MAX value when the price movement after signal generation is full-held.Therefore, +2841pips does not necessarily indicate actual filled profit.
Also, stop-loss (SL) judgments are based on4-hour candles (fixed 300.0 pips). They are not determined by short-term noise on M15 charts.
■ GOLD Market Difficulty
★★★★★ 5 / 5
In addition to the 5-day ADR reaching1047pips, the market demonstrated a stormy environment moving from decline to new highs after the FOMC event. This was a highly challenging “Difficulty 5” environment where discretionary trading often suffers from back-and-forth damage.
■ GOLD STREAM Weekly Trade Verification Evaluation
★★★★★ 5 / 5
Rated the top "★5." In a wild market, the results wereWin rate 83.3%・PF 10.47・Exp(R) +1.58R・Total +2841pips, an astonishing figure.
The combination of two no-entry risk-avoidance judgments and high entry-precision for trend turns integrates with the tool’s dominant edge, proving the superiority of the system for the week.
■ AI Overall Commentary
This week’s verification results (5-1, +2841pips, PF 10.47) demonstrate that even in highly volatile markets, following accurately calculated strength, correlations, and signals can convert into substantial profit opportunities.
In gold markets with ADR exceeding 1000 pips, the biggest danger is “feel-based jumping in” or “unfounded contrarian bets.” What professionals need is a robust, objective standard to capture market waves.
If you want to transform the volatile gold market into your greatest opportunity rather than fear, adopt GOLD STREAM v2 as your partner and experience the decisive advantage of trades.
Verification data evidence
Are you hesitating on GOLD entries?
“ Prices are rising, but I don't know if I should enter now.”
“I can’t tell where to enter.”
“ movements are too volatile, entry is scary.”
In markets with large price moves like GOLD, it’s important to not chase based on feel alone, but toestablish criteria for entering or staying out by checking win rate, PF, expected value, strength, and correlation.
GOLD STREAM v2 specializes in GOLD day trading, supporting entry decisions while checking market strength and correlation.
View GOLD STREAM v2 product page Ask a questionRelated Articles
If you want to learn more about trading concepts and GOLD trading, click here.
- 【Video】“GOLD STREAM Signals Movement After Signals | TRADE REVIEW (2026.8.10–9.04)”
- The one reason results do not appear
- Why trading ends with “gradual gains and big losses”
- 【Unveiling the Core Tool Performance】 GOLD STREAM dedicated win/loss analysis tool verification
- Conclusion: With GOLD (XAU/USD) tradable in domestic FX accounts.
The verification results and figures published here are reference information based on back-tested data from past markets and do not guarantee future profits or similar returns.
The pips and profit data shown are based on the maximum price range (MAX) reached after entry signals and are calculated under a fixed stop loss (SL). These values reflect the MAX movement if the post-signal price action were fully held and do not guarantee actual realized profits or trade outcomes.
Actual profit and loss depend on entry/exit timing, spreads, slippage, trading fees, execution environment, position size, take-profit/stop-loss decisions, and market conditions. SL judgments are based on 4-hour intervals and may vary under different operational conditions.
Additionally, due to differences in trading conditions and price data feeds, volumes, and platform environments across brokers or brokers, actual prices, pips, profits/losses, and filled orders may differ from published data. Consequently, there may be disparities between published data and actual performance.
This data serves as reference material to verify the advantage of GOLD STREAM v2 signals and market analysis. Final investment or trading decisions should be based on your own financial situation, risk tolerance, and trading environment, and are taken at your own risk.