Utilization of the "Visualization Indicator" (No. 269)
“Visualization Indicator” utilization(No.269)
1. Further evolving the “28 Currency Pair List Indicator” into a more advanced indicator
With the “8CP Visualization Indicator”toAUDJPY plot
The “8CP Visualization Indicator”hasOceania version, London version, NewYork version, and AnyCP versions available.This time, the Oceania version was used.
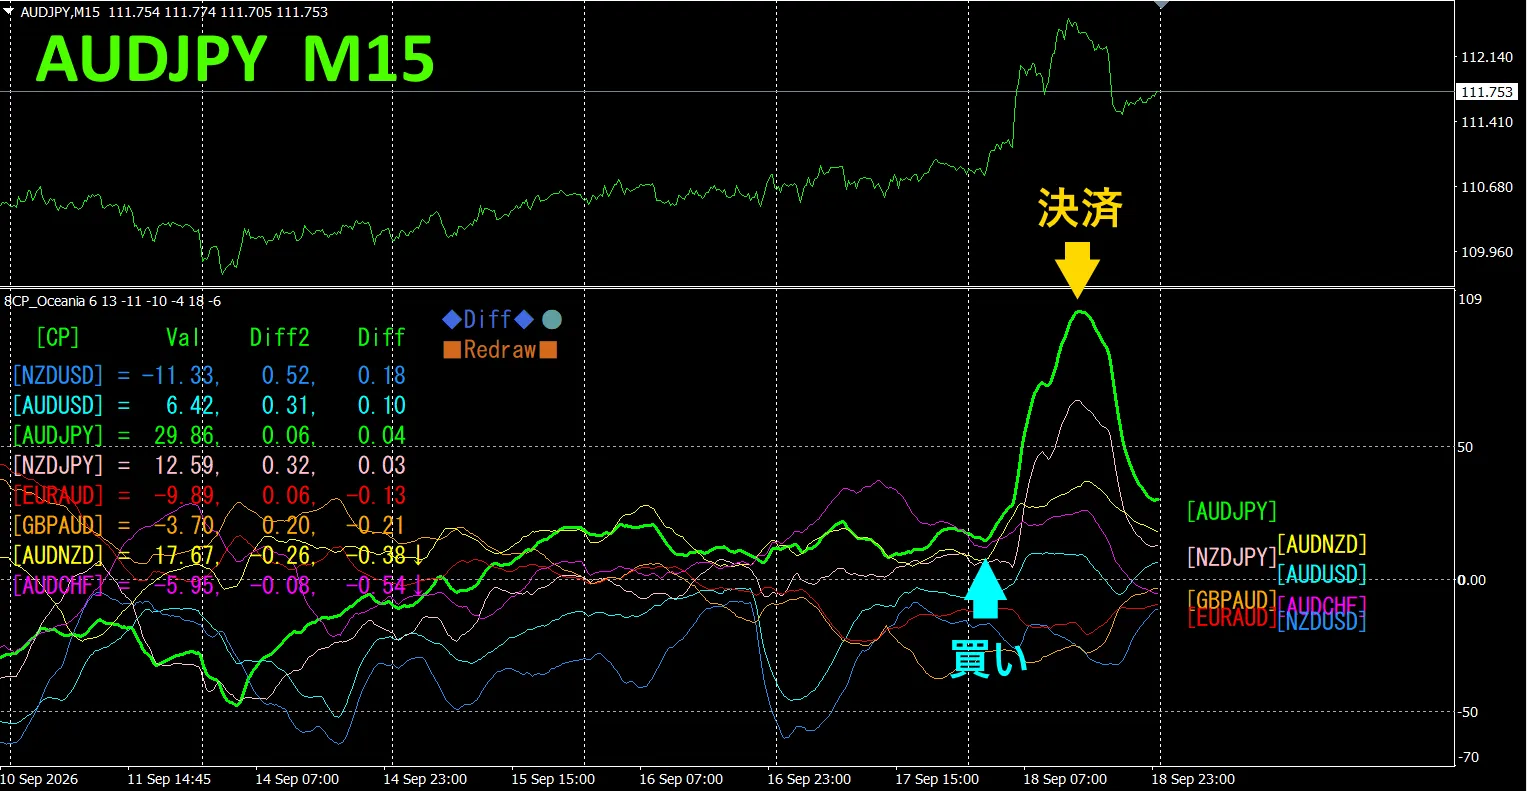
The upper half,is the 15-minute chart ofAUDJPY.The lower half,is generated by the“8CP Visualization Indicator”.Thethick green linegraphcorresponds toAUDJPY
On Friday,the AUDJPY graph,broke out above the other group of graphsso,a buyposition was opened.It was closedat the day’s peakandabout160pipsprofit was obtained.
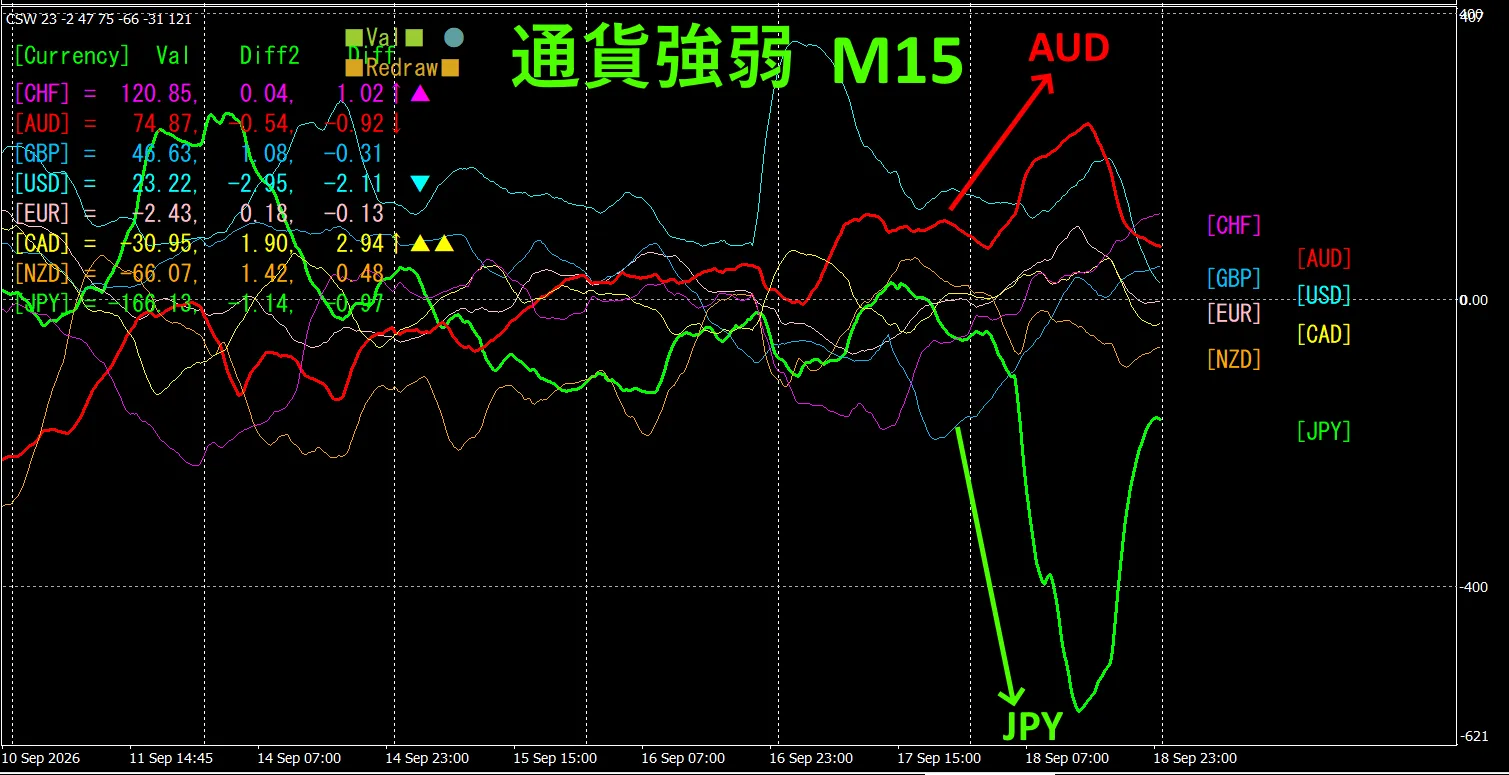
Looking at the 15-minute currency strength/weakness graph,JPYandAUDare,in an inverse correlation.JPYandAUDare diverging and spreading apart—we only trade in those sections.Since AUD >JPY,webuyAUDJPYduringthe expansionphaseto trade.Because of the inversecorrelation,wetarget only those points to trade.
In FX,if you select the currency pairthat is currently extending the most,and that has an inverse correlation,the results will naturally follow.
“Target inverse correlation in currency strength!”isan iron ruleof FX.
If you use “TrendLine-EX”,you can automate entries and exits by diagonal trendline breakouts.You can leave it unattended,makingtradingeasy. “TrendLine-EX”is,a semi-automatic EA that can sell automatically on trendline breaks downward,and automatically close on breaks above the trendlineEA.
2. Try using the Best SelectIndicator
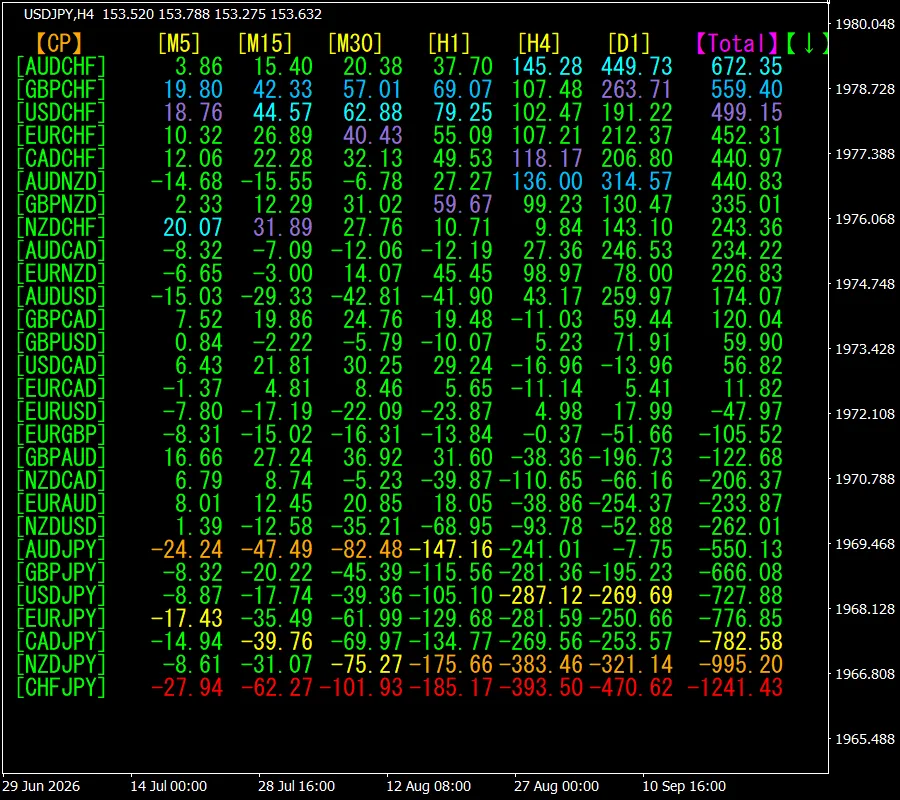
Thefigure below is a screenshot from 2026/148:21(JST) .
[Total] is sorted indescending orderby value.At the verybottom,CHFJPYis,displayed inredcoloracross all timeframes. Totalvalueis -1241.43and,it isa negative number.CHFJPYthus,suggestsa downtrend is occurring.
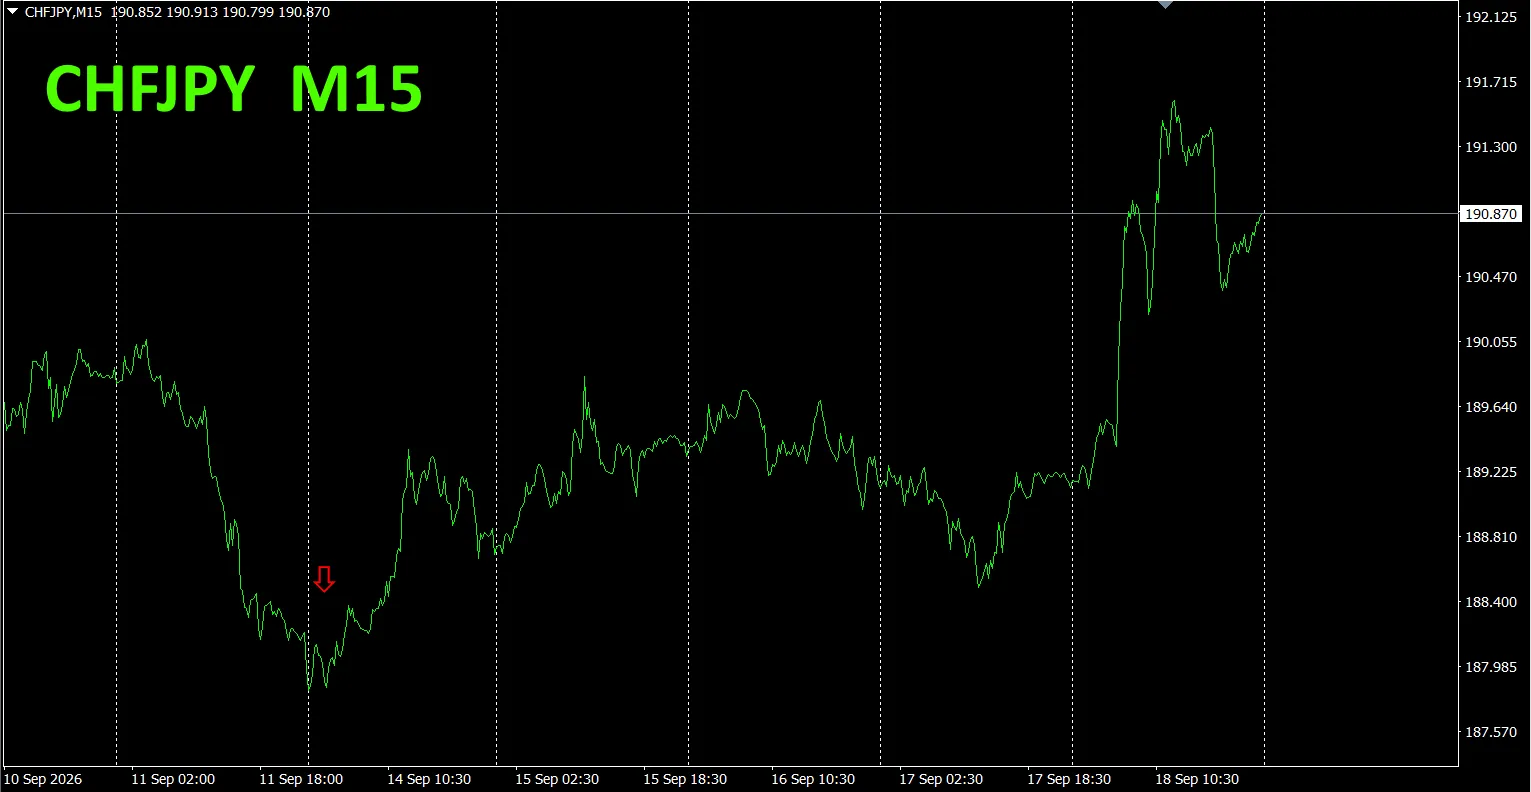
Now,let’s look atthe chart ofCHFJPY.
The red arrow marks where the screenshot was taken.At theend of the downtrend,it capturesthe point where price dropped sharplyprecisely. “28 Currency Pair Best Select Indicator”can,among the 28 currency pairs, easily identify which currency has the strongest trend,butit does not guaranteehowthings will develop thereafter,.It capturesthe“instant maximum wind speed”of the trend,but if that happens to be the very bottom,whether the trend will end afterward,needs to be confirmed on the chart—this serves as a good example.
“28 Currency Pair Best Select Indicator”can,among the 28 currency pairs,easily identify which currency has the strongest trend.Also,the “28 Currency Pair Divergence Comparison Indicator”will,among the 28 currency pairs,tell youwhich pair has the largest degree of divergence.From all currency pairs,youcan decide at a glance which pair to trade—an excellent indicator.
“28 Currency Pair Best Select Indicator”

https://www.gogojungle.co.jp/tools/indicators/35128
3. Since2021,May, trackingEURJPY—how has it moved?
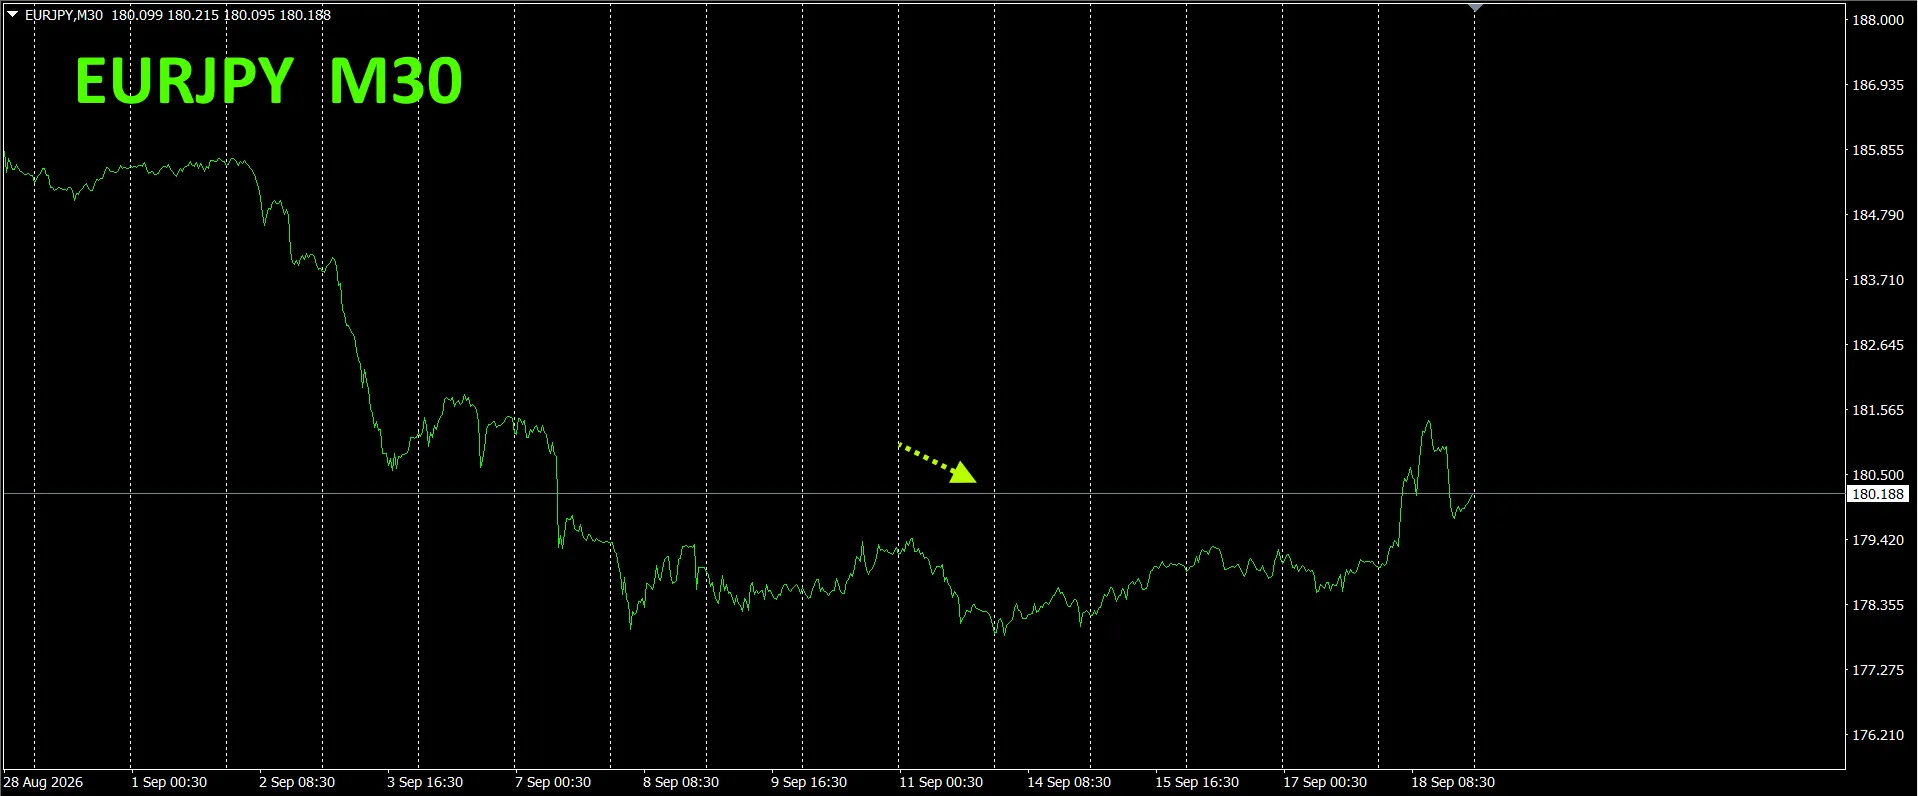
Since 2021,May,we have been trackingthe movement of EURJPY.
To see the overall flow,about the last3 weeks are shownon a 30-minute chart
Last time,we wrote as follows.
Pinkis EUR,greenis JPY.The vector ofEURisslightly downward from horizontal, and JPYis pointing upward.From the currency strength chart, EURJPYisexpectedto decline going forward.
AsJPYweakened,EURJPYhasmoved slightly upward.
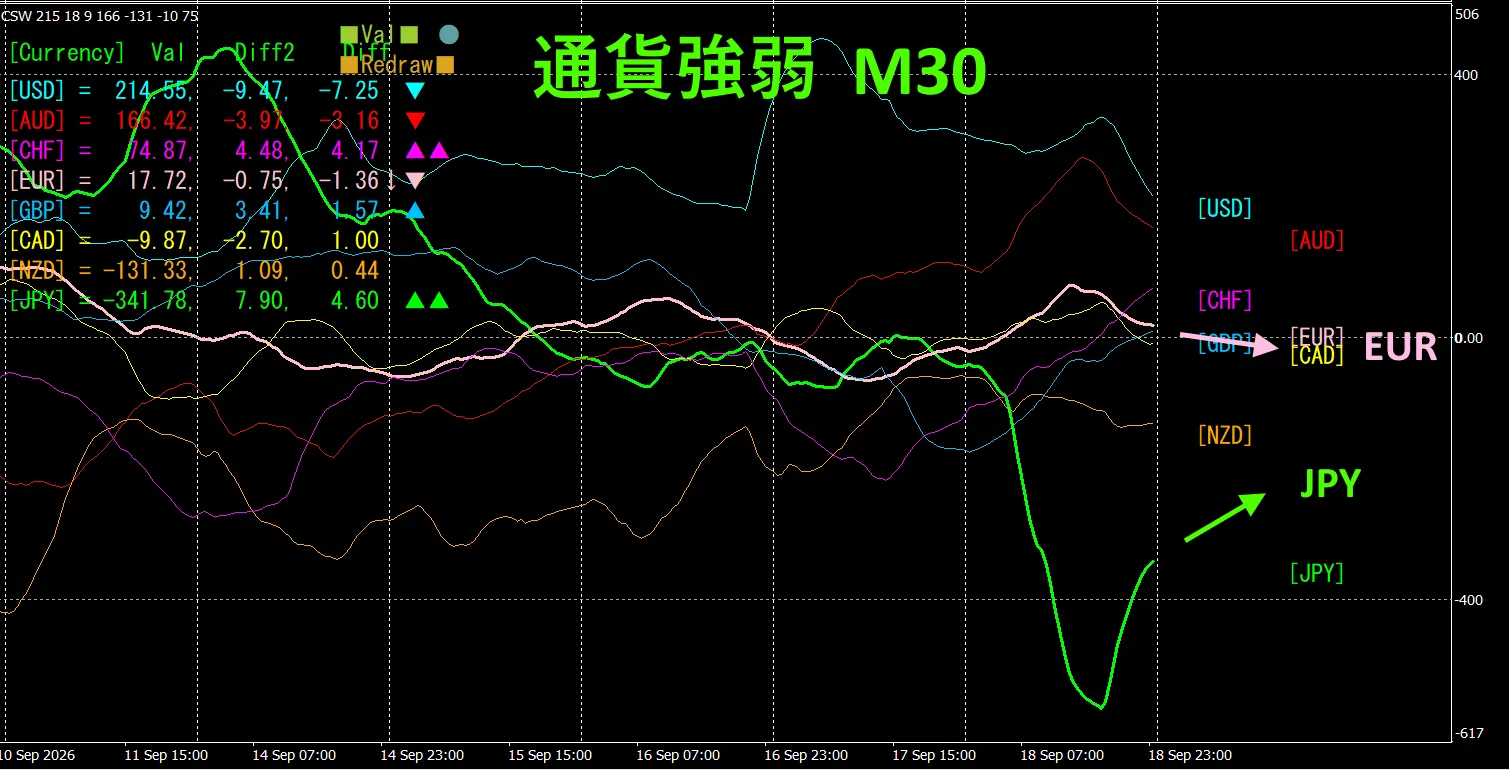
This is the30-minute currency strength chart.
Pinkis EUR,greenis JPY.The vector ofEURisslightly pointing downward from horizontal,but JPYisrebounding from the bottomand pointing upward.From the currency strength chart, EURJPYisexpectedto decline going forward.
4. Tried using the new indicator Dual_MACD_Trend_Indicator
Please see the following for the new indicator “Dual_MACD_Trend_Indicator”.
MT4version:https://www.gogojungle.co.jp/tools/indicators/62199
MT5version:https://www.gogojungle.co.jp/tools/indicators/62202
This indicator clearly shows the trend direction with colors.If the color bar isLimeit’s a buy, if it’s Redit’s a sell,making it easy to understand and use even for beginners.If the bar is green, it’s an uptrend,if red, a downtrend,and if there is no color, there is no trend.Because it uses color,you can grasp the trend state at a glance.
We introduced this indicatorto AUDJPYon the1-hour timeframe.
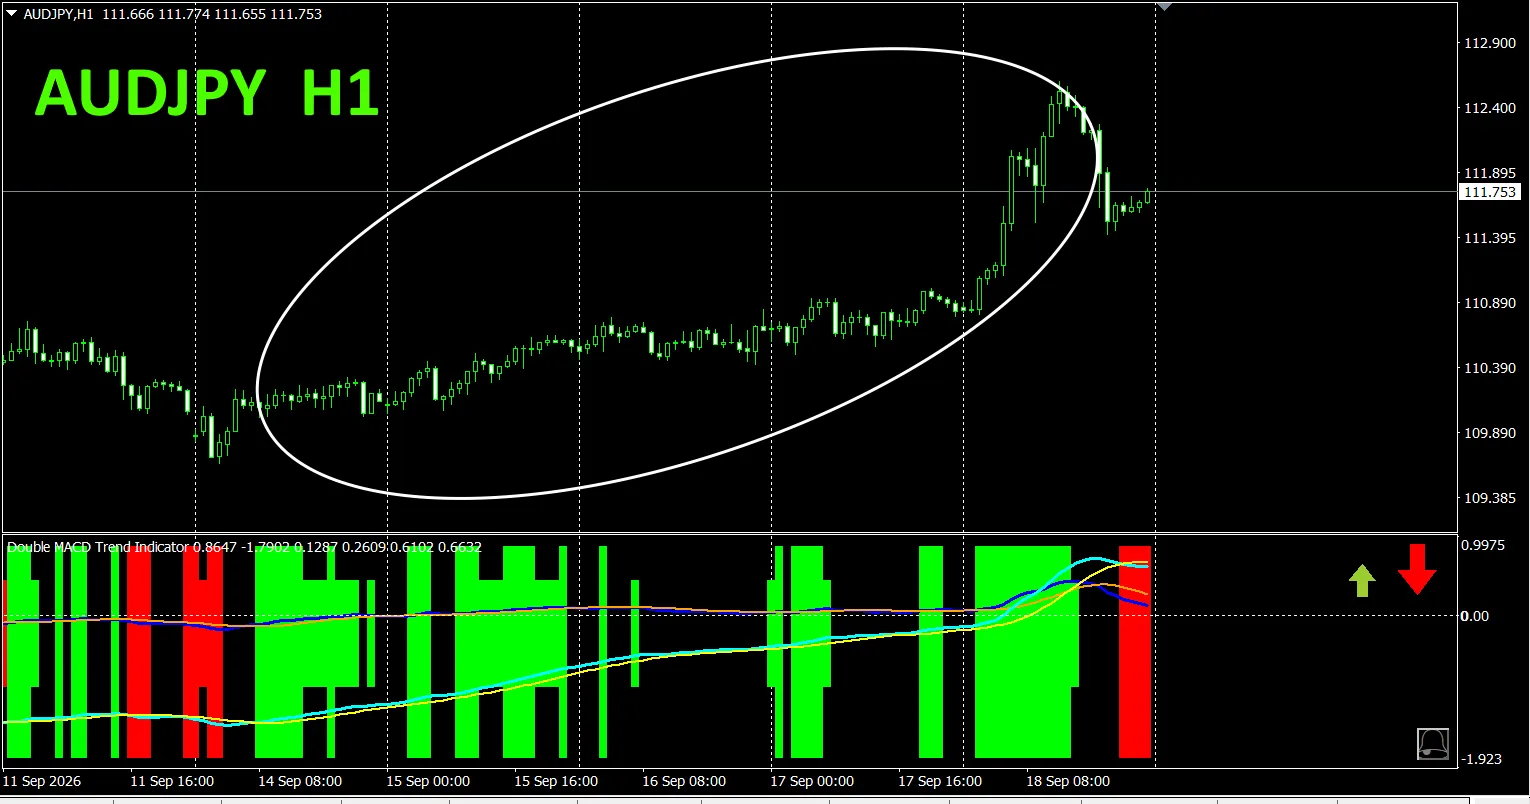
The sell zone in red,and the buy zone in green,are neatly separated,making trading easy at a glance.In the figure above,you can simply buy in the white oval areas where it is green.The long-termMACDslope of the indicator is also informative.If the long-termMACDis sloping down to the right, it’s a sell,if sloping up to the right, it’s a buy.
In this case,the green continued for a long time,so if you had held a buy position,about240 pipsof profit could have been gained.
With “Dual_MACD_Trend_Indicator”,youbuy in green zones,sell in red zones,and do not trade otherwise—just follow this simple rule.
“Dual_MACD_Trend_Indicator”will ensure,you no longer hesitate about trade direction.
Note,“Dual_MACD_Trend_Indicator”has been upgraded,with bar displayin twolevels,andthe trend directions of the toptwohigher timeframes shown by arrows.
5. “Trend_Color_MA_MTF”has beennewlyreleased
From the product page
“Trend_Color_MA_Dual_MTF”was,developed to transform your trading.This tool is not just a moving average.It visualizes trend direction with“color”,and the moment an opportunity arrives,with“sound”and“notifications”it informs you,acting as your dedicated assistant.
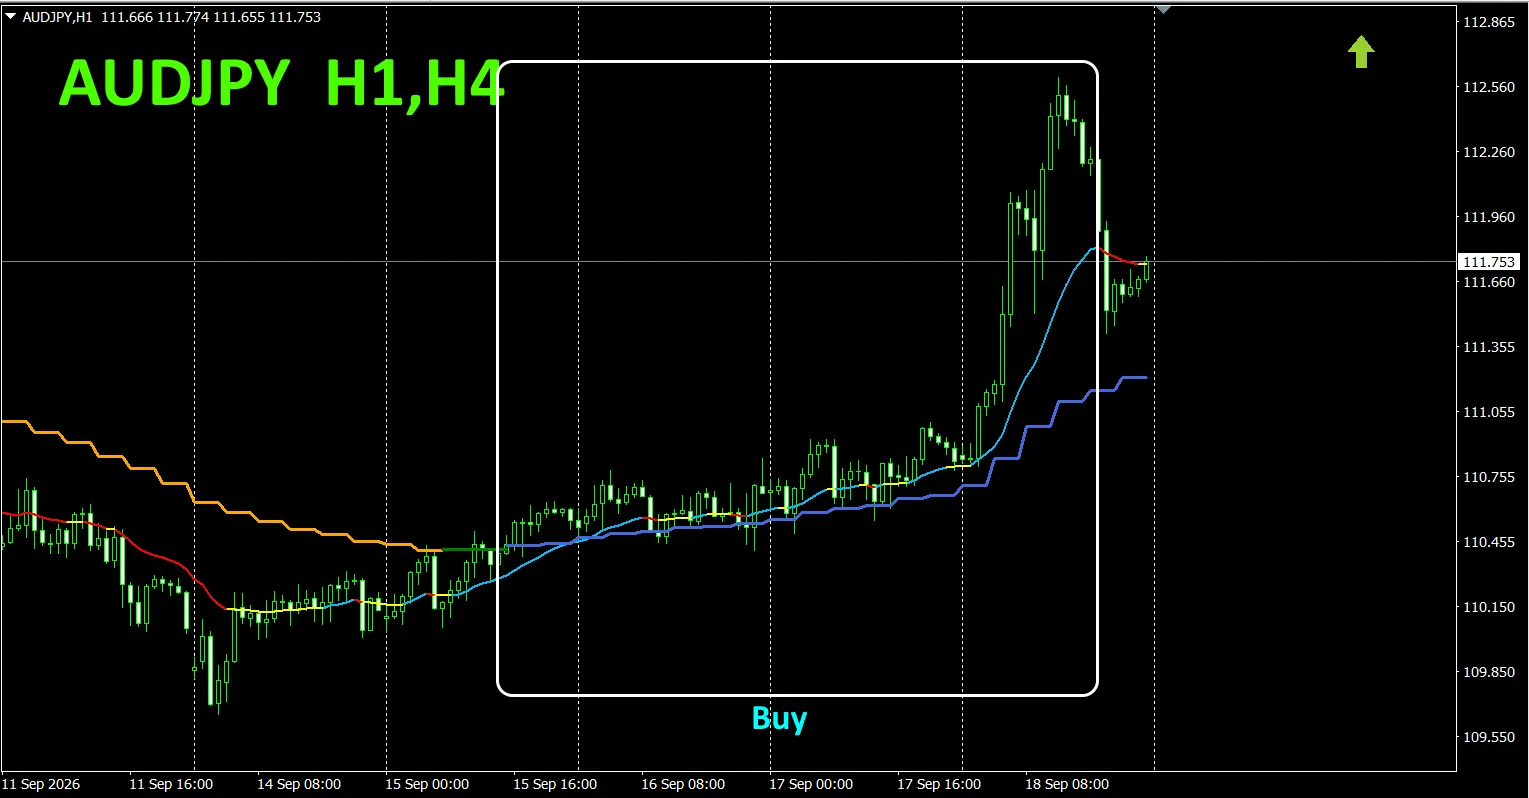
As an example,on the AUDJPY1-hour chart, we displayedthe 4-hour moving average simultaneously.
The jagged, step-like lineis the4-hour moving average. The 1-hour moving average andthe 4-hour moving average,are shown in blue hues during uptrends,and in red hues during downtrends,sothe trend direction of the current chart,and that of the higher timeframe,can be identified at a glance by color.
When the higher timeframe and current timeframe colors align in the same hue,sell if they are red hues,buy if they are blue hues.
In the figure above,focus on the area enclosed by a white rectangleand trade long.
For details,please see the following link.
https://www.gogojungle.co.jp/tools/indicators/75985
“8CFD Visualization IndicatorAny version”
https://www.gogojungle.co.jp/tools/indicators/32288
“ToreTore Indicator”
https://www.gogojungle.co.jp/tools/indicators/50115
“TrendLine-EX”
https://www.gogojungle.co.jp/tools/indicators/42257
“8C Currency Strength Visualization Indicator”please,refer to the following pages.

MT4version https://www.gogojungle.co.jp/tools/indicators/39150
MT5version https://www.gogojungle.co.jp/tools/indicators/39159
[My listed products]