

2026/9/19 Dollar/Yen, Gold, SP500, and Nikkei 225 environment

For behavior verification, we provide a weekly movement video of the USD/JPY.
USD/JPY
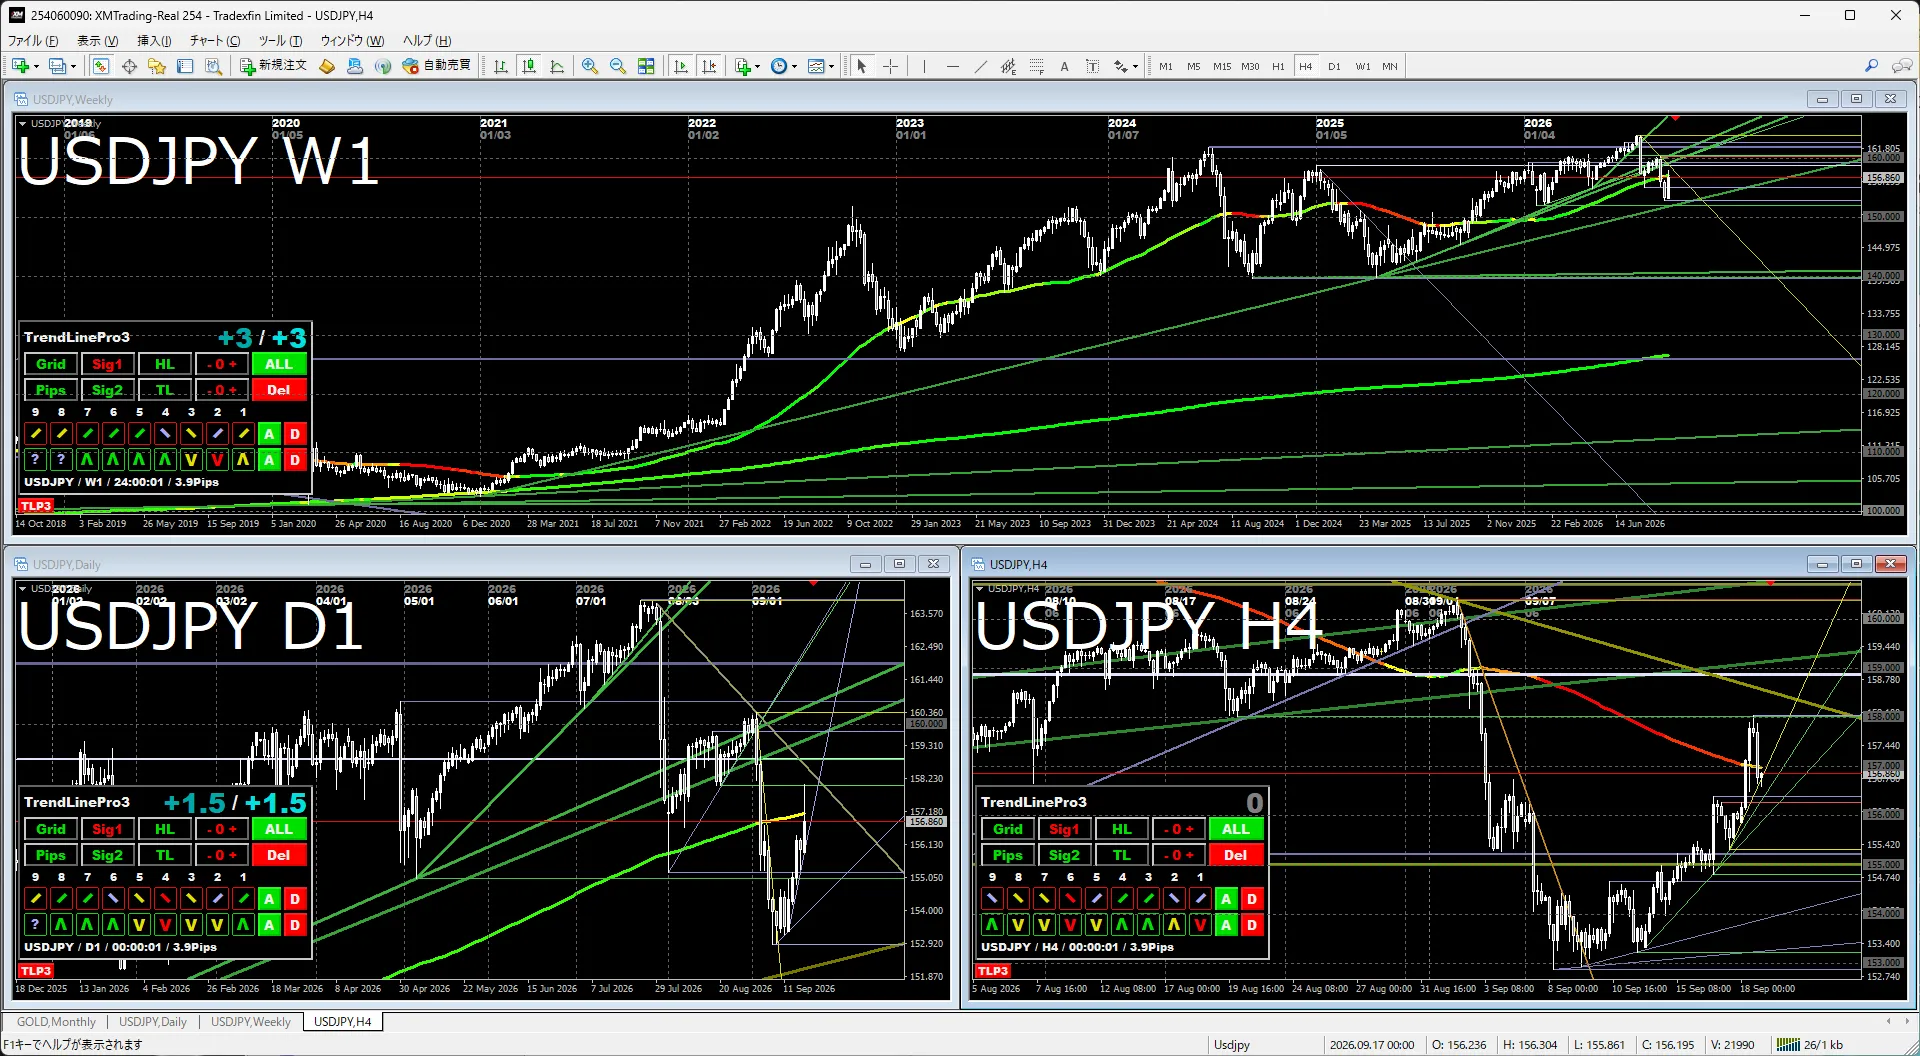
WeeklyThe long-term trend has not broken, but the upward trend from April 2025 has ended, and the upward movement has cooled. In the near term, the area around 152 yen, where the next support level (green horizontal line) and the trend line (green diagonal line) overlap, is expected to be strongly watched. If it rebounds here, it will likely range sideways; if it breaks, the next target would be around 140.
Daily Chart / 4-HourThe blue daily trend line with a downward slope is a key level to watch. In the near term, it is likely to move sideways within the compatibility zone defined by the lower resistance mentioned above and the daily trend line. Based on the strength of the line alone, a breakout to the upside is likely afterward.
Gold
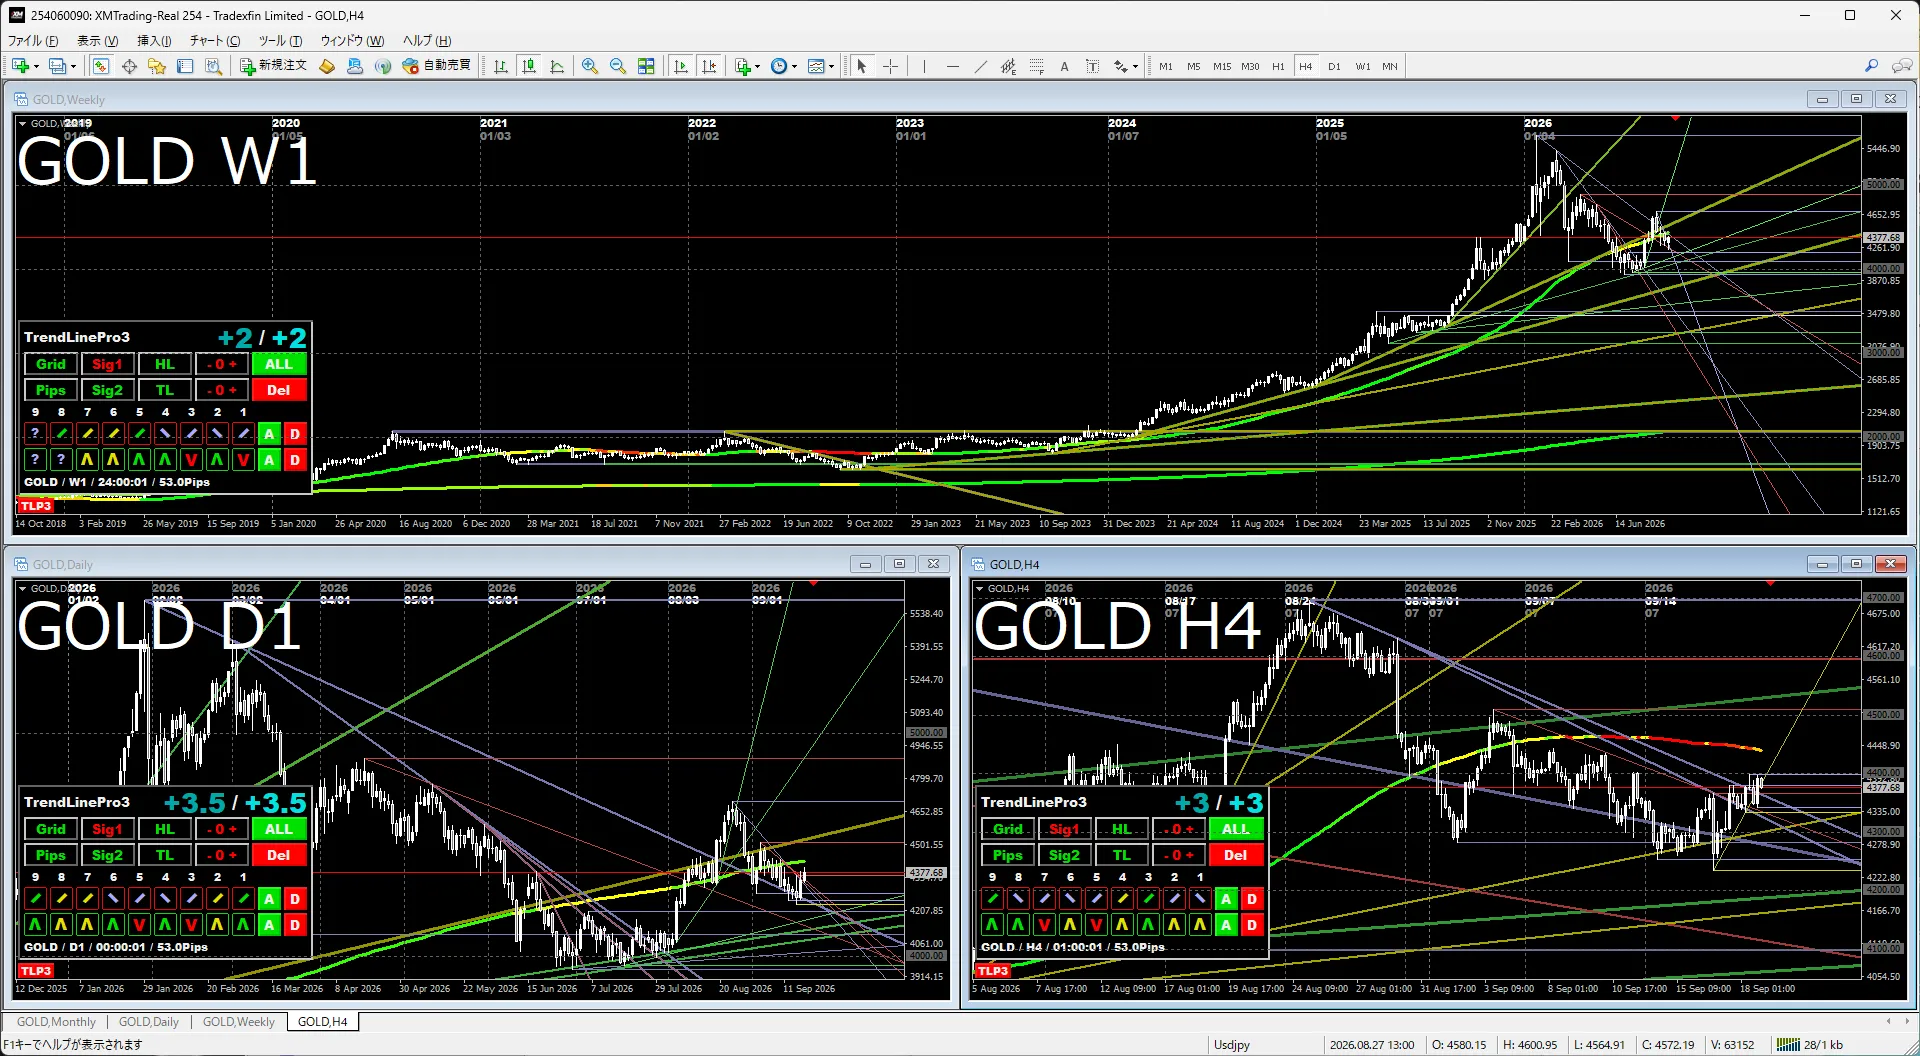
WeeklyAs currency value is perceived to be weakening, gold is expected to rise in the long term. Buying pressure should be strong, but in the near term, it is still in a downtrend with new lows and lower highs. If the upside is weak, a break below 4,000 is likely, and a break below could bring 3,500 into focus.
Daily Chart / 4-HourIn the near term, it is an environment where a rise is expected if it breaks above the blue trend line. However, the 4-hour MA is starting to slope downward, giving the impression that sideways movement may continue.
S&P 500
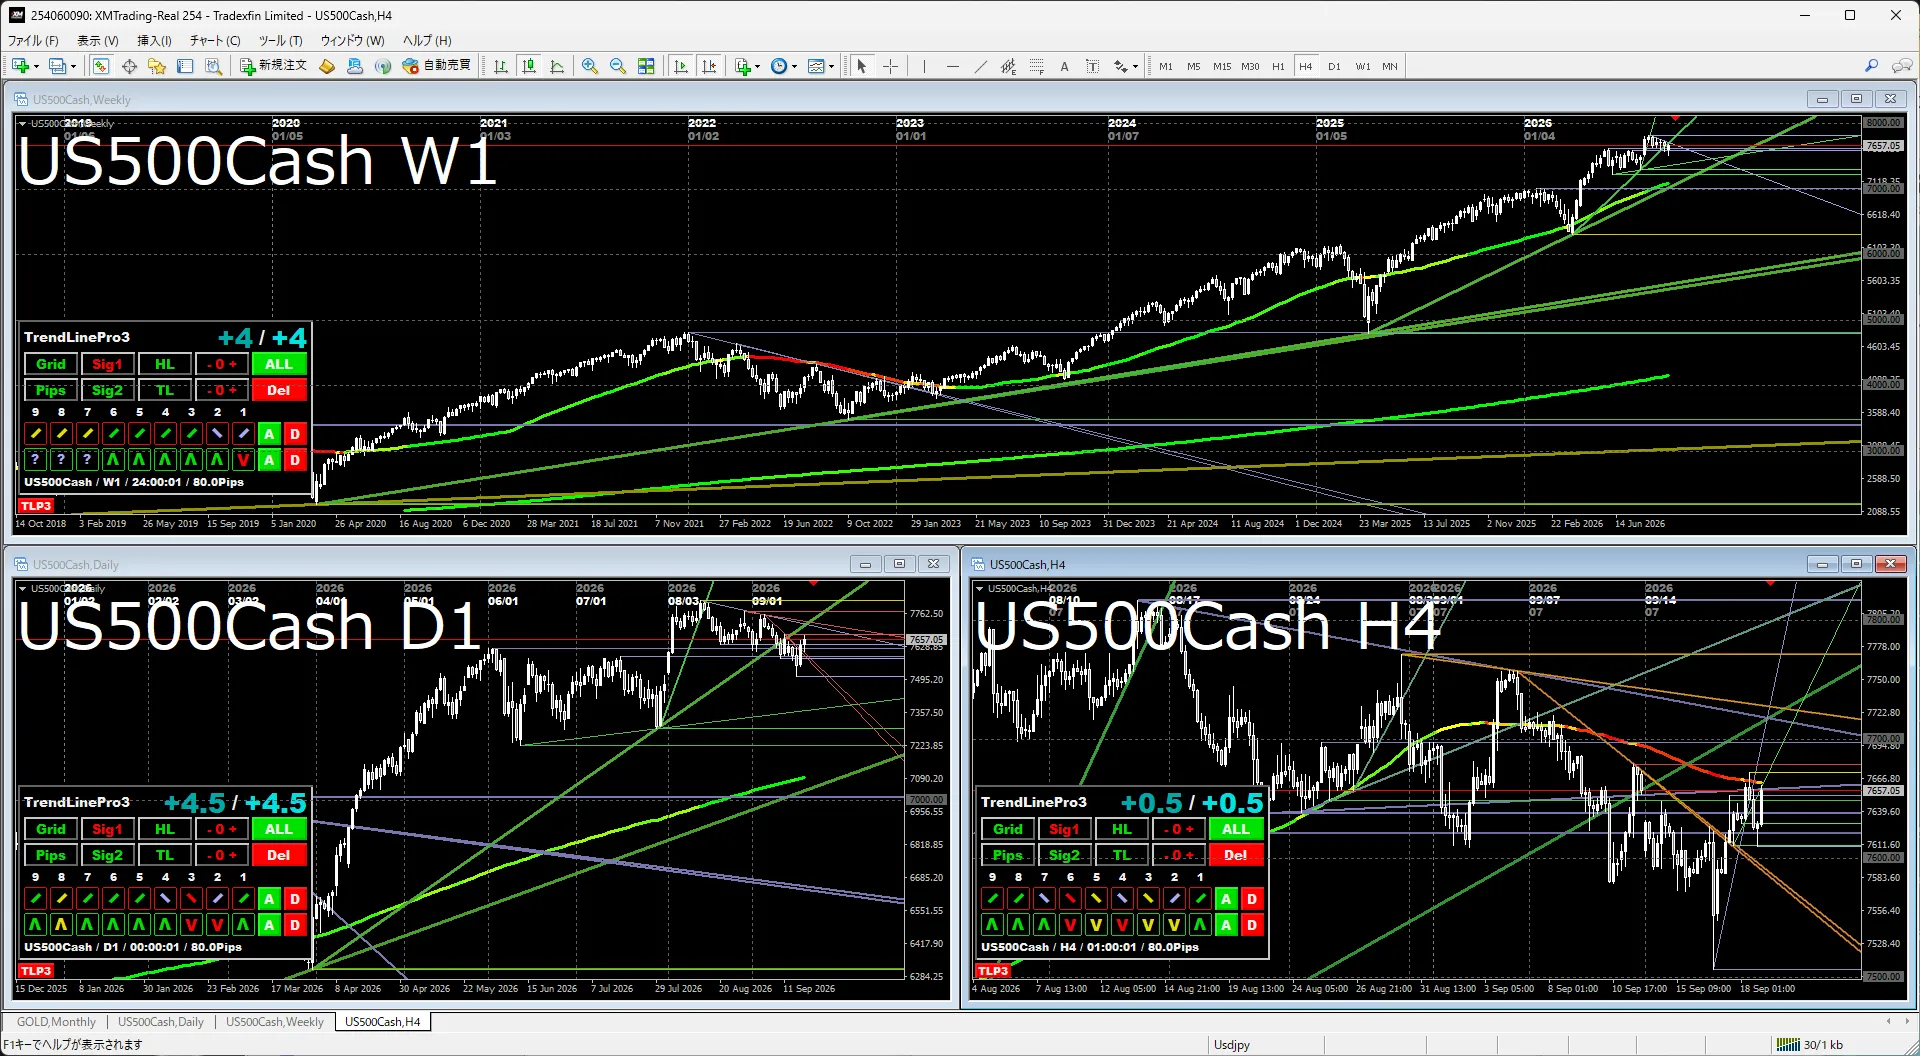
WeeklyA new high has been surpassed and the uptrend continues. Culturally, there is a tendency to buy. The near-term upside around 8,500 is in sight, but we are considering reducing positions before reaching that level.
Daily Chart / 4-HourFrom the recent downtrend that did not fully retrace, the next move is likely to be a solid rise. However, the magnitude of the bounce may be small. If the downward-sloping trend line is broken to the upside, buying is likely to come in.
Nikkei 225
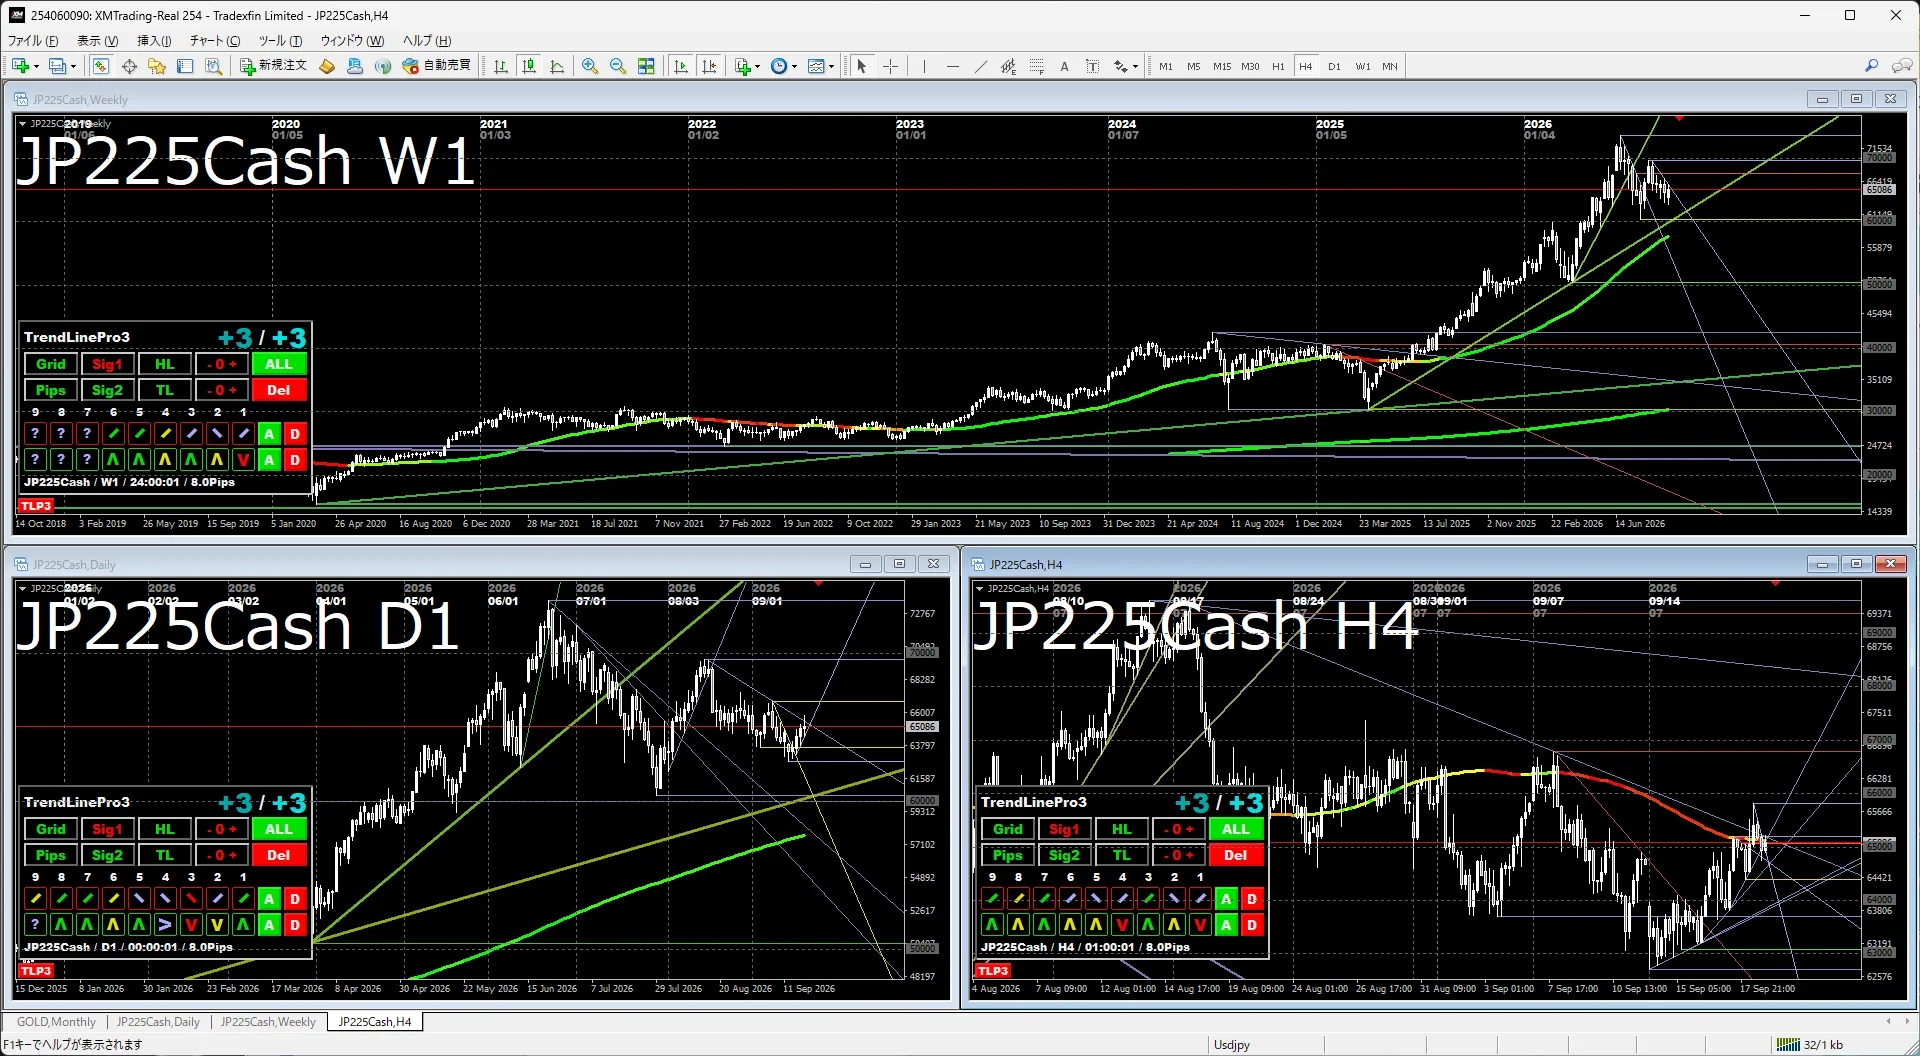
WeeklyThe uptrend is continuing, but it remains uncertain whether it will rise rapidly to the near-term upper limit of 80,000.
Daily Chart / 4-HourHere too, in a downside phase, it does not fully retrace, so a small-scale upside is possible. It seems that a breakout above 70,000 might be the turning point threshold.
The indicators in the attached image use the following indicators.
If you are interested, please take a look.