
As of the weekend of 9/19, USDJPY (ABCD analysis) weekly -1σ and return to the daily 20SMA completed → next week downtrend?
This article outlines the situation afterthe ABCD analysis of USD/JPY for the weekend of 9/12the subsequent situation(as of the weekend of 9/19).
Articles as of the 9/12 weekend
Article as of the morning of 9/15 (Tue) 6:00
Article as of the morning of 9/16 (Wed) 6:00
Article as of the morning of 9/17 (Thu) 6:00
<Main Points>
●As of the weekend of 9/19, the return to the weekly -1σ and 5SMA and the daily 20SMA has been completed, therefore, we mainly expect the following movement for the week of 9/21–9/26 (weekly band walk from -1σ to -2σ/-3σ), with the weekly upper shadow bearish candles indicating a decline and the movement is anticipated as a main scenario.
●Candlestick and lower timeframe alignment leads to the following combinations.
<This Week>WeeklyOne bullish candle≈ DailyDescending BC≈ 4-hourRising ABCD
<Next Week>WeeklyOne bearish candle≈ DailyDescending CD≈ 4-hourDescending ABCD
●Entry timing on the 4-hour chart,the timing of support-resistance reversal at 4-hour +1σ,the timing of support-resistance reversal at 4-hour 20SMAthe timing of support-resistance reversal at 4-hour 50SMA,, in that order, increasing confidence.
●If price breaks upward, the upside becomes invalid,expect price to move back toward the line where the yellow 400SMA and the yellow five rising trend line (return move) overlap...
<USD/JPY 20SMA ABCD Analysis (Overall)>
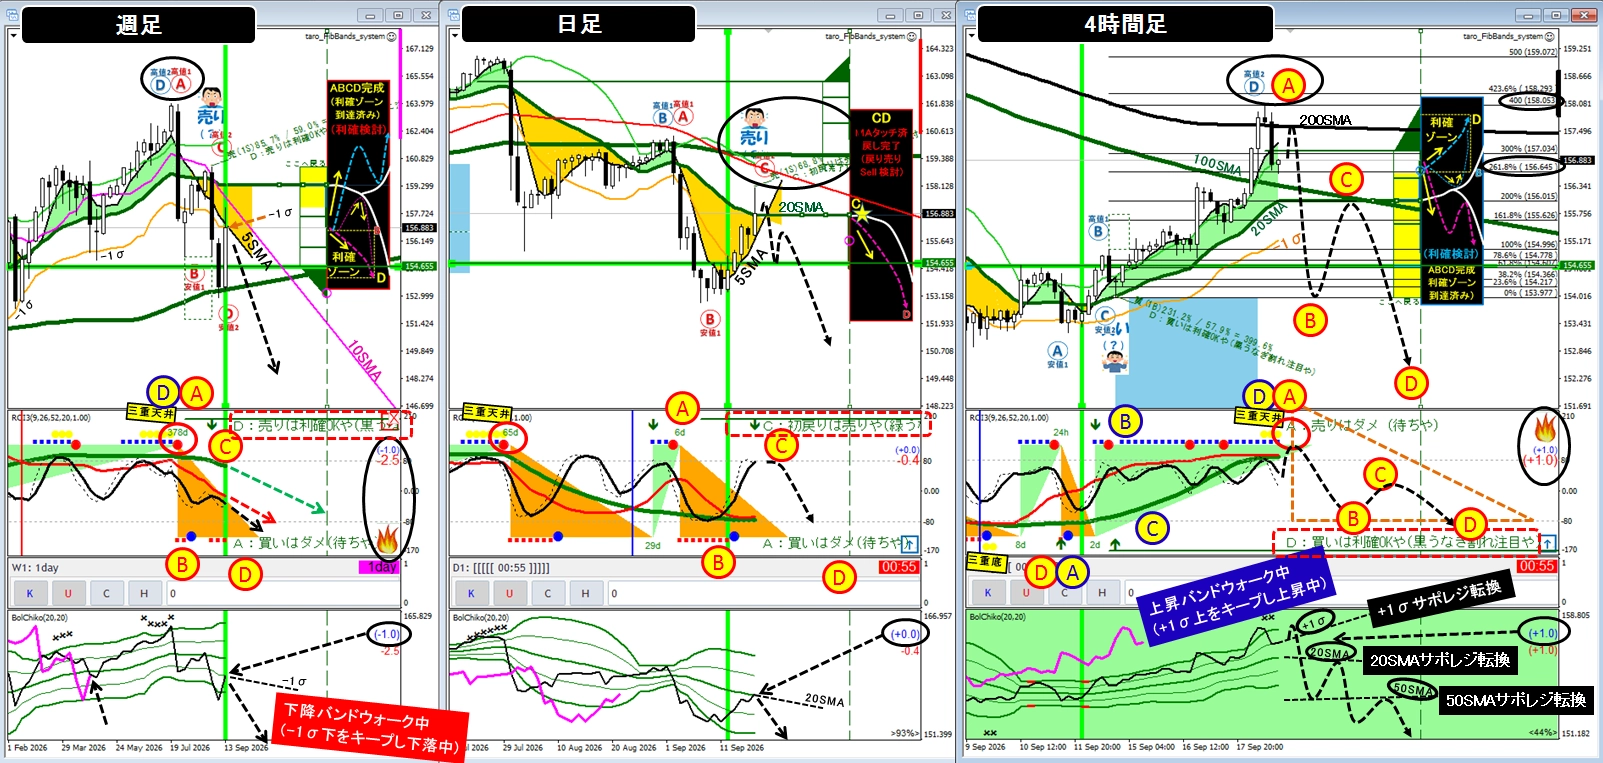
●The chart above is the USD/JPY 20SMA ABCD analysis chart (weekly/daily/4-hour) as of the weekend of 9/19.
●A green vertical line is drawn at 6:00 on the morning of 9/14,so please check the movements of each chart for this week..
●This week's movement showsone bullish candle, returning to the line where the 5SMA and -1σ overlap (movement within the range of theDescending CD).
●Viewed on the daily chart, the price rose as the Stochastic moved from bottom to top, with a resistance-turned-support at the 5SMA maintained above it, corresponding to the riseDescending BC
●On the 4-hour chart, the price reversed at 20SMA and then held above 20SMA, briefly pushing above 200SMA, achieving a rise,toward the vicinity just above 20SMA,corresponding to rising ABCD
●Candlestick and lower timeframe alignment leads to the following expectations.
<This Week>WeeklyOne bullish candle≈ Daily≈ 4-hour
<Next Week>WeeklyOne bearish candle≈ DailyDescending CD≈ 4-hourDescending ABCD
●Weekly Descending CD generally ends when the price declines below the 5SMA and -1σ, sowhether a monthly bearish candle can be formed from 9/1 to 9/30 (8 more trading days) is key to whether USD/JPY can enter a genuine decline.
(If the weekly price falls near the 200SMA on the weekly timeframe, the end-of-month price could be confirmed below -1σ)
<Side Note>Basketball anime Slam Dunk offers a framework for entry points. For example,entry by selling (short) at the point D of rising ABCD, which becomes the A point of falling ABCD, to target the movement of falling AB would be the method aligned with Slam Dunk (the “D” in a dunk shot). Thenshort at point C and take profit at point D is thought of as the “Commoner Shot.”The weekly DA is Slam Dunk-like, but the targeted pullback in the next week may form as a DA on the 4-hour chart that, on the daily chart, appears as point C, leading to debate whether it is Slam Dunk or Commoner Shot.This is a point of discussion.We do not know how far the 4-hour D point will rise,but a break below +1σ and reversal at support would trigger profit-taking,and if it breaks below 20SMA, profit-taking would accelerate, pushing price down to ascending point C and returning margin to hands, after which the price may turn downward toward the descending C point, triggering long-unexperienced holders to close positions and short-sellers to re-enter, creating a low and continuing downward movement. This is the expected flow (if long positions do not close profits, they may drop until all long positions are closed; if 20SMA is broken, look for profit-taking to take shape).
<USD/JPY (4-hour) ABCD linkage of 20/50/100/200/400SMA>
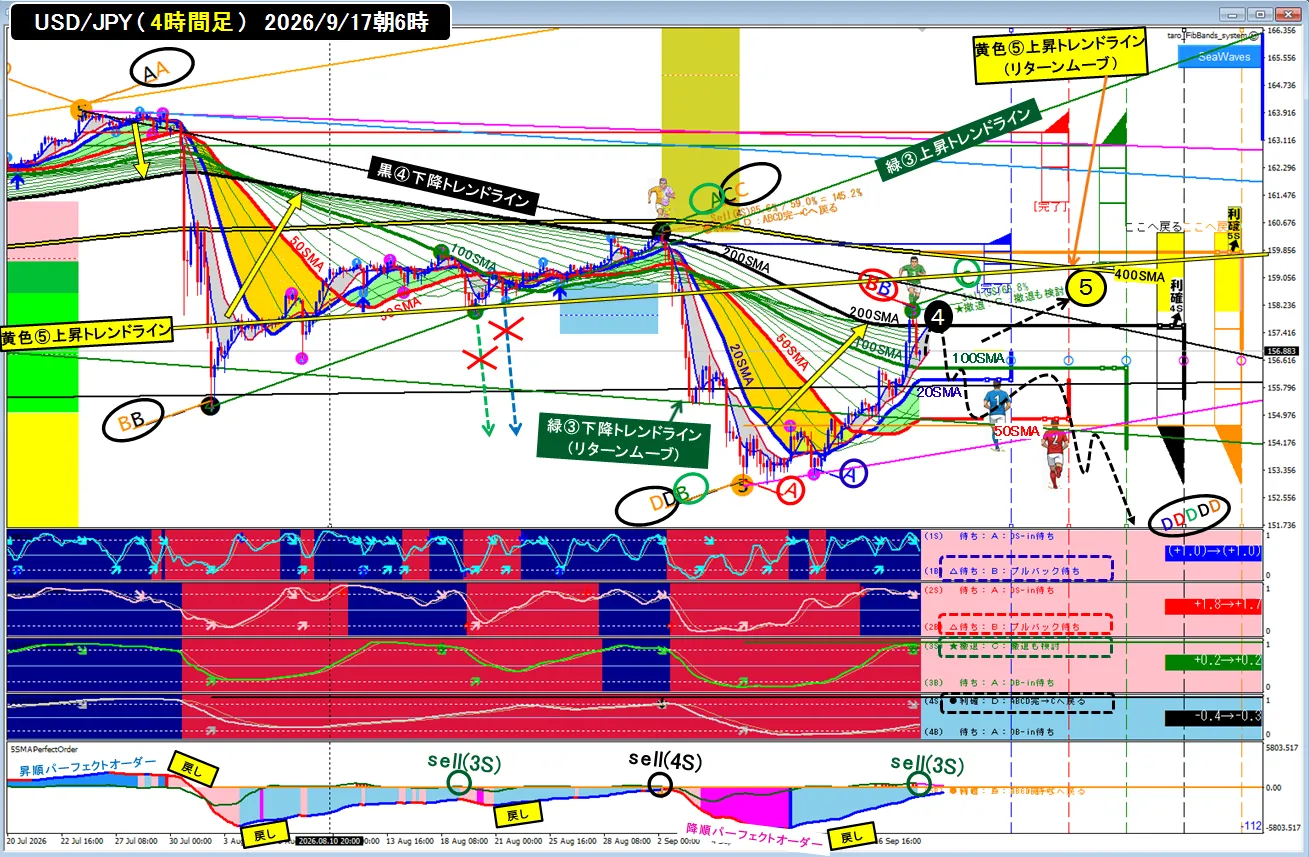
●The chart above is the ABCD linkage chart for the USD/JPY (4-hour) at weekend time.
●ultimately the price rose above the green 100SMA, and after the close the black 200SMA too ended higher, ending the week at a point between the 100SMA and 200SMA
●ABCD analysis from monthly to 4-hour using 20SMA.
●Considering that,I drew next week's movement in black dotted line. (How it moves depends on the moment, so please take this with a grain of salt)
<In Conclusion>
●From experience and chase the quickest scenario, trading sequentially if not satisfied, but
●What actually happens is uncertain, butwe aim for a weekly upper shadow bearish candle next week,targeting a 4-hour descending ABCD (+1σ support-resistance reversal) ≒ Slam Dunk anddescending CD (20SMA support-resistance reversal) ≒ Commoner Shot
<This Week>WeeklyOne bullish candle≈ Daily≈ 4-hour
<Next Week>WeeklyOne bearish candle≈ DailyDescending CD≈ 4-hourDescending ABCD