
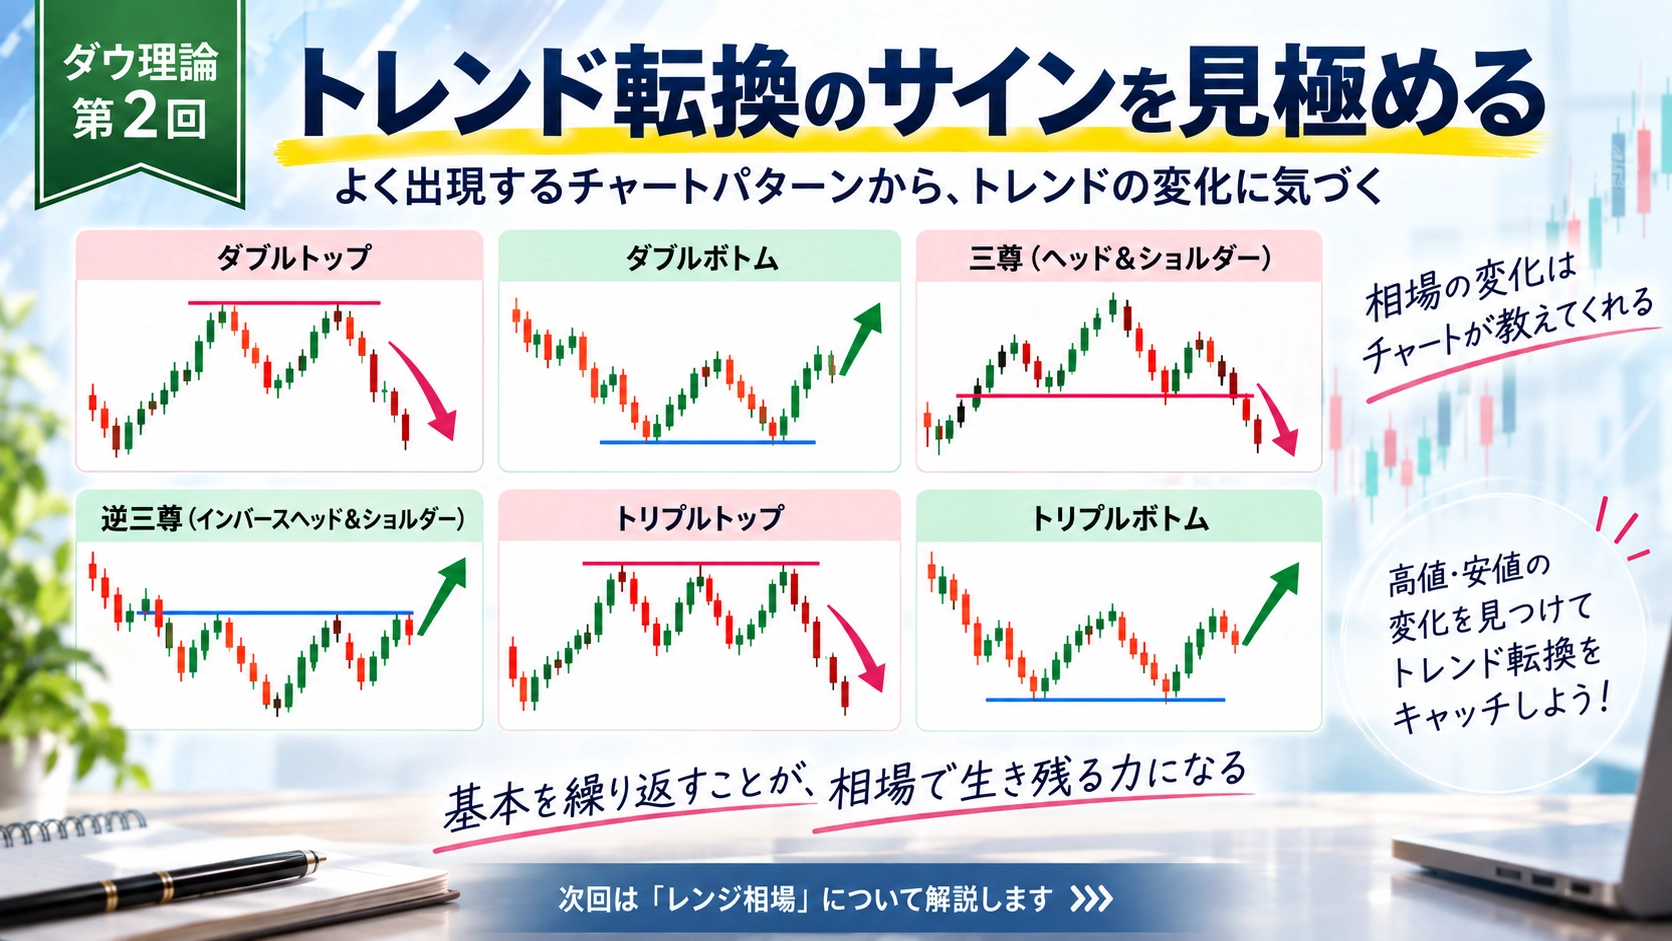
Learn the basics of investing Dow Theory Part 2
Identifying Signs of Trend Reversal
Common chart patterns that help you notice changes in the trend
In the first installment, we learned how to view trends from the movement of highs and lows, a basic of Dow Theory.
So,when does the trend change?
The key is not only to memorize chart shapes, but to watch whether the updates of higher highs and lower lows that had continued until then are starting to fail.Whether the repeated updating of highs and lows has stalledis what to observe.
In an uptrend, “the most recent high cannot be updated → the low that began that high falls below”
In a downtrend, “the most recent low cannot be updated → the high that began that low rises above”
Finding this “change in the flow” is the first step in catching a trend reversal.
Common patterns at the end of an uptrend (top area)
Double Top
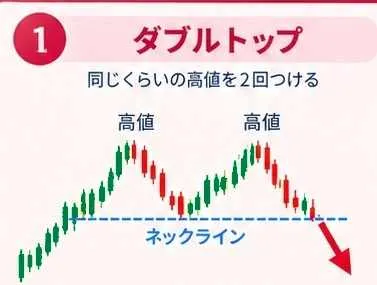
In an uptrend, highs are reached twice, with the second high clearly failing to update the first.
The change “no longer able to update the high” is the initial point of attention.
If the price then falls below the neckline formed between the two highs, it suggests a reversal from uptrend to downtrend.
Triple Top
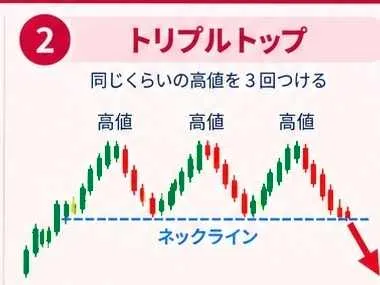
Highs are reached three times but cannot be surpassed, and are bounced in the same price range.
Because the highs repeatedly fail to be updated, attention is drawn to the possibility that the momentum to rise is weakening.
Breaking below the neck line is an important point indicating a reversal from uptrend to downtrend.
Head and Shoulders (Three Peaks)
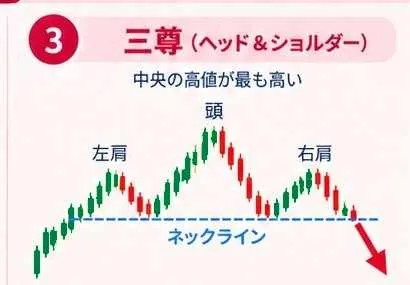
Three peaks are formed: left shoulder, head, and right shoulder, with the central head being the highest representative top pattern.
The right shoulder forms lower than the head, and attention is paid to the flow that breaks below the neck line.
In particular, a break of the neck line is a key point confirming the collapse of the uptrend structure.
Common patterns at the end of a downtrend (bottom area)
Double Bottom
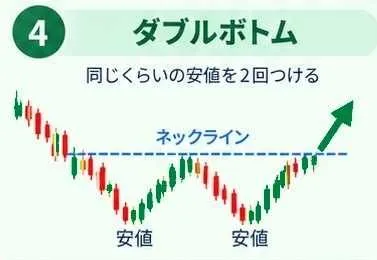
In a downtrend, lows are reached twice, with the second low clearly failing to update the first.
The change “no longer able to update the low” is the first point of attention.
If the price breaks above the neckline formed between the two lows, it suggests a reversal from downtrend to uptrend.
Triple Bottom
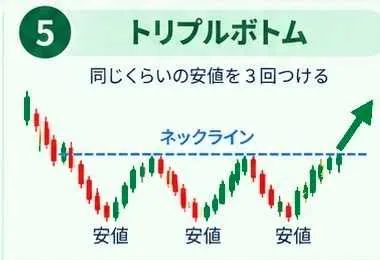
Lows are reached three times but cannot be pushed lower, and bounce in the same price range.
Because the lows repeatedly fail to be updated, attention is drawn to the possibility that selling pressure is weakening.
Breaking above the neckline is an important point indicating a reversal from downtrend to uptrend.
Inverse Head and Shoulders
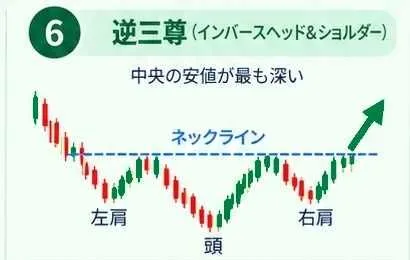
Three valleys are formed, with the central trough being the deepest representative bottom pattern.
Look for the flow where a deeper low cannot be made on the center, and the right side begins to rise from the lows.
Breaking above the neck line suggests a reversal from downtrend to uptrend.
In actual charts, what should you look at?
We have looked at patterns up to now, but on real charts, it isn’t always a perfectly clean shape.
What matters then is,to look at how the highs and lows change, rather than just searching for the pattern name.
1) Are the highs rising?
2) Are the lows also rising?
3) After that, has the high been unable to be updated?
4) Has the price broken below a previous important low?
If the changes from 3 to 4 appear, it is material evidence that the uptrend’s flow is starting to collapse.
For example, previously the price kept updating to higher highs, but then could not surpass the next high.
Moreover, if subsequently the price breaks below the previous low,“the upward trend that had continued is breaking down”and you can read this from the chart.
1) Are the lows getting lower?
2) Are the highs also getting lower?
3) After that, has the low been unable to be updated?
4) Has the price broken above a previous important high?
If changes from 3 to 4 occur, it provides evidence that the downtrend’s flow is starting to break down.
In other words, on actual chartsfocus on where the flow of highs and lows has changed, not just on what pattern it is.
And chart patterns like double tops and head-and-shoulders can be used as assistance to identify that change.
These market basics aren’t only for beginners.
Even for intermediate traders who think, “I know Dow Theory,” and “I know how to read highs and lows,”in actual trading, what you think you know may not be what you can actually do, and judgments can become ambiguous.
“Knowing” and “being able to do” are not the same.
Even pro baseball players, regardless of how great they are, do not neglect basic practice like catching and discipline drills.
That is whyrepeating the basics is important.
Dow Theory is the same.
It isn’t a one-time learning; review many times, confirm many times, and practice repeatedly on real charts.
And when you are unsure or feel you’re not winning often,return to the basics and re-evaluate.
Even when you think you know it, repeating it many times engrains it in your mind and your sense.
I believe that is important for any trader.
“Because it’s the basics, we should verify them again and again.”
In this series, we’ll organize the market basics one by one, including such essential but sometimes overlooked points.
Next Preview
Next time,How to identify range-bound marketswill be explored, focusing on the differences from trend markets and the movements of highs and lows.
※Chart patterns are merely one way to view the market and do not necessarily indicate an imminent trend reversal.