

Nikkei 225 Futures Simple Trade September 17, 2026 (Thu) Review (Chart Analysis)
Good morning!
Let's review yesterday's trade results.
The chart below shows the entry point that was distributed on the morning of September 17.
On this day, the key points to interpret the market were as follows. The same as the previous day.
① Pay attention to the two-hour MA20, the daily 5-day moving average, and the weekly 25-week moving average, with a deviation rate of minus 3%.
② If there is a reversal upward, be aware of the four-hour chart plus 2σ above.
The entry was considered by combining this with the reversal point and by judging the candlestick setup.
In the chart below, we will review in order how each price action and actual movement moved.
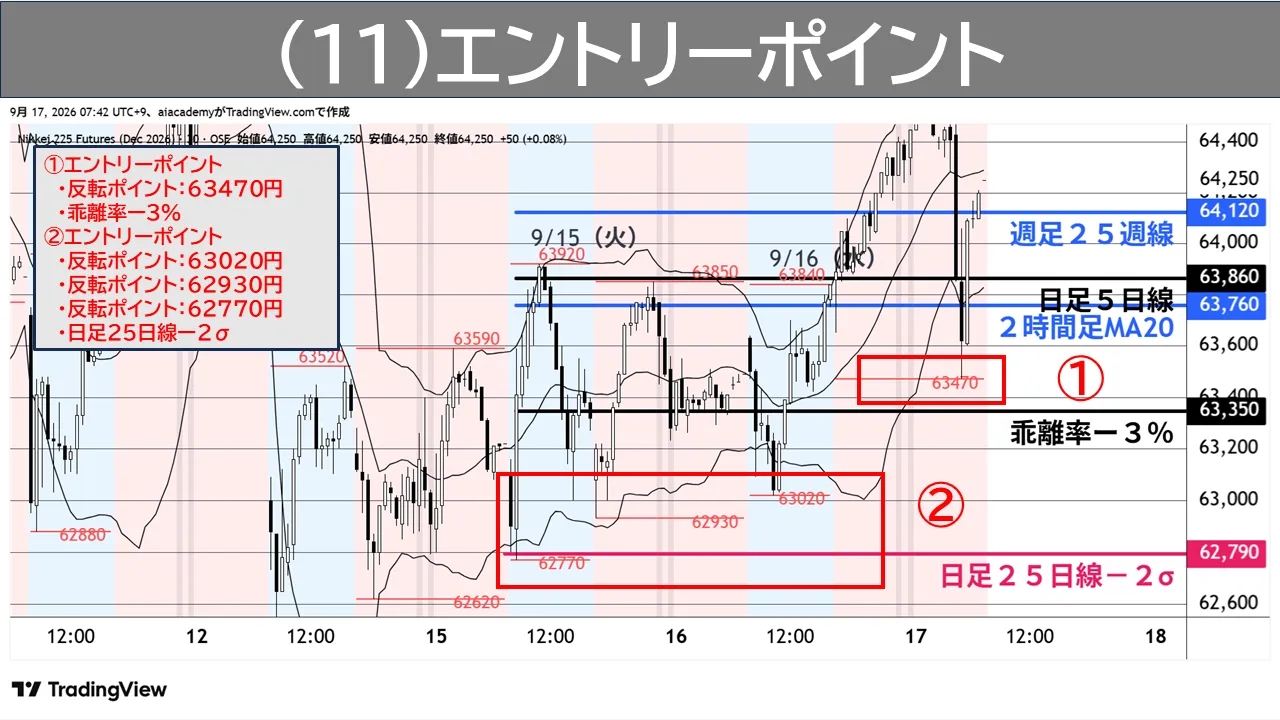
In today's situation, the two-hour MA20 and the daily 5-day moving average overlapped, making it a technically well-expected reversal scenario.
The two points that were difficult this time were as follows.
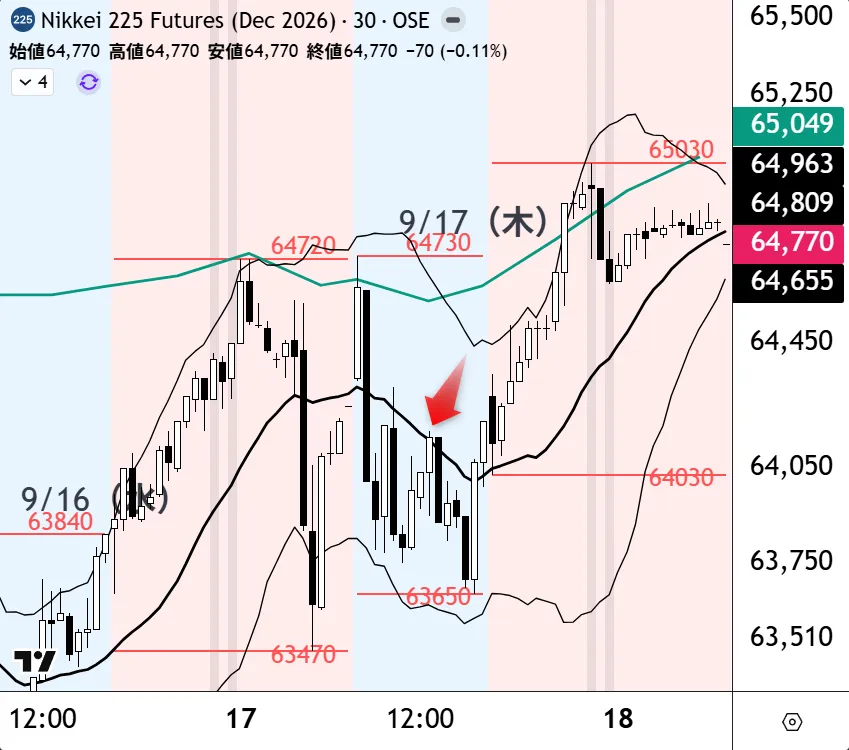
① Whether A1 would occur at the low of the previous night's session (63,470 yen), or whether B1 would occur just before it.
② Whether the early morning rise followed by a fall should be regarded as a “B1 from above.”
In conclusion, the rise at the early morning and the subsequent pullback should be treated as noise, and it was correct to regard it as “B1 from below.”
If these two points could be judged, you could have aimed for an entry at 64,710 yen.
However, since futures cannot be ordered or traded in the last five minutes before close, entry solely in futures would have been timing-challenging.
This is where the strength of CFDs, which offer flexible trading hours, comes into play.
Thank you for your continued support today as well.