

GOLD1 Minute Chart: Recent Entry Commentary
https://www.gogojungle.co.jp/tools/indicators/86097
In the most recent gold 1-minute chart, I will explain the entry.
Of course, there is no 100% win rate in FX, so losses occur when they do.
I believe everyone who is involved in the world of investment understands this.
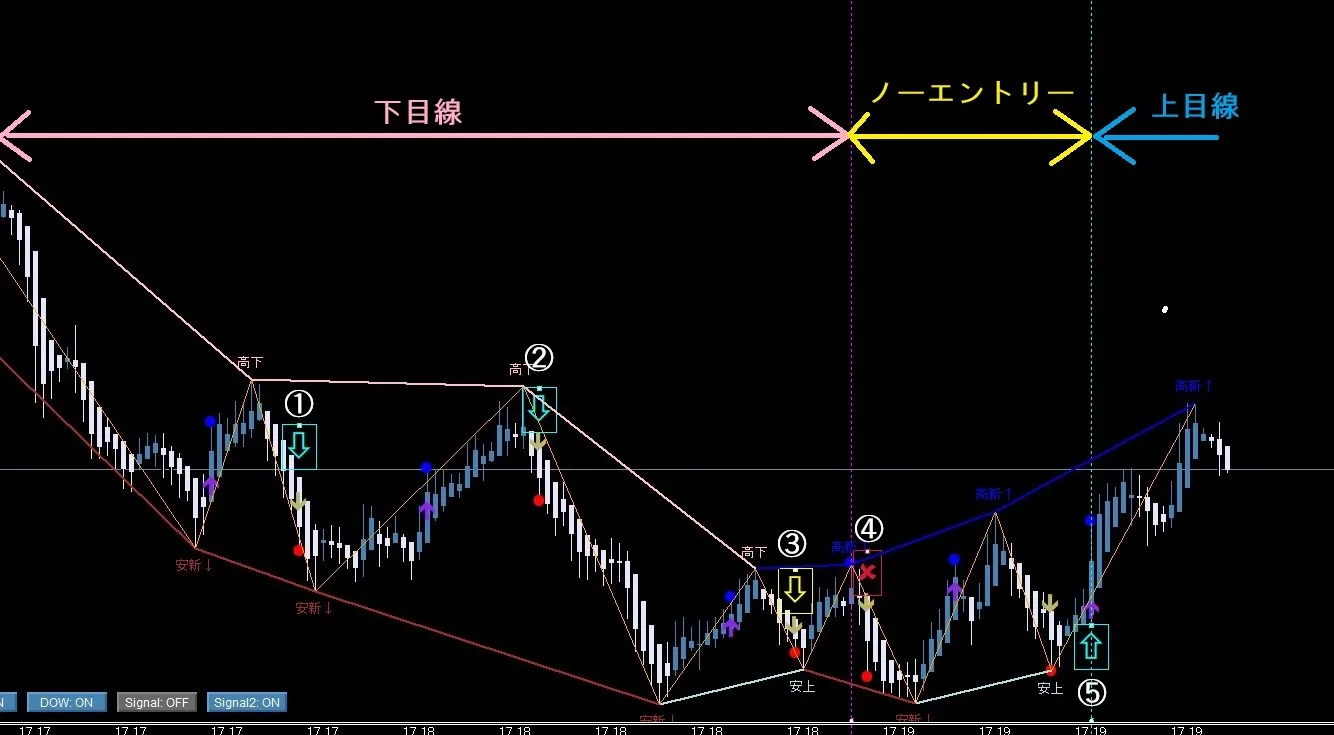
First, in addition to ZigZag waves, the indicator also draws lines connecting the highs with highs and the lows with lows.
This makes the movement of the waves very easy to understand.
In addition, it displays in Japanese whether highs are rising or lows are falling, making it even easier to understand.
From these indicators, we will judge the trend based on Dow Theory.
* Explained in the manual.
Then, as in the image, your line of sight will be determined.
This time, I will explain using the signals from the average-bar method updated today.
* Explaining with a risk-reward ratio of 1:1 as an example.
The point in Image ① is a lower low and a lower high, so short is OK.
Almost stopped out, but moved in the favorable direction and profit was taken.
The point in Image ② is the same as ①, so short is OK.
This one is easy.
If you can extend the profit, you could target around 1:2 to 1:3 reward-to-risk.
The point in Image ③ is likewise short OK, but it hit stop loss…
The point in Image ④ is to be passed over.
The reason is that highs are rising, so a downtrend is not established.
And a while it remains trendless.
This is the point in Image ⑤.
This is a switch to an uptrend with new highs and rising lows, so long is OK.
This one also exits profit smoothly.
Furthermore, for traders who are aware of support and resistance lines, isn’t there a support line drawn a little below the points ③④ in the image?
If so, it would be a complete win.
Support resistance? It is also a high-expected-logic, so while you work on it, learn about resistance and gradually improve your skills ♪