[FOMC Hawkish Passage] Is the 156 yen breakout real? Signals shown by "U.S. 2-year yield at 4.72%" and four indicators + initial judgment rules ahead of the BOJ decisive battle
The U.S. Federal Open Market Committee (FOMC) raised the policy rate by 25 basis points as market expectations had anticipated, lifting the target range to 3.75%–4.00%. Moreover, the vote was unanimous, 12-0.
In the dot plot, the largest point of attention, 16 out of 18 participants anticipated additional rate hikes within the year, and the year-end median was raised to 4.00%–4.25%. Chair Powell also emphasized, “Inflation is too high, too persistent,” and that the broad financial conditions are not yet sufficiently restrictive, presenting a clearly hawkish stance that exceeded market expectations.
Immediately after the announcement, USD/JPY surged into the upper 155s and has stayed in the weekly high range.
However, it would be extremely dangerous to assume that breaking through 156 yen will automatically push the rate straight up to 160 yen.
Friday’s event looms with over 90% priced in for the Bank of Japan (BOJ) rate hike (1.00% → 1.25%). I will整理 the “four monitoring indicators” to clearly assess the 156–157 yen battleground, and explain the initial reaction rules right after BOJ announcements.
Chapter 1: Even with a hawkish FOMC, the market truth is that the 10-year yield does not jump
This FOMC is, on fundamentals, a fully dollar-positive event.
25bp rate hike (3.75%–4.00%) and unanimous vote (12-0)
Dot plot: 16 of 18 participants expect additional rate hikes within the year
Probability of a rate hike in October FOMC: 54% → 56.5%
Powell: denies a sustained improvement in inflation and signals continued strong tightening
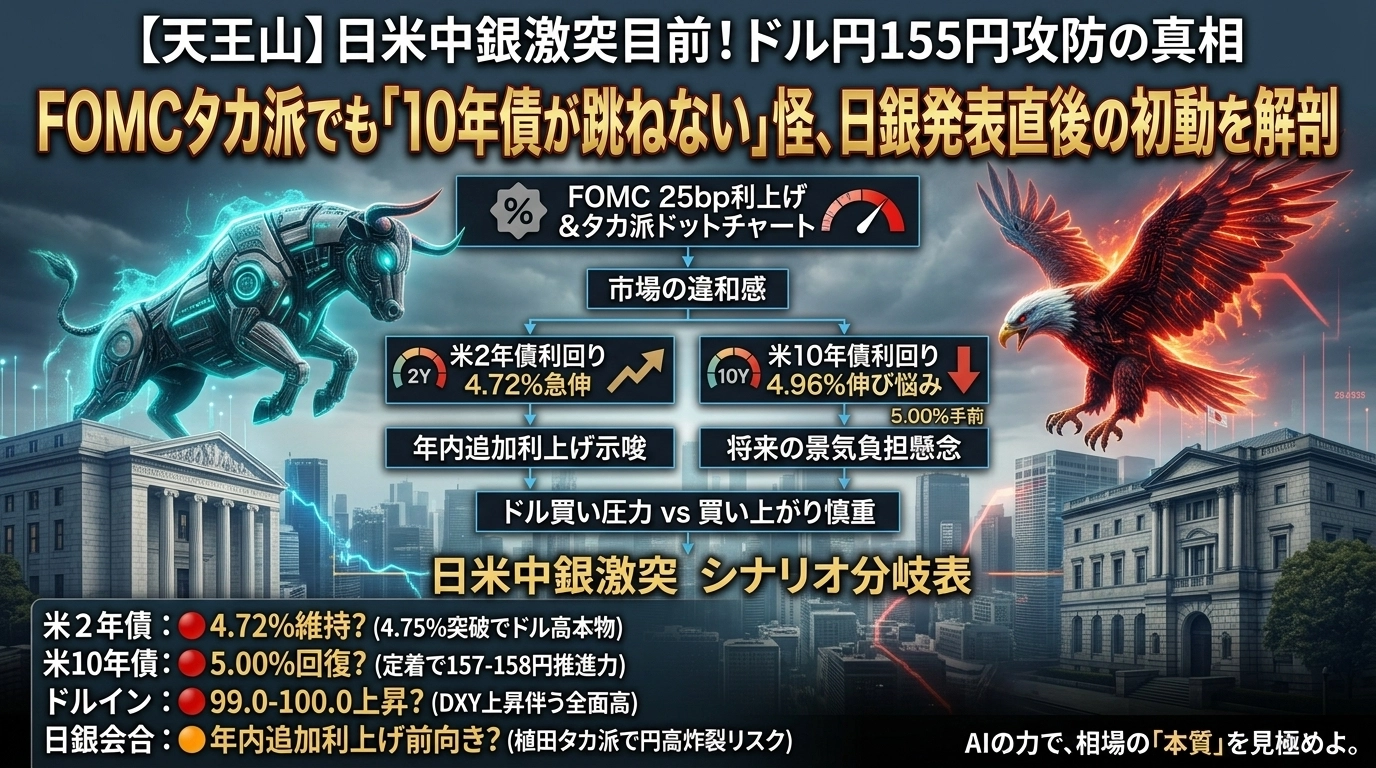
However, there is a notable anomaly when you examine the charts. While the U.S. two-year yield, which is most sensitive to policy rates, jumped to the 4.72% range (highest since July 2024), the U.S. 10-year yield hovered around 4.96%, just short of 5%.
[Market’s Honest Opinion]
U.S. 2-year yield 4.72% (surge)
“The Fed will hike once more.” U.S. 10-year yield 4.96% (stagnating) “If high rates persist, the burden on future economic growth will be heavy.”
In short, while near-term rate differentials are boosting dollar buying pressure, there is a cautious stance toward long-term gains. This explains why the dollar did not surge straight to 157 yen immediately after the FOMC.
Chapter 2: The “Four-Mindicator Monitoring Line” to filter out noise in practice
When the USD/JPY breaks above 156.00, objective figures determine whether it is a real uptrend or merely a scare move (a false breakout).
[Four major indicators to monitor the divergence line]
① U.S. 2-year yield:
【4.72%】 (current) → if it breaks through 4.75%–4.80%, it indicates genuine dollar strength.
If it falls below 4.60%, expectations of further rate hikes fade.
② U.S. 10-year yield:
【5.00%】 → if it stabilizes at 5.00%, it provides strong momentum toward 157–158 yen.
If it falls below 4.90%, upside momentum stalls.
③ Dollar Index (DXY):
【99.0–100.0】 → if DXY rises with dollar buying, the entire market moves higher.
If DXY falls, it’s just a distortion from weak yen.
④ USD/JPY rate:
【155.00 yen】 and【156.00 yen】 → the key gate is whether 156.00 breaks and can hold at 156.30–156.50 after breaking 156.00.
Initial reaction signal
If real upmove is confirmed (follow-through recommended):
USD/JPY up + U.S. 2-year yield up + U.S. 10-year yield up + DXY up (all four indicators rising)
Dangerous false signals (to skip):
If USD/JPY rushes to the 156 handle while U.S. 2-year yield (< 4.70%) and DXY fall.
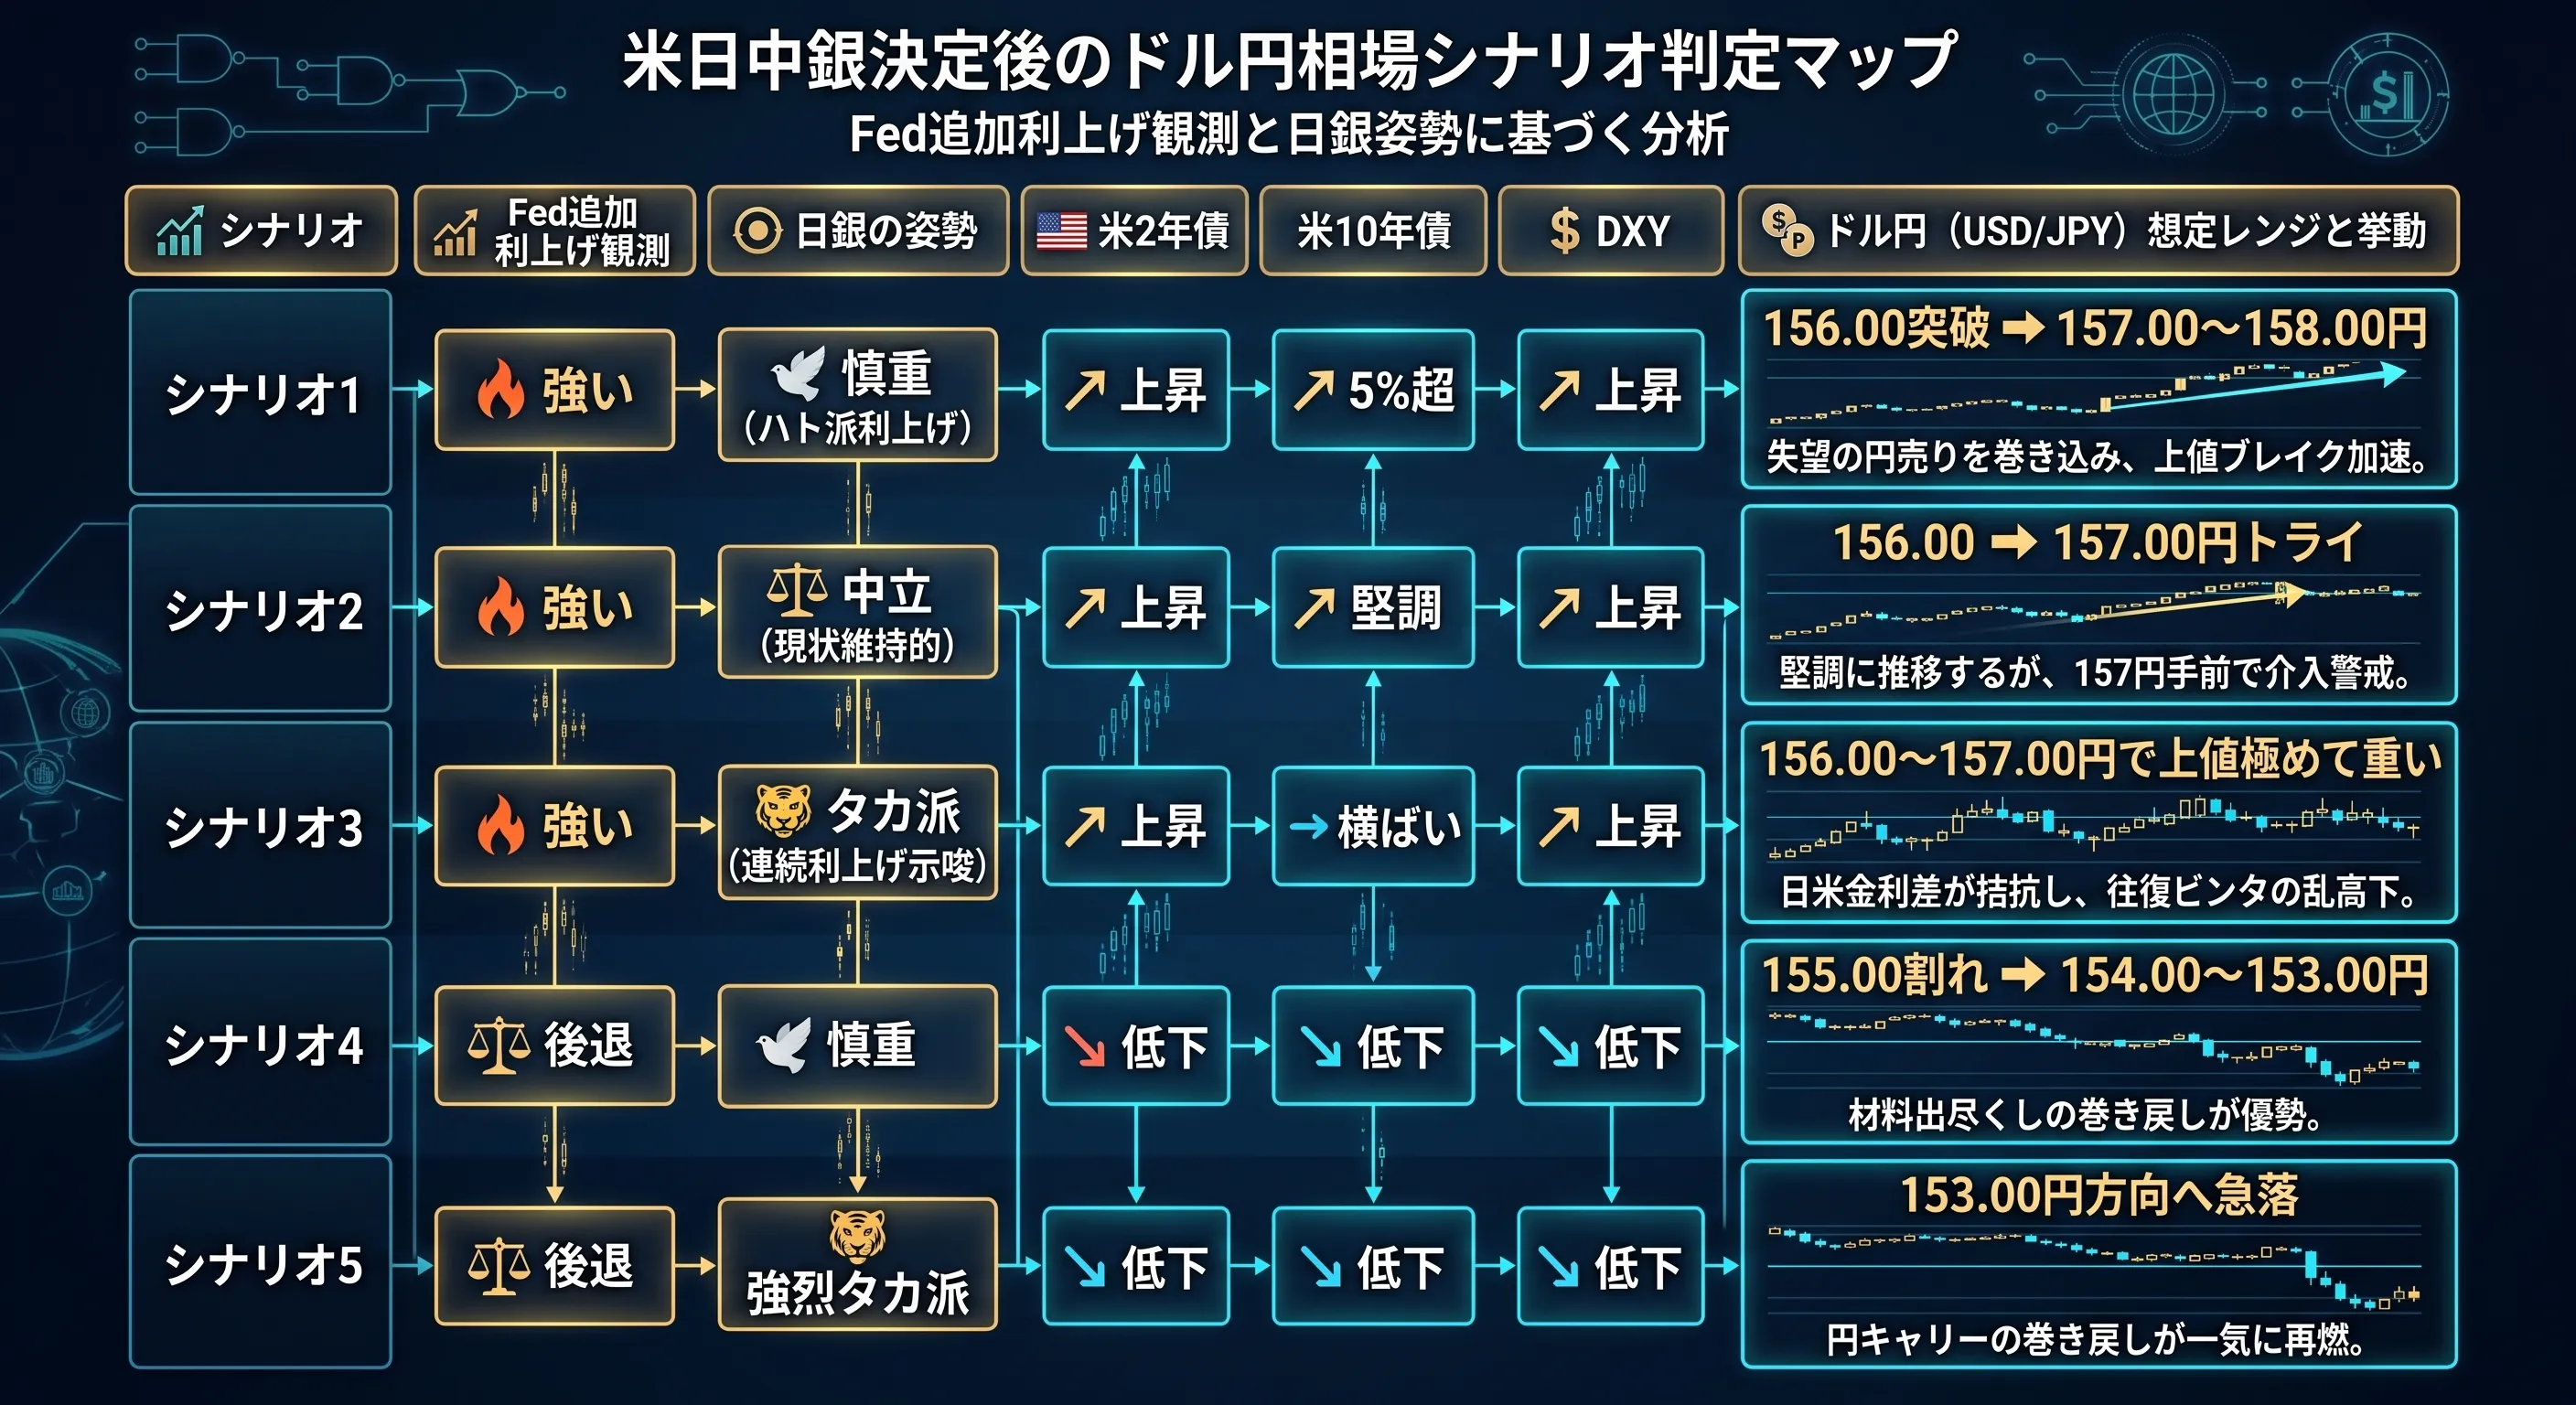
Chapter 3: U.S.-Japan central bank clash — “scenario branching” after FOMC and BOJ announcements
The biggest disruptor is the BOJ Monetary Policy Meeting on September 18. The market has already priced in a rate hike to 1.25% in about 90% of cases.
The real question is not whether BOJ will raise rates, but whether Governor Ueda will show a constructive stance toward an additional rate hike within the year (toward 1.50%).
Chapter 4: The “worst back-and-forth” scenario to watch out for
In a stage where major U.S. and Japanese events cascade, the most money to traders is drained by the following “time-lag trap.”
[Worst Back-and-Forth Pattern]
Following hawkish FOMC, USDJPY breaks 156.00 in the Asia session early hours
Long at the high with the thought, “Strong! Targeting 157”
BOJ meeting with 1.25% rate hike + Governor Ueda emphasizing “inflation upside risk”
Japan’s long-term interest rate (10-year government bond yield) surges to 3%, triggering heavy yen buying
USD/JPY collapses from 156.50 to 154.50 by about 2 yen, triggering a stop-out
To avoid this trap, it is essential not to enter solely based on the FOMC’s momentum immediately after the decision, and to wait for objective signals by reducing position size until BOJ results are known.
Summary
Because the FOMC showed an unexpectedly hawkish stance, the market’s balance tilted toward testing a breakout above 156 yen in the short term.
However, the 156–157 yen zone remains an extremely dangerous area where BOJ rate hikes and U.S.-Japan coordination risks (Bessent Agreement-style) loom in multiple layers.
Is the U.S. 2-year yield staying above 4.72%?
Can the U.S. 10-year yield recover to 5.00%?
Will the BOJ show a cautious (dovish) stance toward additional hikes?
Only when these three points align will a sustainable trend toward the 157-yen direction be established.
Without letting headlines sway your emotions, compare objective data from the four indicators with confirmed signals from indicators, and act calmly and decisively.